|
The Fed met expectations on policy actions, keeping rates unchanged, keeping quantitative easing as before, and leaving guidance unchanged. But “data dependency” is keeping markets on edge for when the Fed actually will curtail quantitative easing.
 Equities ended the past week mixed as blue chips posted slightly positive while techs and small caps declined. Stocks started the week slowly on Monday, little changed with some indexes marginally positive and other marginally negative. Many traders went to the sidelines ahead of the Wednesday FOMC decision as economic news for manufacturing and housing was sluggish at best. Tuesday, equities rallied on economic news that suggested the Fed will maintain quantitative easing. Headline retail sales dipped and consumer confidence dropped. Equities ended the past week mixed as blue chips posted slightly positive while techs and small caps declined. Stocks started the week slowly on Monday, little changed with some indexes marginally positive and other marginally negative. Many traders went to the sidelines ahead of the Wednesday FOMC decision as economic news for manufacturing and housing was sluggish at best. Tuesday, equities rallied on economic news that suggested the Fed will maintain quantitative easing. Headline retail sales dipped and consumer confidence dropped.
 Stocks declined Wednesday after the Federal Reserve said it had a weaker growth outlook for the economy. Trading was volatile following the release of the FOMC statement. While it had been widely expected that the Fed would not announce any adjustments to its $85 billion monthly bond buying program, the statement was not enough to extend a rally that has taken both the Dow and S&P 500 to repeated record highs. Stocks declined Wednesday after the Federal Reserve said it had a weaker growth outlook for the economy. Trading was volatile following the release of the FOMC statement. While it had been widely expected that the Fed would not announce any adjustments to its $85 billion monthly bond buying program, the statement was not enough to extend a rally that has taken both the Dow and S&P 500 to repeated record highs.
Equities declined Thursday on reconsideration of the Fed policy statement. Some began to think that the Fed is marginally more hawkish than earlier believed—increasing slightly the possibility of tapering in December although others still believe in the start of reduced bond purchases by the Fed next year. A better-than-expected Chicago PMI added to the view that the Fed might taper in December. On the other hand, disappointing corporate news tugged down on stocks—especially just before market close.
The week closed on a positive note with favorable corporate news. Also, a better-than-expected ISM manufacturing report was seen as showing the economy to be improving.
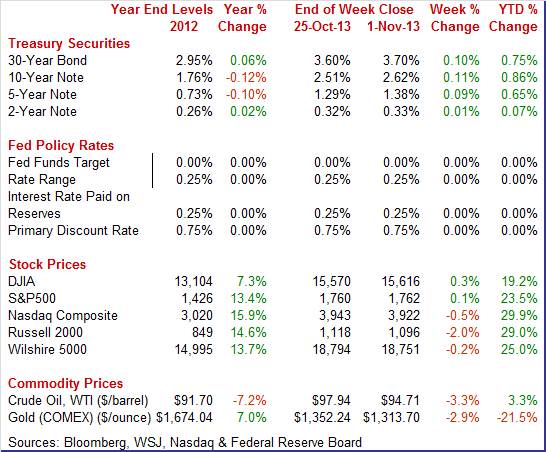
Equities were mixed this past week. The Dow was up 0.3 percent; the S&P 500, up 0.1 percent; the Nasdaq, down 0.5 percent; the Russell 2000, down 2.0 percent; and the Wilshire 5000, down 0.2 percent.
Equities were up in October despite two weeks of government shutdown. The Dow was up 2.8 percent; the S&P 500, up 4.5 percent; the Nasdaq, up 3.9 percent; the Russell 2000, up 2.5 percent; and the Wilshire 5000, up 4.1 percent.
For the year-to-date, major indexes are up as follows: the Dow, up 19.2 percent; the S&P 500, up 23.5 percent; the Nasdaq, up 29.9 percent; the Russell 2000, up 29.0 percent; and the Wilshire 5000, up 25.0 percent.
Weekly percent change column reflects percent changes for all components except interest rates. Interest rate changes are reflected in simple differences.
Treasury yields rose this past week, largely due to bond trader views that the Fed is marginally more inclined to begin tapering in December rather than early next year. After little change Monday and Tuesday, rates firmed Wednesday after the FOMC statement as some traders nudged their forecasts for taper to be sooner than believed prior to the policy decision. The bond market saw the Fed statement as indicating that the economy is improving. Rates edged marginally higher Thursday on news that the Chicago PMI improved to its fastest (but still moderate) pace in over two years. Economic news boosted yields Friday with better-than-expected ISM manufacturing. Bond traders clearly are paying attention to the Fed’s notice that taper is data dependent.
For this past week Treasury rates were up as follows: the 2-year note, up 1 basis point; the 5-year note, up 9 basis points; the 7-year note, up 14 basis points; the 10-year note, up 11 basis points; and the 30-year bond, up 10 basis points. The 3-month T-bill was unchanged.
 Except for a small rise on Monday, the spot price of West Texas Intermediate declined throughout the past week. Except for a small rise on Monday, the spot price of West Texas Intermediate declined throughout the past week.
Prices nudged up Monday on a dip in Libyan oil production.
But on Tuesday, crude eased marginally on belief that inventories were rising. At mid-week, WTI hit a four-month low mark after the Energy Information Administration said supplies rose 4.09 million barrels to 383.9 million for the latest reporting period—the prior week. Wednesday’s petroleum report continued to weigh on prices Thursday along with a rise in the dollar. On Friday WTI fell below $95 per barrel for the first time since June—again with supply a factor along with a gain in the dollar.
Net for the week, the spot price for West Texas Intermediate dropped $3.23 per barrel to settle at $94.71.
This past week, the Fed kept quantitative easing on its previous course. Economic news was very mixed. Recent data volatility is not helping the Fed decide on tapering.
 The Fed stayed the course on quantitative easing at the October 29-30 FOMC meeting. That is, there was no announcement of tapering. Not unexpected, policy rates remain unchanged with the fed funds target at a range of zero to 0.25 percent. The Fed stayed the course on quantitative easing at the October 29-30 FOMC meeting. That is, there was no announcement of tapering. Not unexpected, policy rates remain unchanged with the fed funds target at a range of zero to 0.25 percent.
The FOMC decided to continue purchasing additional agency mortgage-backed securities at a pace of $40 billion per month and longer-term Treasury securities at a pace of $45 billion per month. The Committee is maintaining its existing policy of reinvesting principal payments from its holdings of agency debt and agency mortgage-backed securities in agency mortgage-backed securities and of rolling over maturing Treasury securities at auction.
However, asset purchases are not on a preset course—they are data dependent. This leaves markets with some uncertainty and actually means that traders will have to pay attention to economic news—notably anything related to the labor market which is the Fed’s current focus.
 Guidance was unchanged with the Fed keeping a 6.5 percent unemployment rate and 2.5 percent expected inflation rate as thresholds for considering changes in policy. The FOMC sees persistently below target inflation as posing risks to economic performance. The Fed will also consider other information, including additional measures of labor market conditions, indicators of inflation pressures and inflation expectations, and readings on financial developments. The Fed gave no hint as to when quantitative easing might be curtailed—again, emphasis is on data dependency. Guidance was unchanged with the Fed keeping a 6.5 percent unemployment rate and 2.5 percent expected inflation rate as thresholds for considering changes in policy. The FOMC sees persistently below target inflation as posing risks to economic performance. The Fed will also consider other information, including additional measures of labor market conditions, indicators of inflation pressures and inflation expectations, and readings on financial developments. The Fed gave no hint as to when quantitative easing might be curtailed—again, emphasis is on data dependency.
The statement noted that the FOMC is still waiting for the labor market to improve “substantially.” The Fed said that while employment showed some improvement, the unemployment rate is still elevated. The FOMC recognized that inflation persistently below its 2 percent objective could pose risks to economic performance, but it anticipates that inflation will move back toward its objective over the medium term.
Notably, the Fed continued to state that accommodative monetary policy will remain appropriate for a considerable time after the asset purchase program ends and the economic recovery strengthens. This means that the fed funds rate will remain low even after the end of the Fed’s bond purchase programs.
The economy was characterized as expanding at a “moderate pace.” Fiscal policy is seen as a drag on the economy. However, downside risks to the economy are seen to have diminished.
The vote for the statement was 9 to 1 with Kansas City Fed’s Esther George dissenting. She was concerned that the continued high level of monetary accommodation increased the risks of future economic and financial imbalances and, over time, could cause an increase in long-term inflation expectations. Fed Governor Sarah Bloom Raskin did not attend the meeting.
The Fed’s latest policy decision specifically means that the Fed will continue to weigh down on long-term interest rates—notably Treasuries and mortgage rates. And there will be continued pressure on risk preferences toward riskier assets—away from bonds and toward equities and even housing.
 Retail sales in September were not good at the headline level but were positive at the core level. Retail sales slipped 0.1 percent in September, following a 0.2 percent rise in August. Analysts projected no change for September. Retail sales in September were not good at the headline level but were positive at the core level. Retail sales slipped 0.1 percent in September, following a 0.2 percent rise in August. Analysts projected no change for September.
As expected (from unit new auto sales) autos fell 2.2 percent after a 0.7 percent rebound in August. Retail sales excluding autos gained 0.4 percent after nudging up 0.1 percent in August. Gasoline sales were unchanged in September, following a 0.3 percent decline the month before. Excluding both autos and gasoline components, sales gained 0.4 percent, following a 0.1 percent rise in August.
 Core sales showed broad based gains. Within the core, increases were led by food & beverage stores, food services & drinking places, and electronics & appliance stores. Importantly, some of the components show improved discretionary spending. Also positive were furniture & home furnishings, building material & garden equipment, health & personal care, sporting goods & hobby & etc., general merchandise, and nonstore retailers. Core sales showed broad based gains. Within the core, increases were led by food & beverage stores, food services & drinking places, and electronics & appliance stores. Importantly, some of the components show improved discretionary spending. Also positive were furniture & home furnishings, building material & garden equipment, health & personal care, sporting goods & hobby & etc., general merchandise, and nonstore retailers.
On the downside were miscellaneous store retailers and clothing & accessory stores.
Auto sales have been volatile on a monthly basis due in part to off and on discounts by manufacturers but the level is healthy. And gasoline sales have been weighed down by prices recently. However, core sales over the last three months have been moderately healthy despite glum consumer sentiment. Apparently, consumers have to spend even if they are in a bad mood.
 A bright spot in the consumer sector has been auto sales. Even though the monthly change has been a little volatile, the trend has been upward since mid-2011. Vehicle sales in October were steady and strong, at a 15.2 million annual unit rate versus September's 15.3 million rate. Sales of domestic-made vehicles, boosted by promotion gains at GM, rose 0.6 percent to an 11.9 million rate while sales on the foreign-made side fell 3.3 percent to 3.4 million. Looking at vehicle types, sales of light trucks edged slightly higher to a 7.6 million rate while car sales slowed slightly, also to a 7.6 million rate. A bright spot in the consumer sector has been auto sales. Even though the monthly change has been a little volatile, the trend has been upward since mid-2011. Vehicle sales in October were steady and strong, at a 15.2 million annual unit rate versus September's 15.3 million rate. Sales of domestic-made vehicles, boosted by promotion gains at GM, rose 0.6 percent to an 11.9 million rate while sales on the foreign-made side fell 3.3 percent to 3.4 million. Looking at vehicle types, sales of light trucks edged slightly higher to a 7.6 million rate while car sales slowed slightly, also to a 7.6 million rate.
This report offers clues to the motor vehicle component of the retail sales report, a very large component that however is measured in dollars and excludes commercial sales. The latest results hint at a steady month for the component which has been very strong this year with year-on-year growth of 10.9 percent. Note that year-on-year growth in total unit sales is only about half of that, at 5.8 percent, and does not take into account price effects.
 The employment situation report for October has been delayed one week due to the lagged effects of the government shutdown. However, the ADP private employment report posted as originally scheduled this past week and offers a glimpse at the possible official outcome this coming week. The employment situation report for October has been delayed one week due to the lagged effects of the government shutdown. However, the ADP private employment report posted as originally scheduled this past week and offers a glimpse at the possible official outcome this coming week.
ADP reported a smaller-than-expected rise in private payroll growth, at 130,000 in October versus the Econoday consensus for 138,000. ADP's count for September was downwardly revised to 145,000 compared to an initial reading of 166,000. The initial reading for the comparable government number in September was 126,000.
The latest ADP report will likely add to concern over the effect of the government shutdown in October and over strength of nonfarm payroll growth in general. The Fed also likely gave the report more than usual attention with its policy statement following later in the afternoon.
 The government shutdown really weighed on consumer confidence which fell to 71.2 from a revised 80.2. With an 11 point drop, the dip is the largest since 12 points in January, a month that was also hit by a fiscal standoff in Washington. The government shutdown really weighed on consumer confidence which fell to 71.2 from a revised 80.2. With an 11 point drop, the dip is the largest since 12 points in January, a month that was also hit by a fiscal standoff in Washington.
But in what is a likely plus in the details, the weakness this month was centered entirely in expectations which fell from 84.7 to 71.5, a low for this year that ends 5 straight months of plus 80 readings for this component. Note that the DC standoff was likely resolved too late in the initial sampling for the Conference Board report where the cutoff for the preliminary reading was likely mid-month. There could be an upward revision to October’s headline when the full month sample for October is reported in November's report.
The component for the present situation continued to show much less volatility, at 70.7 versus 73.5 for what is a 4th straight reading over 70—a trend that is consistent with steady and soft month-on-month growth for the economy. A negative on the present situation side was a sharp 2.2 percentage point rise to 35.8 percent for those that describe jobs as hard to get. This suggests another month of weakness for monthly payroll growth.
 Despite an apparently good headline number for September for industrial production, the manufacturing sector remains sluggish. Growth in industrial production topped expectations-but it was all about atypically cool weather. Overall industrial production gained 0.6 percent in September, following a 0.4 percent rise in August (originally up 0.4 percent). Despite an apparently good headline number for September for industrial production, the manufacturing sector remains sluggish. Growth in industrial production topped expectations-but it was all about atypically cool weather. Overall industrial production gained 0.6 percent in September, following a 0.4 percent rise in August (originally up 0.4 percent).
The manufacturing component edged up 0.1 percent, following a 0.5 percent boost in August (originally up 0.7 percent). One of the positives was a rise in motor vehicle assemblies. Excluding motor vehicles, manufacturing was unchanged after a 0.2 percent rebound in August.
 The production of durable goods moved up 0.5 percent in September and advanced at an annual rate of 2.7 percent in the third quarter. The output of motor vehicles and parts increased 2.0 percent in September following a gain of 5.2 percent in August. The index for machinery rose 1.5 percent in September, and smaller increases were recorded in the production of wood products, of primary metals, of aerospace and miscellaneous transportation equipment, and of miscellaneous goods. Declines were recorded in the output of furniture and related products; computer and electronic products; electrical equipment, appliances and components; and nonmetallic mineral products. The production of durable goods moved up 0.5 percent in September and advanced at an annual rate of 2.7 percent in the third quarter. The output of motor vehicles and parts increased 2.0 percent in September following a gain of 5.2 percent in August. The index for machinery rose 1.5 percent in September, and smaller increases were recorded in the production of wood products, of primary metals, of aerospace and miscellaneous transportation equipment, and of miscellaneous goods. Declines were recorded in the output of furniture and related products; computer and electronic products; electrical equipment, appliances and components; and nonmetallic mineral products.
Nondurables production decreased 0.3 percent in September, for a third consecutive monthly decline, and edged down at an annual rate of 0.3 percent for the third quarter.
For the overall industrial production number, strength was in the volatile utilities component. The output of utilities surged 4.4 percent in September after a 0.9 percent dip the month before. The September jump was related to atypically cool weather boosting utilities demand. Production at mines advanced 0.2 percent, following a 0.6 percent boost in August.
Capacity utilization for total industry rose to 78.3 percent from 77.9 percent in August. Analysts projected 78.0 percent.
Despite the headline number, the manufacturing sector remains sluggish.
The latest manufacturing surveys at the national level give notably different pictures of this sector for October. The Markit survey was very soft while the ISM survey points toward moderate improvement.
Composite activity in Markit Economics' manufacturing sample was definitely on the soft side, at only 51.8 for final October which is the slowest final monthly rate in a year. The reading was over 50, which signals month-to-month growth, but not by much and has been trending lower since July. The October flash reading was 51.1 with final September at 52.8.
The new orders index, the report's leading component, was soft at 52.7 with new export orders, at 51.3, pointing to soft foreign demand. Backlog orders were slightly positive, at 51.4.
Output from this sample, at 50.6, continues to be very soft, in sharp contrast to the ISM's manufacturing sample where the reading has been over 60 for 3 months straight. Employment growth, at 52.7, has also been a bit softer in this report. Readings on prices and inventories are steady.
 In contrast to the Markit survey, the ISM's manufacturing sample continues to post healthy rates of growth, at 56.4 in October for the best reading since early in the recovery. The new orders index was a standout in the report, at 60.6 for the third 60 reading in a row. New export orders, at 57.0, indicate strength in foreign demand. Backlog orders were over 50 for the first time since April, at 51.5. In contrast to the Markit survey, the ISM's manufacturing sample continues to post healthy rates of growth, at 56.4 in October for the best reading since early in the recovery. The new orders index was a standout in the report, at 60.6 for the third 60 reading in a row. New export orders, at 57.0, indicate strength in foreign demand. Backlog orders were over 50 for the first time since April, at 51.5.
Coincident indicators were led by production at 60.8 for the fourth straight 60 reading.
Overall, national manufacturing surveys were mixed and gave little information on where the manufacturing sector is headed—especially after sluggish September numbers, including manufacturing within industrial production and core durables orders. Regional manufacturing surveys have been mixed but the latest for October is on the positive side.
 Texas factory activity picked up further in October, according to the Texas Manufacturing Outlook Survey. The production index, a key measure of state manufacturing conditions, rose from 11.5 to 13.3, suggesting output increased at a slightly faster pace than in September. Texas factory activity picked up further in October, according to the Texas Manufacturing Outlook Survey. The production index, a key measure of state manufacturing conditions, rose from 11.5 to 13.3, suggesting output increased at a slightly faster pace than in September.
Other measures of current manufacturing activity also indicated a slightly stronger expansion in October. The new orders index came in at 6.2, slightly above its September level, and marked a sixth consecutive month of increased demand. The capacity utilization index edged up to 11.9, and the shipments index rose 3 points to 13.2.
However, perceptions of broader business conditions were less optimistic in October. The general business activity index remained positive but fell to 3.6 after rising sharply to 12.8 in September. The company outlook index posted a fifth consecutive positive reading but moved down to 5.4 from 7.9 in September.
Expectations regarding future business conditions remained optimistic in October. The indexes of future general business activity and future company outlook declined from September levels but remained in strongly positive territory. Most indexes for future manufacturing activity also fell while remaining solidly positive.
 The housing market is supposed to be a center of strength for the economy but the pending home sales report for September suggests otherwise. This index has been down for four months in a row. Most recently, pending home sales fell a very sharp 5.6 percent in September, following a 1.6 percent dip the month before. The housing market is supposed to be a center of strength for the economy but the pending home sales report for September suggests otherwise. This index has been down for four months in a row. Most recently, pending home sales fell a very sharp 5.6 percent in September, following a 1.6 percent dip the month before.
Year-on-year, the index is down 1.2 percent for the first negative reading in nearly 2-1/2 years. The National Association of Realtors (NAR), which compiles the report, cites as a major factor the government shutdown which it says pushed government workers and contractors to the sidelines of the housing market.
Final sales of existing home sales had been slightly stronger than pending home sales but not by much, and the NAR says the latest report points to no better than a flat trend for final sales through the 4th quarter. One important factor constraining sales has been the rise underway in home prices, the result of thin supply on the market.
 Home-price appreciation picked up new steam in August, at an adjusted 0.9 percent versus 0.6 percent in July for the 20-city index. This is the first monthly acceleration since April when prices jumped 1.7 percent. The year-on-year rate showed special strength, at plus 12.8 percent for a 5 tenth gain from July and the best rate of the recovery. Home-price appreciation picked up new steam in August, at an adjusted 0.9 percent versus 0.6 percent in July for the 20-city index. This is the first monthly acceleration since April when prices jumped 1.7 percent. The year-on-year rate showed special strength, at plus 12.8 percent for a 5 tenth gain from July and the best rate of the recovery.
City data showed a clean 20-city sweep of monthly gains led by Las Vegas at 2.3 percent and Los Angeles at 1.7 percent. For the year-on-year rate, Las Vegas once again leads, at plus 29.2 percent followed by San Francisco at plus 25.4 percent. At plus 3.5 percent, the lowest is New York where however the rate has been steadily improving.
Home-price appreciation is a plus of course for homeowner wealth but higher prices are a big negative for home sales, a factor that is apparent in a run of home sales data including the latest pending home sales report.
 Inflation firmed slightly at the headline level in September while the core rate remained low. Consumer price inflation in September rose 0.2 percent, following a 0.1 percent rise the prior month. The core CPI-excluding food and energy-held steady at a rate of 0.1 percent. Inflation firmed slightly at the headline level in September while the core rate remained low. Consumer price inflation in September rose 0.2 percent, following a 0.1 percent rise the prior month. The core CPI-excluding food and energy-held steady at a rate of 0.1 percent.
By major components outside the core, energy jumped 0.8 percent, following a decline of 0.3 percent in August. Gasoline increased 0.8 percent (NSA-down 1.3 percent), following a dip of 0.1 percent the month before. Food prices were unchanged after edging up 0.1 percent in August.
 For the core measure, the shelter (up 0.2 percent) and medical care indexes (up 0.3 percent) accounted for most of this increase. The indexes for new vehicles (up 0.2 percent) and for airline fares (up 0.5 percent) rose as well, while the apparel (down 0.5 percent) and recreation (down 0.1 percent) indexes declined. For the core measure, the shelter (up 0.2 percent) and medical care indexes (up 0.3 percent) accounted for most of this increase. The indexes for new vehicles (up 0.2 percent) and for airline fares (up 0.5 percent) rose as well, while the apparel (down 0.5 percent) and recreation (down 0.1 percent) indexes declined.
Year-on-year, overall CPI inflation slowed to 1.2 percent from 1.5 percent in August (seasonally adjusted). The core rate came in at 1.7 percent versus 1.8 percent in August. On an unadjusted year-ago basis, the headline CPI in August was up 1.2 percent and the core was up 1.7 percent.
The year-ago slowing in the CPI gives the Fed room to continue to delay taper if the labor market improves.
 Producer price inflation eased at the headline level but firmed a bit at the core. The September producer price index declined 0.1 percent after rising 0.3 percent in August. The core rate, which excludes both food and energy, firmed to 0.1 percent after no change in August. The market forecast was for a 0.1 percent increase. Producer price inflation eased at the headline level but firmed a bit at the core. The September producer price index declined 0.1 percent after rising 0.3 percent in August. The core rate, which excludes both food and energy, firmed to 0.1 percent after no change in August. The market forecast was for a 0.1 percent increase.
 Food prices fell 1.0 percent in September after jumping 0.6 percent the month before. Energy increased 0.5 percent, following a surge of 0.8 percent in August. Gasoline prices dipped 0.1 percent after spiking 2.6 percent in August. Food prices fell 1.0 percent in September after jumping 0.6 percent the month before. Energy increased 0.5 percent, following a surge of 0.8 percent in August. Gasoline prices dipped 0.1 percent after spiking 2.6 percent in August.
A 0.6 percent increase in prices for motor vehicles led the advance in the finished core index.
For the overall PPI, the year-ago rate decelerated to 0.3 percent from 1.4 percent in August (seasonally adjusted). The core rate held steady at 1.2 percent in September. On a not seasonally adjusted basis for September, the year-ago headline PPI was up 0.3 percent, while the core was up 1.2 percent.
Inflation at the producer level remains very soft, leaving the Fed plenty of room to keep quantitative easing in place.
There is no getting around the fact that the latest economic news is mixed—probably a polite phrase. Manufacturing numbers are net sluggish although ISM is positive. Housing may be stalling based on pending home sales but demand is still improving enough to see gains in home prices. And the consumer is proving difficult to read. Core retail sales were moderately healthy even as confidence weakened. These are all reasons that the Fed may wait for more data before tapering.
This week’s highlight is the shutdown delayed employment report for October. After soft BLS numbers for September and sluggish ADP for October, will there be improvement enough to allow the Fed to taper' Also, adding to the Fed’s calculations will be the advance estimate for third quarter GDP and September personal income.
Factory orders fell 2.4 percent in July. The good news is that the decline was centered in transportation equipment, specifically aircraft. Excluding transportation, new orders rose 1.2 percent. Durable orders came in at minus 7.4 percent which is 1 tenth more severe than the initial estimate issued last week. The surprise in the report was a big bounce back in non-durable orders which, boosted by price effects for petroleum and coal, jumped 2.4 percent versus the prior month's 0.5 percent decline.
The Commerce Department is releasing data for both August and September.
Factory orders Consensus Forecast for August 13: +0.3 percent
Range: 0.0 to +2.0 percent
Factory orders Consensus Forecast for September 13: +1.7 percent
Range: +0.6 to +2.5 percent
The composite index from the ISM non-manufacturing survey slipped in September to 54.4 from 58.6 in August and 56.0 in July to indicate sizable slowing in composite activity. This slowing follows a recovery best in August and a near recovery best in July and despite the slowing the rate of monthly growth is still very respectable. But activity may be improving in coming months. Growth in new orders was more than respectable, at 59.6 which aside from August's 60.5 was the best rate since the easy comparisons early in the recovery. New export orders were also very strong, at 57.5 for a big 7 point jump.
ISM non-manufacturing composite index Consensus Forecast for October 13: 54.5
Range: 52.4 to 56.0
The Conference Board's index of leading indicators
The index of leading economic indicators jumped a very sharp and higher-than-expected 0.7 percent in August following a very solid revised gain of 0.5 percent in July. Gains were widespread and included gains for manufacturing orders and the factory workweek. Unemployment claims are also a positive in August and, like manufacturing readings, may extend into this month given the big drop underway as seen in latest jobless claims report. Readings on interest rates and credit activity were also strong positives. Other data included a rise in the coincident index, to plus 0.2 percent from plus 0.1 and zero percent in the two prior readings to indicate slight acceleration in ongoing growth. The lagging index is up 0.3 percent to hint at greater-than-expected growth in previously released data.
Leading indicators Consensus Forecast for September 13: +0.7 percent
Range: +0.4 to +0.8 percent
GDP for the third estimate for the second quarter was left unchanged at an annualized rate of 2.5 percent compared to the second estimate and compared to a first quarter rise of 1.1 percent. The biggest positive note was that demand numbers were bumped up slightly—though remained sluggish. Final sales of domestic product were revised up to 2.1 percent from the second estimate of 1.9 percent. This series increased 0.2 percent in the first quarter. Final sales to domestic producers (which exclude net exports) also were nudged up to 2.1 percent versus the second estimate of 1.9 percent. This followed a 0.5 percent gain in the first quarter. Headline inflation for the GDP price index was revised down to 0.6 percent compared to the second estimate of a 0.8 percent annualized inflation rate. When excluding food and energy, inflation for the second quarter was nudged down to 0.9 percent from the second estimate of 1.1 percent annualized.
Real GDP Consensus Forecast for advance estimate Q3 13: +2.0 percent annual rate
Range: +1.5 to +2.7 percent annual rate
GDP price index Consensus Forecast for advance estimate Q3 13: +1.4 percent annual rate
Range: +0.9 to +1.9 percent annual rate
Initial jobless claims in the October 26 week came in at 340,000, which was 10,000 below the prior week but more than 30,000 above the month-ago trend. Counting problems in California, tied to a computer changeover, are no longer inflating the numbers, nor are government contractors who were filing claims during the government shutdown in the first half of the month. Inflated by these factors, the 4-week average has risen sharply for 4 straight weeks, to 356,250 in the latest week which is the highest reading since April. Continuing claims continued to be less volatile than initial claims, up 31,000 to 2.881 million in the latest data which are for the October 19 week. The 4-week average has been steady, down 10,000 in the latest week to 2.879 million.
Jobless Claims Consensus Forecast for 11/2/13: 335,000
Range: 330,000 to 345,000
Consumer credit outstanding rebounded in August, but it was not all good news. Consumer credit increased $13.6 billion from $10.4 billion in July and compared to $14.4 billion in June. Non-revolving gained $14.5 billion in a component that primarily includes auto loans and student loans. The subcomponents are not seasonally adjusted but the auto component likely rose as unit new motor vehicle sales were up 1.8 percent in August. Student loans have been gaining but, again, the subcomponent is not seasonally adjusted. The government has been acquiring existing student loans from private lenders. On the negative side, revolving credit showed another decline that points to limited consumer activity. Revolving credit, the component where credit card debt is tracked, was down for a third straight month in the August report, slipping $0.9 billion. This is the longest losing streak for revolving credit in three years and points to consumer caution which is not welcome news for retailers.
Consumer credit Consensus Forecast for September 13: +$12.0 billion
Range: +$8.7 billion to +$16.0 billion
Nonfarm payroll employment in September advanced 148,000, following a revised increase of 193,000 for August and after a revised gain of 89,000 for July. The net revisions for July and August were up 9,000. The unemployment rate slipped to 7.2 percent after dipping to 7.3 percent in August. Analysts expected a 7.3 percent unemployment rate. But the improvement was largely related to a decline in the pool of available workers, affecting the number of unemployed.
Turning back to payroll data, growth in recent months has been on a slowing trend. Private payrolls gained 126,000, following an increase of 161,000 in August. Wage growth eased in September, rising only 0.1 percent for average hourly earnings, following 0.2 percent the month before. On a year ago basis average hourly earnings were up only 2.2 percent—the same pace as in August. The average workweek held steady at 34.5 hours.
Nonfarm payrolls Consensus Forecast for October 13: 120,000
Range: -300,000 to +168,000
Private payrolls Consensus Forecast for October 13: +128,000
Range: +110,000 to +170,000
Unemployment rate Consensus Forecast for October 13: 7.3 percent
Range: 7.2 to 7.6 percent
Average workweek Consensus Forecast for October 13: 34.5 hours
Range: 34.4 to 34.5 hours
Average hourly earnings Consensus Forecast for October 13: +0.2 percent
Range: +0.1 to +0.2 percent
Personal income in August gained 0.4 percent after rising 0.2 percent in July. The wages & salaries component rebounded 0.4 percent in August, following a 0.3 percent decline the month before. Overall spending rose 0.3 percent after a 0.2 percent increase in July. Headline inflation remained soft with a 0.1 percent rise for the PCE price index, equaling the pace in July and meeting expectations. The PCE core inflation rate nudged up to 0.2 percent in August versus a 0.1 percent rise the month before.
Personal income Consensus Forecast for September 13: +0.3 percent
Range: +0.1 to +0.4 percent
Personal consumption expenditures Consensus Forecast for September 13: +0.2 percent
Range: +0.1 to +0.4 percent
PCE price index Consensus Forecast for September 13: +0.1 percent
Range: +0.1 to +0.2 percent
Core PCE price index Consensus Forecast for September 13: +0.1 percent
Range: +0.1 to +0.2 percent
The Reuter's/University of Michigan's consumer sentiment index fell to 73.2 in the final October reading, down from 75.2 at mid-month and down from 77.5 in final September. The decline appears to have been building up steam with the implied reading for the second half of the month in the low 70s which is the lowest indication in 2 years. The weakness was centered in the expectations component which fell to 62.5 vs 63.9 at mid-month and versus 67.8 in final September. The temporary resolution in Washington did not give any boost with the implied reading for the last two in the low 60s and another 2-year low for this report. The consumer's assessment of current conditions is much less volatile, at 89.9 versus 92.8 at mid-month and versus 92.6 for final September. Still, the latest reading is going in the wrong direction.
Consumer sentiment Consensus Forecast for preliminary November 13: 75.0
Range: 72.0 to 77.0
The Labor Department’s Job Openings and Labor Turnover Survey showed 3.883 million job openings on the last business day of August, up from July at a revised 3.808 million. The job openings rate improved slightly to 2.8 percent from 2.7 percent in July. The hires rate was unchanged at 3.3 percent in August while the separations rate edged up to 3.2 percent from 3.1 percent in July. These series are somewhat volatile on a monthly basis. The average monthly change over the last three months is down 8,000 for openings, down 1,000 for hires, and down 2,000 for separations. The hires and separations trends remain on a lower trajectory than openings-indicating that firms are having a hard time finding qualified applicants. And meanwhile, hires are only modestly above separations.
No consensus numbers are available for this month’s report
R. Mark Rogers is the author of The Complete Idiot’s Guide to Economic Indicators, Penguin Books.
Econoday Senior Writer Mark Pender contributed to this article.
|
