|
Markets got relief this past week from worries about the federal budget and debt ceiling. But the relief is temporary. But for now, equities rallied sharply and the Treasury market soothed. Meanwhile, traders are waiting on the federal government to catch up on its releases of economic indicators that were delayed due to the government shutdown.
 Equities rose significantly this past week on enacted legislation for stop gap measures to end the government shutdown and to take care of the federal budget ceiling and potential default. Equities rose significantly this past week on enacted legislation for stop gap measures to end the government shutdown and to take care of the federal budget ceiling and potential default.
But a deal between the Senate, the House, and the Administration was not seen as absolutely certain early in the week. Stocks were up Monday on belief in progress on a budget deal but equities fell sharply Tuesday as there was no deal before market close and the House appeared to be continuing to require a deal to include changes to ObamaCare.
 However, on Wednesday stocks rallied after bi-partisan Senate leaders crafted a deal which President Obama supported. Senate leaders late Tuesday announced a compromise that would temporarily raise the nation's debt ceiling and fully reopen the government. The House of Representatives also said it would vote to approve the plan. The relief to the markets was that it appeared that the federal government would dodge default as its borrowing authority (debt ceiling) would otherwise be hit Thursday, October 17. President Obama signed the budget legislation shortly after midnight, October 17, leading to a rally in equities during the trading day. However, on Wednesday stocks rallied after bi-partisan Senate leaders crafted a deal which President Obama supported. Senate leaders late Tuesday announced a compromise that would temporarily raise the nation's debt ceiling and fully reopen the government. The House of Representatives also said it would vote to approve the plan. The relief to the markets was that it appeared that the federal government would dodge default as its borrowing authority (debt ceiling) would otherwise be hit Thursday, October 17. President Obama signed the budget legislation shortly after midnight, October 17, leading to a rally in equities during the trading day.
Euphoria over the budget deal continued to lift stocks Thursday and Friday despite elevated initial jobless claims and some slippage in the Philly Fed manufacturing index.
The sequestration and debt ceiling issues will have to be addressed again early in 2014.
Equities were up this past week. The Dow was up 1.1 percent; the S&P 500, up 2.4 percent; the Nasdaq, up 3.2 percent; the Russell 2000, up 2.8 percent; and the Wilshire 5000, up 2.5 percent.
For the year-to-date, major indexes are up as follows: the Dow, up 17.5 percent; the S&P 500, up 22.3 percent; the Nasdaq, up 29.6 percent; the Russell 2000, up 31.2 percent; and the Wilshire 5000, up 24.4 percent.
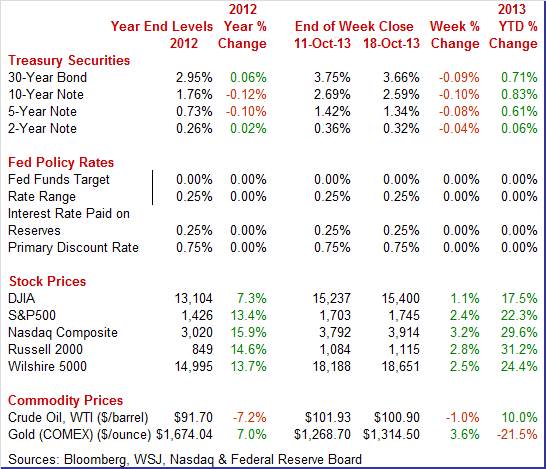
Weekly percent change column reflects percent changes for all components except interest rates. Interest rate changes are reflected in simple differences.
 The Treasury market opened Tuesday after a Monday holiday for Columbus Day. The Treasury market opened Tuesday after a Monday holiday for Columbus Day.
Treasury yields were down notably this past week and it was mostly about budget legislation being enacted—meaning federal default would not take place for now. Also, the two-week government shutdown is seen as cutting into economic growth, raising the odds that the Fed will not cut back on its quantitative easing programs at the October 29-30 FOMC meeting. Plus, the Fed is seen as not getting positive economic data to support tapering.
 The biggest move in the Treasury market was the decline in the one-month T-bill which dropped to 0.01 percent from 0.26 percent the week before. The drop was due to payment on the bill no longer being at risk of default. The biggest move in the Treasury market was the decline in the one-month T-bill which dropped to 0.01 percent from 0.26 percent the week before. The drop was due to payment on the bill no longer being at risk of default.
For this past week Treasury rates were down as follows: 3-month T-bill, down 4 basis points; the 2-year note, down 4 basis points; the 5-year note, down 8 basis points; the 7-year note, down 10 basis points; the 10-year note, down 10 basis points; and the 30-year bond, down 9 basis points.
 The spot price of West Texas Intermediate was down modestly this past week. There were only three notable daily swings in price. Crude declined a little over a dollar a barrel Tuesday on worries about the federal budget impasse. WTI gained somewhat more than a dollar a barrel Wednesday on news that the Senate had reached a deal to temporarily raise the U.S. debt ceiling and to end the government shutdown. The spot price of West Texas Intermediate was down modestly this past week. There were only three notable daily swings in price. Crude declined a little over a dollar a barrel Tuesday on worries about the federal budget impasse. WTI gained somewhat more than a dollar a barrel Wednesday on news that the Senate had reached a deal to temporarily raise the U.S. debt ceiling and to end the government shutdown.
Crude fell about a buck and a half on Thursday after a government report (one day later due to the Monday holiday) reported a boost in oil inventories and a separate report showed initial jobless claims to be higher than expected. WTI was little changed Friday.
Net for the week, the spot price for West Texas Intermediate eased $1.03 per barrel to settle at $100.90.
The limited economic news points to a mixed but largely sluggish recovery.
This past week’s Beige Book did not point toward tapering at the upcoming October 29-30 FOMC meeting. The recovery is characterized as continuing at a "modest to moderate" pace. Growth decelerated in 4 Fed districts but remained about the same in 8 districts. Employment growth was seen as modest in September. Several Districts reported that contacts were cautious to expand payrolls, citing uncertainty surrounding the implementation of the Affordable Care Act and fiscal policy more generally.
There were some modest positives in the report. Consumer spending continued to increase. Business spending and payrolls grew in many Districts. Demand for nonfinancial services rose, and manufacturing activity also expanded modestly. The automotive and aerospace industries continued to be a source of strength in a number of Districts.
Residential construction continued to increase at a moderate pace. However, nonresidential construction again expanded at a slower rate.
Price pressures remained limited in September. Most Districts reported only slight increases in commodity prices and limited ability to pass through these increases to their customers. Energy prices in most Districts were steady to slightly lower than during the prior reporting period.
Overall, the recovery is making slow progress according to Beige Book contacts. Employment news likely is not where the Fed wants it to be and inflation remains soft. Odds are for very little or no taper with the October 30 FOMC statement. But at least the Fed will get the delayed employment report for September before the policy meeting. The Bureau of Labor Statistics rescheduled the Friday, October 4 release of the employment situation to Tuesday, October 22.
Current activity manufacturing activity decelerated in New York State while it accelerated in the Philly Fed District. Both showed improvement in new orders.
 For October, the Empire State general business conditions index slipped to just over zero, at 1.52 to indicate a slight rate of growth in general conditions, down from September's 6.29. For October, the Empire State general business conditions index slipped to just over zero, at 1.52 to indicate a slight rate of growth in general conditions, down from September's 6.29.
But the new orders index accelerated slightly, from 2.35 and 0.27 in the prior two months to 7.75 which is the best reading since March.
Other details included a second solid month for shipments and very strong readings for 6-month expectations. Negatives include slowing in jobs growth and continued contraction in backlog orders. Price data show steady upward pressure for raw materials but very little pressure for finished goods.
 Turning to the Philly Fed report, there was no sign of any effect from the government shutdown in the Mid-Atlantic manufacturing region where growth has been suddenly surging the last two months. The Philly Fed's general business conditions index, at 19.8 in October versus September's 22.3, has now been over 20 or near 20 for 3 of the last 4 months which is the best run since early 2011. Turning to the Philly Fed report, there was no sign of any effect from the government shutdown in the Mid-Atlantic manufacturing region where growth has been suddenly surging the last two months. The Philly Fed's general business conditions index, at 19.8 in October versus September's 22.3, has now been over 20 or near 20 for 3 of the last 4 months which is the best run since early 2011.
The surge was made more convincing by an even stronger showing for the report's leading index—the new orders index—which at 27.5 this month and 21.2 last month showed its first back-to-back 20 reading since late 2004. Unfilled orders, at 9.1 vs September's 4.3, are at a 2-1/2 year high.
Other readings include gains for shipments and employment and a build in inventories all of which confirm strength. And delivery times are lengthening which is another sign of strength. Price pressures are moderate and centered in raw materials but include some pressure for finished goods, again further indications of activity.
A special strength in the latest report was a near record high of 60.8 for the 6-month outlook, a reading last exceeded in early 2003.
Limited news on the economic indicator front shows a spotty recovery with recent worries about the federal budget and debt ceiling weighing on the economy. Manufacturing is mixed while the Beige Book indicates a sluggish period in the recovery.
The government shutdown ended last week (for now) and federal statistical agencies are scrambling to catch up on indicator releases. The below is a summary of key indicator release schedule changes as of Friday afternoon ET, October 18.
From the Bureau of Labor Statistics
Release |
Reference Period |
Previously Scheduled
Release Date |
Revised Release Date |
Employment Situation |
September 2013 |
Fri., Oct. 4, 2013 |
Tue., Oct. 22, 2013 |
U.S. Import and Export Price Indexes |
September 2013 |
Thursday, October 10, 2013 |
Wednesday, October 23, 2013 |
Job Openings and Labor Turnover Survey |
August 2013 |
Tue., Oct. 8, 2013 |
Thu., Oct. 24, 2013 |
Producer Price Index |
September 2013 |
Fri., Oct. 11, 2013 |
Tue., Oct. 29, 2013 |
Consumer Price Index |
September 2013 |
Wed., Oct. 16, 2013 |
Wed., Oct. 30, 2013 |
Employment Situation |
October 2013 |
Fri., Nov. 01, 2013 |
Fri., Nov. 8, 2013 |
Employment Cost Index |
Third Quarter 2013 |
Thu., Oct. 31, 2013 |
Tue., Nov. 19, 2013 |
From the Federal Reserve
Release |
Reference Period |
Previously Scheduled
Release Date |
Revised Release Date |
Industrial Production |
September 2013 |
Thu., Oct. 17, 2013 |
Mon., Oct. 28, 2013 |
From the Energy Information Administration
Release |
Reference Period |
Previously Scheduled
Release Date |
Revised Release Date |
Petroleum Status Report |
September 2013 |
Thu., Oct. 17, 2013 |
Mon., Oct. 21, 2013 |
Natural Gas Report |
September 2013 |
Thu., Oct. 17, 2013 |
Tue., Oct. 22, 2013 |
New schedules for delayed reports have not been released by the Bureau of the Census, the BEA, or private companies (such as the Conference Board).
First Friday is now fourth Tuesday for the September jobs report. Employment will be this week’s highlight—especially as the Fed will get new numbers on the labor market ahead of its October 29-30 policy meeting. Manufacturing has been mixed, meaning this week’s durables orders report will be key for an update on this sector. Housing has been wavering and the main reports will be existing home sales and FHFA home prices. New home sales—originally scheduled for this coming week—have been postponed due to the recent government shutdown.
The Chicago Fed National Activity Index is delayed due to missing data from government sources due to the recent government shutdown. Led by a surge in production, the national activity index jumped to plus 0.14 in August from minus 0.43 in July. Production-related indicators contributed 0.22 to the index in August after a minus 0.20 reading in July. Employment-related indicators turned positive but just barely, to plus 0.02 from minus 0.03. Also positive was the sales/orders/inventories component which moved to plus 0.07 from minus 0.03. Remaining in the negative column was consumption & housing, at minus 0.17 versus July's minus 0.18.
No consensus numbers are available for this month’s report
Existing home sales came in at a 5.480 million annual rate in August consensus for 5.255 million. The monthly 1.7 percent gain was on top of July's giant 6.5 percent surge when "panic" over rising rates moved buyers into the market. Another factor besides higher rates that is holding down sales is lack of homes on the market, at 4.9 months at the current sales rate versus 5.0 and 5.1 months in the two prior months.
Existing home sales Consensus Forecast for September 13: 5.30 million-unit rate
Range: 5.20 to 5.50 million-unit rate
Nonfarm payroll employment in August gained 169,000, following a revised increase of 104,000 for July (originally up 162,000) and after a revised advance of 172,000 for June (previous estimate was 188,000). The market median forecast was for a 175,000 gain for August. The net revisions for June and July were down 74,000. Private payrolls rose 152,000, following a gain of 127,000 in July (originally 161,000). Wage growth improved. Average hourly earnings rose 0.2 percent in August after no change the month before. Expectations were for a 0.2 percent gain. The average workweek was up slightly to 34.5 hours from 34.4 hours in July. Analysts forecast 34.5 hours. The unemployment rate dipped to 7.3 percent from 7.4 percent in July. However, the unemployment rate fell for the wrong reason. Turning to detail for the household survey, household employment in August fell 115,000 after jumping 227,000 in July. The labor force dropped 312,000, following a 37,000 dip in July. The number of unemployed declined 198,000 after a drop of 263,000 in July. Essentially, declining labor force participation is at least partly behind the easing in the unemployment rate. The soft labor market has led to a greater number of discouraged workers.
Nonfarm payrolls Consensus Forecast for September 13: 185,000
Range: 155,000 to 240,000
Private payrolls Consensus Forecast for September 13: 184,000
Range: 154,000 to 245,000
Unemployment rate Consensus Forecast for September 13: 7.3 percent
Range: 7.1 to 7.4 percent
Average workweek Consensus Forecast for September 13: 34.5 hours
Range: 34.4 to 34.6 hours
Average hourly earnings Consensus Forecast for September 13: +0.2 percent
Range: +0.1 to +0.3 percent
The Richmond Fed manufacturing index showed no change in September versus August with the index at zero. Details showed a slight monthly dip in shipments and hiring. New orders slowed but still showed growth relative to August, though at a slower rate than August relative to July.
No consensus numbers are available for this month’s report
Import prices were unchanged in the August report following a slight 0.1 percent revised uptick in July that follows 4 prior months of declines. Year-on-year, import prices are down 0.4 percent. When stripping out petroleum, import prices are down 0.2 percent for a 4th straight decline. Petroleum, up 0.8 percent in August, was one of the few components showing upward pressure. Otherwise, minus signs sweep the import components including another sweep of small downticks for finished goods.
Import prices Consensus Forecast for September 13: +0.2 percent
Range: -0.1 to +0.9 percent
Export prices Consensus Forecast for September 13: -0.1 percent
Range: -0.3 to +0.3 percent
The FHFA purchase only house price index advanced a strong 1.0 percent after increasing 0.6 percent in June. The June HPI was the eighteenth consecutive monthly price increase in the purchase-only, seasonally adjusted index. The gain was led by a 2.2 percent gain in the Pacific Census region. Showing the largest monthly decline was the East South Central region, down 0.7 percent. Seven of nine Census regions showed gains in the latest month while two decreased. The year-on-year rate for July posted at 8.8 percent versus 7.8 percent in June.
FHFA purchase only house price index Consensus Forecast for July 13: +0.8 percent
Range: +0.5 to +1.2 percent
Initial jobless claims for the October 12 week eased 15,000 to 358,000. This followed a surge of 65,000 the week before. Temporary layoffs in the private sector tied to the government shutdown as well as extended distortions tied to a backlog problem in California continued to skew higher initial jobless claims. Reflecting the last two weeks of sharply higher readings, the 4-week average was up 11,750 to 336,500 which was more than 20,000 higher than the month-ago comparison. But with the government shutdown now past and with the backlog in California likely to ease, initial claims may very well begin coming back down in the reports ahead.
Jobless Claims Consensus Forecast for 10/19/13: 335,000
Range: 319,000 to 350,000
The Markit PMI manufacturing index (final) held steady, at 52.8 for the final September reading versus the same 52.8 at mid-month and only very slightly lower than 53.1 for the final August reading. In a very slight positive, growth in new orders edged higher the last two weeks of September month with the component ending at 53.2 versus 52.7 at mid-month. But this reading is down a noticeable 2.5 points from August's 55.7 to indicate slowing.
Markit PMI manufacturing flash index Consensus Forecast for October 13: 52.7
Range: 52.0 to 53.5
The Labor Department’s Job Openings and Labor Turnover Survey in July showed that jobs were harder to find that month. There were 3.689 million job openings on the last business day of July, down marginally from June at a revised 3.869 million. The job openings rates slipped to 2.6 percent from 2.8 percent in June. This release is produced by the Labor Department and the scheduled release time may be affected by federal government budget issues.
JOLTS job openings Consensus Forecast for August 13: 3.725 million
Range: 2.865 million to 3.780 million
The new home sales report, originally scheduled for Thursday October 24, is delayed due to the recent government shutdown. New home sales rebounded 7.9 percent in August after plunging 14.1 percent the month before. August’s annualized rate of 421,000 was up 25.1 percent on a year-ago basis. Downward revisions, though modest this time around, appeared for the third month in a row and included a 4,000 downward revision to July. The number of new homes for sale rose 6,000 in the month to an adjusted 175,000 but supply relative to sales, given the August jump in sales, slipped to 5.0 months from 5.2 months in the very soft sales month of July. But supply was up relative to June's 4.3 months and to low 4 month readings earlier in the year and against 4.6 months in August last year.
New home sales Consensus Forecast for September 13: 420 thousand-unit annual rate
Range: 413 thousand to 447 thousand-unit annual rate
The Kansas City Fed manufacturing index decelerated in September. The month-over-month composite index was 2 in September, down from 8 in August and 6 in July. The composite index is an average of the production, new orders, employment, supplier delivery time, and raw materials inventory indexes. The production index decreased at both durable and non-durable goods-producing plants, with the exception of machinery and computer equipment factories which posted slight gains. Most other month-over-month indexes also fell. The production index plunged from 21 to 4, and the shipments, new orders, and order backlog indexes also decreased. However, the outlook appears to be more positive. Most future factory indexes improved considerably from the previous month. The future composite index jumped from 9 to 18, its highest level since March 2012, and the future production, shipments, and new orders indexes also reached 18-month highs.
No consensus numbers are available for this month’s report
Durable goods orders have been volatile but the trend outside of aircraft and autos remains the same—anemic in recent months. August durables orders beat expectations but July was revised down notably. New factory orders for durables in August edged up 0.1 percent after dropping a huge 8.1 percent in July. The transportation component rose 0.7 percent after a monthly 21.9 percent plunge in July. The transportation rebound came from motor vehicles. Excluding transportation, durables orders slipped 0.1 percent, following a decrease of 0.5 percent in July.
New orders for durable goods Consensus Forecast for September 13: +2.5 percent
Range: +0.4 percent to +7.0 percent
New orders for durable goods, ex-trans., Consensus Forecast for September 13: +0.5 percent
Range: -0.2 percent to +1.1 percent
The Reuter's/University of Michigan's consumer sentiment index slipped to 75.2 in the mid-month October reading versus 77.5 for final September and 76.8 for the mid-month September reading. But the current conditions component was actually up in the mid-month October reading, to 92.8 versus 92.6 in final September and 91.8 at mid-month September. Weakness was entirely on the expectations side where the component fell to 63.9 versus 67.8 in final September and 67.2 in mid-month September.
Consumer sentiment Consensus Forecast for final October 13: 74.8
Range: 72.5 to 78.0
R. Mark Rogers is the author of The Complete Idiot’s Guide to Economic Indicators, Penguin Books.
Econoday Senior Writer Mark Pender contributed to this article.
|
