|
With limited data available for economic indicators due to the government shutdown, markets focused whether there appeared to not be progress or to be progress on the fiscal front. Developments at the Fed also got market attention.
 This past week equities were up moderately strong, although there were sharp daily moves in both directions. The week started with a significant drop as lack of progress in ending the partial U.S. government shutdown or the debt-ceiling standoff kept investors wary. The negative mood of investors continued Tuesday with large declines in stocks as little progress was seen in resolving either the budget or debt ceiling issues. The continuing federal government shutdown also weighed on equities. This past week equities were up moderately strong, although there were sharp daily moves in both directions. The week started with a significant drop as lack of progress in ending the partial U.S. government shutdown or the debt-ceiling standoff kept investors wary. The negative mood of investors continued Tuesday with large declines in stocks as little progress was seen in resolving either the budget or debt ceiling issues. The continuing federal government shutdown also weighed on equities.
 But news after Tuesday close helped to set the stage for an end to the plunge early in the week. The White House emailed news Tuesday night (the White House web site is largely shut down due to the government shutdown) that President Obama on Wednesday would nominate Fed Vice Chair Janet Yellen to be the next chair of the Fed when Chairman Ben Bernanke's term as chair expires January 31. On Wednesday, equities were little changed and mixed due to offsetting news about or from the Fed. Markets saw the Yellen nomination as positive and a continuation of loose monetary policy. However, Wednesday’s release of FOMC minutes indicated that the decision to not taper was a close call, suggesting that there was more inclination to taper in September than earlier known by the markets. But news after Tuesday close helped to set the stage for an end to the plunge early in the week. The White House emailed news Tuesday night (the White House web site is largely shut down due to the government shutdown) that President Obama on Wednesday would nominate Fed Vice Chair Janet Yellen to be the next chair of the Fed when Chairman Ben Bernanke's term as chair expires January 31. On Wednesday, equities were little changed and mixed due to offsetting news about or from the Fed. Markets saw the Yellen nomination as positive and a continuation of loose monetary policy. However, Wednesday’s release of FOMC minutes indicated that the decision to not taper was a close call, suggesting that there was more inclination to taper in September than earlier known by the markets.
On Thursday, stocks surged as House Republican leaders proposed a short-term increase in the debt ceiling that would reduce the prospects for a U.S. default. The plan would push the lapse of U.S. borrowing authority to November 22 from October 17 but would not end the 10-day old partial shutdown of the federal government. The White House press secretary indicated that President Barack Obama would support a short increase in the U.S. debt limit with no “partisan strings attached,” though he prefers a longer extension. Equities rose notably on Friday on belief that progress was being made to raise the debt ceiling and avoid default by the Treasury.
Equities were mostly up this past week. The Dow was up 1.1 percent; the S&P 500, up 0.8 percent; the Nasdaq, down 0.4 percent; the Russell 2000, up 0.6 percent; and the Wilshire 5000, up 0.5 percent.
For the year-to-date, major indexes are up as follows: the Dow, up 16.3 percent; the S&P 500, up 19.4 percent; the Nasdaq, up 25.6 percent; the Russell 2000, up 27.7 percent; and the Wilshire 5000, up 21.3 percent.
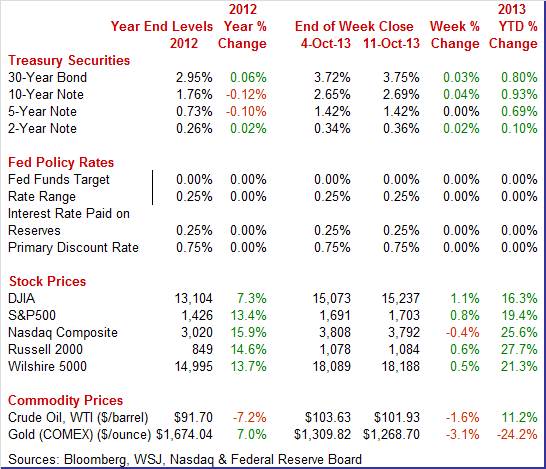
Weekly percent change column reflects percent changes for all components except interest rates. Interest rate changes are reflected in simple differences.
 Treasury yields were mostly up moderately this past week. An exception was the one-month T-bill which was up significantly. Treasury yields were mostly up moderately this past week. An exception was the one-month T-bill which was up significantly.
On Monday Treasury yields slipped on flight to safety on worries about lack of progress on fiscal issues. But rates rose Tuesday—especially on the short end—on worries that the Treasury might default on payments coming due in the short term. Worries about default pushed most yields up as Treasury holders continued to be concerned about whether the Treasury would be able to make payments after the October 17 ceiling deadline.
 Treasuries were mixed Thursday as optimism began to sink in that a deal on raising the debt ceiling might be reached soon. Rates also were mixed Friday and little changed. Treasuries were mixed Thursday as optimism began to sink in that a deal on raising the debt ceiling might be reached soon. Rates also were mixed Friday and little changed.
The big story was on the very short end—the one-month T-bill. Over the past two weeks, the yield on the one-month bill has risen significantly—by 23 basis points from .03 percent to 0.26 percent. This bill’s rate has jumped on worries of increased odds that the Treasury might default when payment on this short note is due shortly after the October 17 deadline. Traders in the Treasuries market are more skeptical of progress on the debt ceiling than are those in equities.
For this past week Treasury rates were mostly up as follows: 3-month T-bill, up 4 basis points; the 2-year note, up 2 basis points; the 7-year note, up 3 basis points; the 10-year note, up 4 basis points; and the 30-year bond, up 3 basis points. The 5-year note was unchanged.
 The spot price of West Texas Intermediate eased this past week. Daily movement was not just related to perceptions of progress or not on the federal government debt ceiling. On Monday, prices slipped somewhat under a dollar a barrel after Tropical Storm Karen passed through the Gulf and workers were able to return to drilling platforms. Crude rose Tuesday as oil traders saw tentative progress on fiscal issues—notably potential legislation giving President Obama authority to raise the debt ceiling for a year unless two-thirds of both chambers of Congress disapprove. The spot price of West Texas Intermediate eased this past week. Daily movement was not just related to perceptions of progress or not on the federal government debt ceiling. On Monday, prices slipped somewhat under a dollar a barrel after Tropical Storm Karen passed through the Gulf and workers were able to return to drilling platforms. Crude rose Tuesday as oil traders saw tentative progress on fiscal issues—notably potential legislation giving President Obama authority to raise the debt ceiling for a year unless two-thirds of both chambers of Congress disapprove.
At mid-week, WTI dropped $2 per barrel on unexpectedly high inventories. Crude inventories jumped to 370.5 million barrels in the week ended October 4, the most since July 5. On Thursday crude rose a buck and a half on belief that a deal was closer to boost the U.S. debt ceiling.
Incidentally, the Energy Information Administration announced this past Friday that it would not be able to process data and provide reports until after the government shutdown ends (implicitly, with passage of a budget). At week’s close, WTI fell a dollar a per barrel on news that the International Energy Agency forecast an increase in North American production that would take share away from OPEC.
Net for the week, the spot price for West Texas Intermediate declined $1.69 per barrel to settle at $101.93.
With the government shutdown, economic indicator news was limited. The big news outside of updates on the fiscal impasse was FOMC minutes, indicating a close call on taper.
The debate within the Fed at the latest FOMC meeting clearly was on the warm side. However, several members saw whether to taper as a “close call.” Those opposed to tapering in September took the position that the economy was too weak—notably job growth was inadequate. FOMC members arguing to taper indicated that not tapering would hurt the Fed’s credibility. Adding to the weight of arguments against tapering were Fed staff economists warning that tapering could hurt economic growth due in part to higher mortgage rates. The minutes said that Fed officials were well aware that markets had expected the start of taper in September.
FOMC participants saw current growth as moderate but noted that retail sales had softened. Downside risks to the economy were seen to have diminished somewhat but there were worries about potential headwinds.
Financial stability was a concern of staff economists. Also, the staff revised down its forecast for GDP growth but still expected some acceleration in 2014 and 2015.
Even though it appears that tapering is being delayed by a soft economy, the Fed is thinking about preparations for not just tapering but also dealing with its vastly elevated balance. The Fed approved testing the use of reverse repurchase agreements to help control assets. The minutes emphasized this consideration does not alter current policy decisions.
The bottom line is that the taper debate continues and in the near term, Fed officials preferring to wait on starting to taper are still in the majority—especially as they wait for economic data to improve. And the dearth of data will make it harder to taper sooner than later.
 Consumer sentiment is down but not by a lot with the assessment of current conditions showing no significant change which is a welcome indication for October activity. Sentiment slipped to 75.2 in the mid-month October reading versus 77.5 for final September and 76.8 for the mid-month September reading. But the current conditions component was actually up in the mid-month October reading, to 92.8 versus 92.6 in final September and 91.8 at mid-month September. Consumer sentiment is down but not by a lot with the assessment of current conditions showing no significant change which is a welcome indication for October activity. Sentiment slipped to 75.2 in the mid-month October reading versus 77.5 for final September and 76.8 for the mid-month September reading. But the current conditions component was actually up in the mid-month October reading, to 92.8 versus 92.6 in final September and 91.8 at mid-month September.
 Weakness is entirely on the expectations side where the component fell to 63.9 versus 67.8 in final September and 67.2 in mid-month September. This will raise talk that the ongoing stand-off in Washington is weakening confidence in future job and earnings prospects. Weakness is entirely on the expectations side where the component fell to 63.9 versus 67.8 in final September and 67.2 in mid-month September. This will raise talk that the ongoing stand-off in Washington is weakening confidence in future job and earnings prospects.
However, another measure of the consumer mood points to greater slippage in consumer confidence. A separate reading on the 12-month economic outlook was down a very sharp 15 points to 71 in a reading that underscores sharp weakness in the national economy component of this past week’s Bloomberg consumer comfort index. Bloomberg commentary points to disarray in Washington as largely behind the decline.
 Consumer credit outstanding rebounded in August, but it was not all good news. Consumer credit increased $13.6 billion from $10.4 billion in July and compared to $14.4 billion in June. Consumer credit outstanding rebounded in August, but it was not all good news. Consumer credit increased $13.6 billion from $10.4 billion in July and compared to $14.4 billion in June.
Non-revolving gained $14.5 billion in a component that primarily includes auto loans and student loans. The subcomponents are not seasonally adjusted but the auto component likely rose as unit new motor vehicle sales were up 1.8 percent in August.
Student loans have been gaining but, again, the subcomponent is not seasonally adjusted. The government has been acquiring existing student loans from private lenders.
On the negative side, revolving credit showed another decline that points to limited consumer activity. Revolving credit, the component where credit card debt is tracked, was down for a third straight month in the August report, slipping $0.9 billion. This is the longest losing streak for revolving credit in three years and points to consumer caution which is not welcome news for retailers.
Economic data was sparse this past week. The consumer sector remains cautious—especially as many civilian federal workers remain furloughed. However, it appears that the Fed will be cautious about tapering asset purchases too soon or too fast.
The federal government shutdown continues resulting in postponing key federal government indicators—including the CPI and housing starts. Even non-federal indicators have been affected if the indicator depends in part on federal government numbers. As a result, the Fed’s industrial production report and the Conference Board’s leading indicators announcement will be delayed. What are left from the original schedule are regional Fed surveys (Empire and Philly Fed), the Beige Book, jobless claims, and NAHB housing market index. The Beige Book and jobless claims likely will get extra attention to see if the labor market is improving enough for tapering to begin before the end of this year.
U.S. Holiday: Columbus Day. Markets Open, Banks Closed.
The Empire State manufacturing index slowed in September to 6.29 from 8.24 the month before. The new orders index rose to 2.35 in the latest reading for September, but the level is very close to dead-flat zero. The index was nearly at zero in August at 0.27 after drifting in the low positive single digits to low negative single digits since March. The regional Fed’s survey is not affected by the Federal government shutdown.
Empire State Manufacturing Survey Consensus Forecast for October 13: 7.00
Range: -2.00 to 10.00
The consumer price index report scheduled for October 16 likely is going to be delayed due to the government shutdown.
The consumer price index in August posted a modest 0.1 percent rise, compared to July’s 0.2 percent and June’s 0.5 percent. The core CPI—excluding food and energy—edged up 0.1 percent after rising 0.2 percent the month before. By major components outside the core, energy declined 0.3 percent after edging up 0.2 percent in July. Gasoline slipped 0.1 percent, following an increase of1.0 percent the prior month. Food edged up 0.1 percent, matching the pace in July.
CPI Consensus Forecast for September 13 +0.2 percent
Range: -0.1 to +0.3 percent
CPI ex food & energy Consensus Forecast for September 13: +0.2 percent
Range: +0.1 to +0.2 percent
NAHB housing market index for September was unchanged at 58 (prior month revised down 1 point) with the 6-month outlook the strongest component in the data. The component for present sales is nearly as strong with the traffic component on the rise but still trailing noticeably which suggests that buyers are high powered and flashing cash. Though mortgage rates are now a negative for the new home market, rising rates are likely hitting less affluent buyers the hardest.
NAHB housing market index Consensus Forecast for October 13: 58
Range: 55 to 60
The Beige Book being prepared for the October 29-30 FOMC meeting is released Wednesday afternoon. The Fed will be looking for sufficient signs in the economy and the labor market in particular to see if tapering is warranted at this policy meeting. With the dearth of government data from the shutdown, the Beige Book likely will get more market attention.
Housing starts, originally scheduled for release October 17, have been postponed due to the government shutdown.
Housing starts rose in August but only because July was revised down. Housing starts in in August advanced 0.9 percent after rebounding 5.7 percent in July. The August starts annualized level of 0.891 million units was up 19.0 percent on a year-ago basis. July was revised down to 0.883 million units from the original estimate of 0.896 million. The gain in starts was led by the single-family component which increased 7.0 percent after declining 3.0 percent the prior month. The volatile multifamily component declined 11.1 percent after jumping 28.7 percent in July. Forward momentum is slipping. Permits fell 3.8 percent after a 3.9 percent rebound in July. August’s annualized pace of 0.918 million units was up 11.0 percent on a year-ago basis. Weakness for the latest month was in the multifamily component.
Housing starts Consensus Forecast for September 13: 0.913 million-unit rate
Range: 0.880 million to 0.975 million-unit rate
Housing permits Consensus Forecast for September 13: 0.935 million-unit rate
Range: 0.900 million to 1.010 million-unit rate
Initial jobless claims spiked in the October 5 week. The surge was mostly tied to continued counting problems in California and was only partially the result of the government shutdown. About 1/2 of a gigantic 66,000 increase in initial claims in the October 5 week reflected backlog issues in California from a computer changeover last month, while about 15,000 of the increase reflected claims from non-Federal workers including contractors who have been hit by the government shutdown. Federal employees are not included in headline claims with the latest data for this category available only for the September 21 week which was of course before the shutdown hit. The giant spike lifted claims to 374,000 which is the highest level since March. The jobless claims report is not being affected by the government shutdown as it is produced by the Labor Department’s Employment and Training Administration (ETA) and not by the BLS. ETA in part was been deemed essential while the BLS was not.
Jobless Claims Consensus Forecast for 10/12/13: 330,000
Range: 301,000 to 360,000
Industrial production is delayed as the Fed announced that it is postponing its release of industrial production, earlier scheduled for October 17. The Fed does not have access to its usual data from the Federal government. Production worker hours are a key input and the BLS did not release the employment situation as scheduled due to the government shutdown.
Overall industrial production posted a 0.4 percent increase in August, following no change in July (originally unchanged). Analysts projected a 0.5 percent jump for August. The manufacturing component jumped 0.7 percent, following a 0.4 percent decrease in July. Gains were broadly based but led by motor vehicles. Excluding motor vehicles, manufacturing rebounded 0.4 percent after a 0.1 percent dip in July. The output of utilities fell 1.5 percent in August, following a 1.3 percent decline the prior month. This was this component’s fifth consecutive decrease. Production at mines advanced 0.3 percent after a 2.4 percent jump the month before. Mining activity has increased five months in a row. Capacity utilization for total industry rebounded to 77.8 percent from 77.6 percent in July.
Industrial production Consensus Forecast for September 13: +0.4 percent
Range: +0.1 to +0.9 percent
Manufacturing production component Consensus Forecast for September 13: +0.3 percent
Range: +0.2 to +0.6 percent
Capacity utilization Consensus Forecast for September 13: 78.1 percent
Range: 77.9 to 80.3 percent
The general business conditions index of the Philadelphia Fed's Business Outlook Survey was notably stronger in September, jumping from 9.3 in August to a healthy 22.3 to show the greatest rate of monthly growth in 2-1/2 years. The strength was supported by a big jump in new orders to 21.2 from August's 5.3 with backlog orders, at plus 4.3, showing a rare build. The regional Fed’s survey is not affected by the Federal government shutdown.
Philadelphia Fed survey Consensus Forecast for October 13: 15.0
Range: -2.0 to 27.5
The Conference Board's index of leading indicators will not be released as scheduled for October 18, according to the Conference Board, due to missing component data resulting from the government shutdown.
The index of leading economic indicators jumped a very sharp and higher-than-expected 0.7 percent in August following a very solid revised gain of 0.5 percent in July. Gains were widespread and included gains for manufacturing orders and the factory workweek. Unemployment claims are also a positive in August and, like manufacturing readings, may extend into this month given the big drop underway as seen in latest jobless claims report. Readings on interest rates and credit activity were also strong positives. Other data included a rise in the coincident index, to plus 0.2 percent from plus 0.1 and zero percent in the two prior readings to indicate slight acceleration in ongoing growth. The lagging index is up 0.3 percent to hint at greater-than-expected growth in previously released data.
Leading indicators Consensus Forecast for September 13: +0.6 percent
Range: +0.1 to +0.7 percent
R. Mark Rogers is the author of The Complete Idiot’s Guide to Economic Indicators, Penguin Books.
Econoday Senior Writer Mark Pender contributed to this article.
|
