|
Markets are still waiting on Washington to resolve the federal budget impasse and the federal debt ceiling is still pending later this month. Meanwhile, markets have been left with less economic news and guidance due to the partial shutdown of the federal government.
 Major equity indexes ended the week mixed on notable daily swings on changes in belief on resolving passage of a federal budget and ending the government shutdown and furloughs. Major equity indexes ended the week mixed on notable daily swings on changes in belief on resolving passage of a federal budget and ending the government shutdown and furloughs.
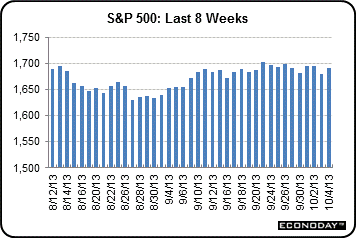 On Monday—the last day of the fiscal year—stocks declined as it became more apparent that a Congressional agreement would not be reached in time to avoid a partial government shutdown at midnight ET when the new fiscal year would begin on October 1. However, equities rebounded Tuesday on belief that the government shutdown (due to lack of statutory funding) would be short lived and that the economic impact would be minor. On Monday—the last day of the fiscal year—stocks declined as it became more apparent that a Congressional agreement would not be reached in time to avoid a partial government shutdown at midnight ET when the new fiscal year would begin on October 1. However, equities rebounded Tuesday on belief that the government shutdown (due to lack of statutory funding) would be short lived and that the economic impact would be minor.
Stocks headed back down Wednesday as traders reassessed the impact of the government shutdown. Attention was called to the pending second fiscal problem—the federal debt ceiling. Treasury Secretary Jack Lew said that the Treasury has begun to use the last of its extraordinary measures to stay below the debt ceiling. He indicated that the ceiling likely would be reached October 17, according to Treasury estimates.
Thursday was the third day of the government shutdown and that weighed on stocks. Also, the ISM non-manufacturing report came in sluggish, adding to concern that the government shutdown could lead to recession if a budget was not passed soon. The week ended on a positive note after comments by House Speaker John Boehner (Republican) that he would not allow default on U.S. debt. He stated his willingness to work with Democrats to end the budget impasse.
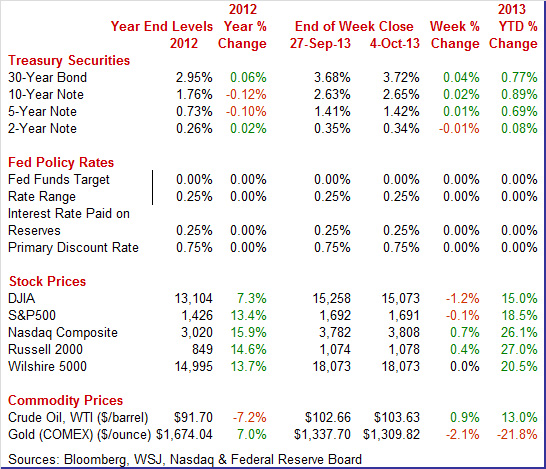
Equities were mixed this past week. The Dow was down 1.2 percent; the S&P 500, down 0.1 percent; the Nasdaq, up 0.7 percent; the Russell 2000, up 0.4 percent; and the Wilshire 5000, up 0.1 percent.
For the year-to-date, major indexes are up as follows: the Dow, up 15.0 percent; the S&P 500, up 18.5 percent; the Nasdaq, up 26.1 percent; the Russell 2000, up 27.0 percent; and the Wilshire 5000, up 20.6 percent.
Weekly percent change column reflects percent changes for all components except interest rates. Interest rate changes are reflected in simple differences.
 This past week, Treasury yields mainly reacted to views on how long the government shutdown would last. However, limited economic news did have some impact. Rates firmed Tuesday on a better-than-expected ISM manufacturing index but dipped Wednesday on a soft ADP employment report. Rates nudged down further Thursday on a weaker-than-expected ISM non-manufacturing index. Yields gained Friday on belief that the government shutdown would end soon. Friday’s moves tipped the balance for the week’s net changes which were quite modest given the hoopla in Washington. This past week, Treasury yields mainly reacted to views on how long the government shutdown would last. However, limited economic news did have some impact. Rates firmed Tuesday on a better-than-expected ISM manufacturing index but dipped Wednesday on a soft ADP employment report. Rates nudged down further Thursday on a weaker-than-expected ISM non-manufacturing index. Yields gained Friday on belief that the government shutdown would end soon. Friday’s moves tipped the balance for the week’s net changes which were quite modest given the hoopla in Washington.
For this past week Treasury rates mostly were up as follows: 3-month T-bill, up 1 basis point; the 5-year note, up 1 basis point; the 7-year note, up 2 basis points; the 10-year note, up 2 basis points; and the 30-year bond, up 4 basis points. The 2-year note slipped 1 basis point.
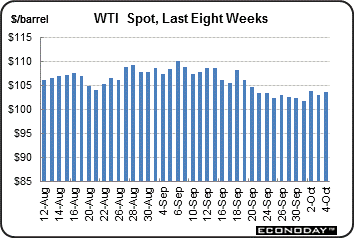 The spot price of West Texas Intermediate rose only marginally this past week but remained elevated. The biggest two daily moves were Wednesday and Thursday. The spot price of West Texas Intermediate rose only marginally this past week but remained elevated. The biggest two daily moves were Wednesday and Thursday.
WTI rose more than $2 per barrel Wednesday on news that TransCanada Corp. said it expects to complete work on the southern portion of its Keystone pipeline expansion by the end of October. Completion will relieve supply at Cushing, Oklahoma—the key distribution point for U.S. oil production. WTI fell a little under a dollar a barrel Thursday on worries about the government shutdown. Other daily changes were very small.
Crude bumped up for the week even though the government shutdown weighed on prices due to possible reduction in economic growth.
Net for the week, the spot price for West Texas Intermediate rose 96 cents per barrel to settle at $103.62.
The economy continues to muddle along with non-government employment numbers coming in soft and manufacturing perhaps regaining slight momentum. The Fed continues to debate when to taper.
The employment situation report for September and scheduled for release on October 4 was delayed due to the partial shutdown of the federal government. It is unknown when the report will be released other than after enactment of a budget for the current fiscal year.
 The main alternative to the employment situation report is the ADP private employment report which posted this past week as scheduled. The main alternative to the employment situation report is the ADP private employment report which posted this past week as scheduled.
ADP reported a weaker-than-expected rise in private payroll growth, to 166,000 in September. ADP's count for August was downwardly revised to 159,000 versus an initial reading of 176,000.
The initial reading for the comparable BLS number in August for private payrolls was 152,000.
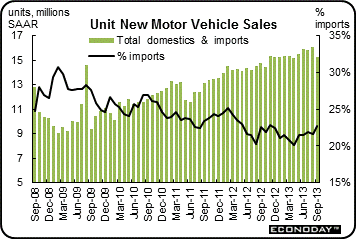 As for other sectors, the consumer sector is wavering. Total vehicle sales fell a sharp 5.1 percent in September, following a 1.8 percent rise the month before. September's 15.3 million annualized sales pace is up 3.4 percent on a year ago basis. As for other sectors, the consumer sector is wavering. Total vehicle sales fell a sharp 5.1 percent in September, following a 1.8 percent rise the month before. September's 15.3 million annualized sales pace is up 3.4 percent on a year ago basis.
September's drop was led by domestic trucks, down a monthly 7.3 percent with domestic cars down 5.1 percent. Import cars slipped 1.0 percent but import trucks edged up 0.4 percent.
Sales of domestic vehicles stood at 11.8 million in September, compared to 12.6 million in August.
The September numbers point to a very weak headline number for retail sales and the durable goods portion of personal consumption in GDP.
Although not gangbusters, manufacturing is still in the positive column with growth modest, according to national surveys. Markit Economics' PMI manufacturing index held steady, at 52.8 for the final September reading versus the same 52.8 at mid-month and only very slightly lower than 53.1 for the final August reading. In a very slight positive, growth in new orders edged higher the last two weeks of September month with the component ending at 53.2 versus 52.7 at mid-month. But this reading is down a noticeable 2.5 points from August's 55.7 to indicate slowing.
This report has been showing less strength in recent months than the more closely watched ISM report where readings on order growth are at or near recovery highs.
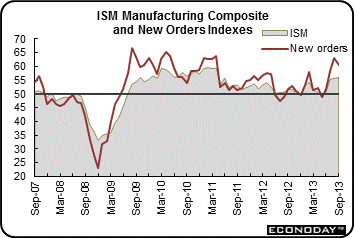 The ISM manufacturing report showed modest acceleration in composite activity during September to 56.2 versus 55.7 in August. This is the best reading since early in the recovery when comparisons against soft rates of growth made for magnified gains. The ISM manufacturing report showed modest acceleration in composite activity during September to 56.2 versus 55.7 in August. This is the best reading since early in the recovery when comparisons against soft rates of growth made for magnified gains.
The new orders index, which is a leading indicator, slowed but not much and was still at a very strong rate of monthly growth and above 60 for a second month at 60.5 versus August's 63.2. Other order readings were less positive with new export orders down 3.5 points to 52.0 while backlogs remain in contraction though just barely at 49.5 for a 3 point improvement from August.
Coincident readings are very strong with production growth rising 2 tenths to 62.6, which is a third straight 60 reading, and with employment up a solid 2.1 points to 55.4 to show the strongest rate of monthly growth since June last year.
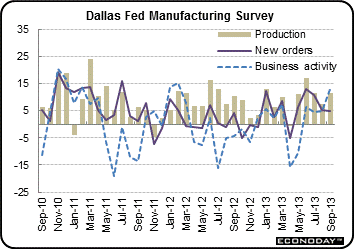 There was positive news on manufacturing from the Dallas Fed. Texas factory activity expanded in September, according to business executives responding to the Texas Manufacturing Outlook Survey. The production index, a key measure of state manufacturing conditions, rose from 7.3 to 11.5, suggesting output increased at a slightly faster pace than in August. There was positive news on manufacturing from the Dallas Fed. Texas factory activity expanded in September, according to business executives responding to the Texas Manufacturing Outlook Survey. The production index, a key measure of state manufacturing conditions, rose from 7.3 to 11.5, suggesting output increased at a slightly faster pace than in August.
Other measures of current manufacturing activity indicated continued growth in September. The capacity utilization index rose 6 points to a reading of 10.7. The new orders index was 5, largely unchanged from its August level. The shipments index edged down from 11.4 to 10.3.
Perceptions of broader business conditions improved further in September. The general business activity index jumped nearly 8 points to 12.8, its highest reading in a year and a half. The company outlook index posted a fourth consecutive positive reading and came in at 7.9, little changed from August.
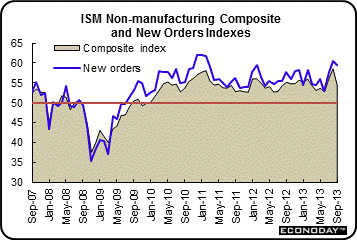 The ISM non-manufacturing index slipped to 54.4 from 58.6 in August and 56.0 in July to indicate sizable slowing in composite activity. This slowing follows a recovery best in August and a near recovery best in July and despite the slowing the rate of monthly growth is still very respectable. The ISM non-manufacturing index slipped to 54.4 from 58.6 in August and 56.0 in July to indicate sizable slowing in composite activity. This slowing follows a recovery best in August and a near recovery best in July and despite the slowing the rate of monthly growth is still very respectable.
But activity may be improving in coming months. Growth in new orders was more than respectable, at 59.6 which aside from August's 60.5 was the best rate since the easy comparisons early in the recovery. New export orders were also very strong, at 57.5 for a big 7 point jump.
But other readings on current activity are definitely soft including slowing rates of growth in business activity and, what is a negative indication for the labor market, employment where the index fell 4.3 points to 52.7 for the slowest rate since January.
Economic data show an economy that is sluggish and mixed. The consumer sector took a step backward with motor vehicle sales while manufacturing may be taking half a step forward. The Fed will almost certainly be thinking about softness in the economy and headwind from fiscal issues—with fiscal issues not being resolved until at least later this month. And the lack of indicator data will likely delay any decision on Fed taper of QE.
Federal government indicators release dates may change due to fiscal budget impact on Commerce Department and Labor Department work schedules. Indicators produced by the Federal Reserve and private companies are not affected. Indicators not released by government agencies this past week may be released this week on an unscheduled basis if federal budget issues are resolved. Potential unscheduled (or with modest notice) releases may include the employment situation, factory orders, and construction outlays. New release times will be posted on Econoday web calendars as they become available. Based on original schedules, the main focus of traders will be Fed minutes of the September 17-18 FOMC meeting and this release is not affected by federal budget issues. The minutes may provide some clarity on when Fed asset purchases may taper. Next, retail sales on Friday stand out as a key reading on the consumer sector.
Consumer credit outstanding grew at a slightly slower pace in July, up $10.4 billion versus a revised $11.9 billion in June. Revolving credit showed weakness for a second month, down $1.8 billion versus June's dip of $3.7 billion in declines that suggest credit-card use is down. Non-revolving credit once again showed strength which for July, because of slowing in the student-loan category, points to financing for vehicle sales which, however, were not that strong in the month. This release is produced by the Federal Reserve and the scheduled release time is not affected by federal government budget issues.
Consumer credit Consensus Forecast for August 13: +$12.9 billion
Range: +$8.3 billion to +$17.0 billion
The NFIB Small Business Optimism Index was little changed in August, at 94.0 versus July's 94.1, but details are widely mixed. Standout positives were sharp gains for hiring plans and for sales expectations offset by a sharp decline in earnings trends and dips for both current job openings and economic expectations. The gain for hiring plans lifts this reading to new a recovery high. This release is produced by a private company and the scheduled release time is not affected by federal government budget issues.
NFIB Small Business Optimism Index Consensus Forecast for September 13: 93.5
Range: 92.5 to 95.0
The U.S. international trade gap worsened in July but remained relatively low after an especially good June number. The trade gap widened to $39.1 billion from $34.4 billion in June. Exports dipped 0.6 percent, following a 2.2 percent gain in June. Imports rose 1.6 percent in July after a 2.2 percent decline the month before. The worsening in the trade gap was primarily due to the nonpetroleum goods deficit which grew to $38.7 billion in July from $35.0 billion in June. The petroleum deficit increased to $18.7 billion from $17.5 billion in June. The services surplus slipped to $19.4 billion from $19.5 billion. This release is produced by the Commerce Department and the scheduled release time may be affected by federal government budget issues.
International trade balance Consensus Forecast for August 13: -$40.0 billion
Range: -$42.0 billion to -$38.2 billion
The Labor Department’s Job Openings and Labor Turnover Survey in July showed that jobs were harder to find that month. There were 3.689 million job openings on the last business day of July, down marginally from June at a revised 3.869 million. The job openings rates slipped to 2.6 percent from 2.8 percent in June. This release is produced by the Labor Department and the scheduled release time may be affected by federal government budget issues.
JOLTS job openings Consensus Forecast for August 13: 3.725 million
Range: 2.865 million to 3.780 million
Wholesale inventories edged 0.1 percent higher in July following an unrevised 0.2 percent contraction in June. Sales at the wholesale level also edged 0.1 percent higher in July after rising 0.4 percent in June. The stock-to-sales ratio for the sector is at 1.17 for both months. In general, inventory levels through the economy continue to remain stable and balanced in a low growth environment. This release is produced by the Commerce Department and the scheduled release time may be affected by federal government budget issues.
Wholesale inventories Consensus Forecast for August 13: +0.4 percent
Range: +0.1 to +0.6 percent
The Minutes of the September 17-18 FOMC meeting are scheduled for release at 2:00 p.m. ET. Traders will be focusing on internal Fed debate about when to taper and on what determined the September 18 decision to not taper yet.
Initial jobless claims were at or near their lowest point of the recovery going into the government shutdown. Initial claims were little changed in the September 28 week, up only 1,000 to 308,000 with the prior week revised very slightly higher, up 2,000 to 307,000. These are the second and third lowest levels of the recovery. The 4-week average is at a new recovery low, at 305,000 for a fifth straight decline. The average is trending more than 20,000 below the month-ago comparison which is a convincing signal of month-to-month improvement in labor conditions. A factor skewing future reports will be furloughed government workers with federal employees not counted in the headline numbers unlike contractors many of whom will be.
Even though this release is produced by a federal agency, it is planned to be released regardless of federal budget issues being resolved or not.
Jobless Claims Consensus Forecast for 10/5/13: 310,000
Range: 305,000 to 320,000
Import prices were unchanged in the August report following a slight 0.1 percent revised uptick in July that follows 4 prior months of declines. Year-on-year, import prices are down 0.4 percent. When stripping out petroleum, import prices are down 0.2 percent for a 4th straight decline. Petroleum, up 0.8 percent in August, was one of the few components showing upward pressure. Otherwise, minus signs sweep the import components including another sweep of small downticks for finished goods.
Import prices Consensus Forecast for September 13: +0.2 percent
Range: -0.1 to +0.9 percent
Export prices Consensus Forecast for September 13: -0.1 percent
Range: -0.3 to +0.3 percent
The U.S. Treasury monthly budget report showed a deficit in August at a heavy at $147.9 billion though without special factors, specifically this year's early Labor Day which pulled benefit payments into August from September, the deficit was $107.0 billion. More importantly, the government's deficit 11 months into the fiscal year is down a very sizable 35 percent to $755.3 billion. Tax increases gave a boost to this year's receipts which are up a year-to-date 13 percent, this at the same time that outlays are down 4 percent led by a decrease in defense spending. Looking ahead, the month of September traditionally shows a moderate surplus for the month. Over the past 10 years, the average surplus for the month of September has been $23.4 billion. However it has been an average deficit of $4.3 billion over the past 5 years. The September 2012 surplus came in at $75.2 billion. This release is produced by the Treasury Department and the scheduled release time may be affected by federal government budget issues.
No consensus numbers are available for this month’s report
The producer price index accelerated in August on food and energy. The August producer price index rose 0.3 percent after no change in July. The core rate, which excludes both food and energy, was flat after a 0.1 percent rise in July. Food prices jumped 0.6 percent after being flat in July. Energy surged 0.8 percent, following a 0.2 percent dip the prior month. Gasoline prices spiked 2.6 percent after decreasing 0.8 percent in July. Weakness in the core included a 0.5 percent decline in prices for passenger cars and a 0.3 percent decrease for light trucks.
PPI Consensus Forecast for September 13: +0.2 percent
Range: -0.2 to +0.4 percent
PPI ex food & energy Consensus Forecast for September 13: +0.1 percent
Range: 0.0 to +0.2 percent
Retail sales in August increased 0.2 percent in August after a 0.4 percent gain the month before. This was the weakest gain in four months. However, autos jumped 0.9 after a 0.5 percent dip in July. Retail sales excluding autos edged up 0.1 percent, following a 0.6 percent rise the month before. Gasoline sales were flat, following a 0.7 percent spike in July. Excluding the auto and gasoline components, sales nudged up 0.1 percent, following a 0.6 percent boost in July. Within the core, the numbers were mixed. More recently, unit new motor vehicle sales dropped a sharp 5.1 percent in September.
Retail sales Consensus Forecast for September 13: 0.0 percent
Range: -0.3 to +0.5 percent
Retail sales excluding motor vehicles Consensus Forecast for September 13: +0.4 percent
Range: +0.1 to +0.7 percent
Less motor vehicles & gasoline Consensus Forecast for September 13: +0.4 percent
Range: +0.1 to +0.5 percent
The Reuters/University of Michigan's consumer sentiment index fell back below 80 to a final September reading of 77.5. This was slightly above the mid-month reading of 76.8 but with both sizably below the final August reading of 82.1. The expectations component, at a final September reading of 67.8, was a bit higher than the mid-month reading of 67.2 and suggests that the recent rush of media focus on Washington has not rattled the consumer. But both the final and the mid-month readings were down compared to August's final of 73.7 in a decline that likely points to lack of confidence in income prospects. The current conditions component ended September at 92.6 which was up slightly from mid-month's 91.8. Both readings, however, were down from August's final reading of 95.2.
Consumer sentiment index Consensus Forecast for preliminary September 13: 75.0
Range: 68.0 to 83.0
Business inventories rose 0.4 percent in July for the highest increase since January but the build slightly trails a 0.6 percent rise in business sales in a favorable mix that pulled down the stock-to-sales ratio to a leaner 1.28 versus 1.29 in June. The latest report includes the retail component where the inventory build, at 0.8 percent, is ahead of the sales gain, at 0.4 percent, but not enough ahead to change the stock-to-sales ratio which is unchanged at 1.40. Details showed a strong inventory build for autos where sales have been very strong. General merchandise also shows a strong build where sales however have been mixed. The two other components of the business inventories report—factory and wholesale—showed slight builds in July, but builds that are in line to slightly behind gains in sales. This release is produced by the Commerce Department and the scheduled release time may be affected by federal government budget issues.
Business inventories Consensus Forecast for August 13: +0.2 percent
Range: +0.1 to +0.4 percent
Construction spending was stronger than expected in July. Construction spending jumped 0.6 percent after no change for June. The July boost was led by a 1.3 percent gain in private nonresidential outlays, following a 0.9 percent decline in June. Private residential spending continued an uptrend, rising 0.6 percent in July after an advance of 0.4 percent the month before. Public outlays dipped 0.3 percent after a 0.3 percent increase in June. On a year-ago basis, construction was up 5.2 percent in July, compared to 4.7 percent the prior month.
Construction spending Consensus Forecast for August 13: +0.4 percent
Range: -0.5 to +1.2 percent
Factory orders, which had been on a 3-month winning streak, fell back 2.4 percent in July. The good news is that the decline was centered in transportation equipment, specifically aircraft. Excluding transportation, new orders rose 1.2 percent. Durable orders came in at minus 7.4 percent. The surprise in the report was a big bounce back in non-durable orders which, boosted by price effects for petroleum and coal, jumped 2.4 percent versus the prior month's 0.5 percent decline. More recently, new factory orders for durables in August edged up 0.1 percent.
Factory orders Consensus Forecast for August 13: +0.3 percent
Range: -0.4 to +2.0 percent
Nonfarm payroll employment in August gained 169,000, following a revised increase of 104,000 for July (originally up 162,000) and after a revised advance of 172,000 for June (previous estimate was 188,000). The market median forecast was for a 175,000 gain for August. The net revisions for June and July were down 74,000. Private payrolls rose 152,000, following a gain of 127,000 in July (originally 161,000). Wage growth improved. Average hourly earnings rose 0.2 percent in August after no change the month before. The average workweek was up slightly to 34.5 hours from 34.4 hours in July. Analysts forecast 34.5 hours. The unemployment rate dipped to 7.3 percent from 7.4 percent in July. However, the unemployment rate fell for the wrong reason. Turning to detail for the household survey, household employment in August fell 115,000 after jumping 227,000 in July. The labor force dropped 312,000, following a 37,000 dip in July. The number of unemployed declined 198,000 after a drop of 263,000 in July. Essentially, declining labor force participation is at least partly behind the easing in the unemployment rate. The soft labor market has led to a greater number of discouraged workers.
Nonfarm payrolls Consensus Forecast for September 13: 185,000
Range: 155,000 to 240,000
Private payrolls Consensus Forecast for September 13: 184,000
Range: 154,000 to 245,000
Unemployment rate Consensus Forecast for September 13: 7.3 percent
Range: 7.1 to 7.4 percent
Average workweek Consensus Forecast for September 13: 34.5 hours
Range: 34.4 to 34.6 hours
Average hourly earnings Consensus Forecast for September 13: +0.2 percent
Range: +0.1 to +0.3 percent
R. Mark Rogers is the author of The Complete Idiot’s Guide to Economic Indicators, Penguin Books.
Econoday Senior Writer Mark Pender contributed to this article.
|
