|
Fed taper actually was not the center of attention this week. This time it was fiscal policy—or rather the lack of fiscal policy—that garnered market attention. Looming first, Congress has not passed a budget for the 2014 fiscal year, which starts October 1. The House and Senate continue to wrangle over using a budget bill and debt ceiling bill to overturn recent health care legislation (generally referred to as ObamaCare). The Secretary of the Treasury estimates that the debt ceiling will be reached October 17, while the Congressional Budget Office puts the drop-dead date after October 22nd. Without a budget and without an increase in the debt ceiling, there would be a partial shutdown of the federal government and stoppage in the government’s ability to pay for bills incurred with borrowed money (Treasuries).
 Most major indexes were down for the week. Even though Fed taper was not the center of attention this past week, FedSpeak on this issue was still a close second. Equities dipped Monday on comments by various Fed officials. Three Fed District bank presidents spoke with New York’s Dudley calling for continued quantitative easing with Atlanta’s Lockhart taking a similar view but Dallas’ Fisher stating that the recent FOMC decision has hurt Fed credibility. Essentially for equities, uncertainty was up regarding Fed policy and with a looming deadline for the federal budget. Most major indexes were down for the week. Even though Fed taper was not the center of attention this past week, FedSpeak on this issue was still a close second. Equities dipped Monday on comments by various Fed officials. Three Fed District bank presidents spoke with New York’s Dudley calling for continued quantitative easing with Atlanta’s Lockhart taking a similar view but Dallas’ Fisher stating that the recent FOMC decision has hurt Fed credibility. Essentially for equities, uncertainty was up regarding Fed policy and with a looming deadline for the federal budget.
 Tuesday and Wednesday, stocks continued to decline on worries about the impasse on the federal budget. The downtrend in equities was temporarily interrupted with gains on Thursday after an unexpected decline in initial jobless claims. Stocks resumed their decline on Friday as no progress was seen in resolving federal budget issues. Tuesday and Wednesday, stocks continued to decline on worries about the impasse on the federal budget. The downtrend in equities was temporarily interrupted with gains on Thursday after an unexpected decline in initial jobless claims. Stocks resumed their decline on Friday as no progress was seen in resolving federal budget issues.
Equities were down this past week. The Dow was down 1.2 percent; the S&P 500, down 1.1 percent; and the Wilshire 5000, down 0.8 percent. However, the Nasdaq, rose 0.2 percent and the Russell 2000 edged up 0.1 percent.
For the year-to-date, major indexes are up as follows: the Dow, up 16.4 percent; the S&P 500, up 18.6 percent; the Nasdaq, up 25.2 percent; the Russell 2000, up 26.5 percent; and the Wilshire 5000, up 20.5 percent.
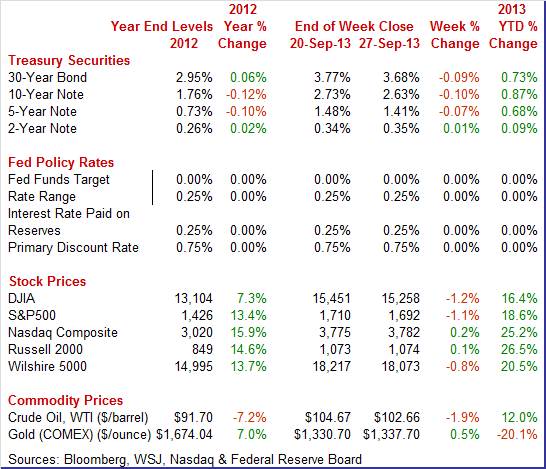
Weekly percent change column reflects percent changes for all components except interest rates. Interest rate changes are reflected in simple differences.
 Treasury yields (except on the short end) fell this past week on increased belief that the Fed will be very gradual with tapering of its quantitative easing programs and may not begin to taper until December or January although tapering as soon as October is still a possibility. Also, rates declined on flight to safety over fiscal issues—notably the need for a federal budget and the need to raise the federal government’s debt ceiling. Rates declined four out of five days this past week with the exception of a modest rise on Thursday on news of a dip in initial jobless claims. Treasury yields (except on the short end) fell this past week on increased belief that the Fed will be very gradual with tapering of its quantitative easing programs and may not begin to taper until December or January although tapering as soon as October is still a possibility. Also, rates declined on flight to safety over fiscal issues—notably the need for a federal budget and the need to raise the federal government’s debt ceiling. Rates declined four out of five days this past week with the exception of a modest rise on Thursday on news of a dip in initial jobless claims.
For this past week Treasury rates were down as follows: the 5-year note, down 7 basis points; the 7-year note, down 8s basis points; the 10-year note, down 10 basis points; and the 30-year bond, down 9 basis points. The 3-month T-bill and the the 2-year note edged up 1 basis point.
 The spot price of West Texas Intermediate declined moderately for the past week for various reasons. Overall, fiscal issues weighed on prices somewhat. Other factors also came into play, starting with Monday as traders saw reduced tension regarding potential military intervention in Syria. On Tuesday, the possibility of a thaw in U.S.-Iranian relations helped prices to ease. At mid-week, an unexpected rise in oil stockpiles led to a notable decline in the price of WTI. Again on Thursday, it was the initial jobless claims report which led to a change in direction as crude rose modestly for the day. At week’s close, the focus was on the federal budget, leading to slippage in the price for crude. The spot price of West Texas Intermediate declined moderately for the past week for various reasons. Overall, fiscal issues weighed on prices somewhat. Other factors also came into play, starting with Monday as traders saw reduced tension regarding potential military intervention in Syria. On Tuesday, the possibility of a thaw in U.S.-Iranian relations helped prices to ease. At mid-week, an unexpected rise in oil stockpiles led to a notable decline in the price of WTI. Again on Thursday, it was the initial jobless claims report which led to a change in direction as crude rose modestly for the day. At week’s close, the focus was on the federal budget, leading to slippage in the price for crude.
Net for the week, the spot price for West Texas Intermediate declined $2.01 per barrel to settle at $102.66.
Economic news was mixed for the consumer, housing, and consumer sectors this past week.
 The third estimate for real GDP growth for the second quarter was left unchanged at an annualized rate of 2.5 percent compared to the second estimate and compared to a first quarter rise of 1.1 percent. The third estimate for real GDP growth for the second quarter was left unchanged at an annualized rate of 2.5 percent compared to the second estimate and compared to a first quarter rise of 1.1 percent.
The biggest positive note was that demand numbers were bumped up slightly—though remained sluggish. Final sales of domestic product were revised up to 2.1 percent from the second estimate of 1.9 percent. This series increased 0.2 percent in the first quarter. Final sales to domestic producers (which exclude net exports) also were nudged up to 2.1 percent versus the second estimate of 1.9 percent. This followed a 0.5 percent gain in the first quarter.
The biggest revisions to components were to inventory investment, nonresidential fixed investment and residential investment. Inventory investment was revised down by $6.0 billion. Nonresidential fixed investment was revised up to 4.7 percent from 4.4 percent while residential investment was revised up to 14.2 percent from 12.9 percent for the second estimate.
Headline inflation for the GDP price index was revised down to 0.6 percent compared to the second estimate of a 0.8 percent annualized inflation rate. When excluding food and energy, inflation for the second quarter was nudged down to 0.9 percent from the second estimate of 1.1 percent annualized.
The latest revisions to GDP were very minor and showed moderate growth for the second quarter. The big issue is how is the third quarter doing' Many estimates show deceleration for the current quarter—giving the Fed reason to maintain quantitative easing.
 The consumer sector in August added a little more momentum to third quarter GDP. Personal income gained 0.4 percent after rising 0.2 percent in July. The August figure matched market expectations. The wages & salaries component rebounded 0.4 percent in August, following a 0.3 percent decline the month before. The consumer sector in August added a little more momentum to third quarter GDP. Personal income gained 0.4 percent after rising 0.2 percent in July. The August figure matched market expectations. The wages & salaries component rebounded 0.4 percent in August, following a 0.3 percent decline the month before.
Proprietors’ income and rental income were particularly strong in August, up 1.0 percent and 1.3 percent, respectively. On the weak side were interest income, down 0.3 percent, and dividend income, down 0.1 percent. Dividend income does not reflect changes in asset prices.
Consumer spending was mixed by components. Overall spending rose 0.3 percent after a 0.2 percent increase in July. Analysts projected a 0.3 percent gain. The latest increase was led by durables which advanced 0.5 percent after no change in July. Nondurables were flat after a 0.9 percent jump the month before. Services rebounded 0.4 percent, following a 0.1 percent dip in July.
 Headline inflation remained soft with a 0.1 percent rise for the PCE price index, equaling the pace in July and meeting expectations. The PCE core inflation rate nudged up to 0.2 percent in August versus a 0.1 percent rise the month before. Headline inflation remained soft with a 0.1 percent rise for the PCE price index, equaling the pace in July and meeting expectations. The PCE core inflation rate nudged up to 0.2 percent in August versus a 0.1 percent rise the month before.
Inflation numbers remain well below the Fed’s goal of 2 percent. Year-on-year, headline prices were up 1.2 percent in August, compared to 1.3 percent in July. The core year ago pace edged up to 1.2 percent from 1.1 percent in July.
The latest personal income report suggests some improvement in the consumer sector—in income, wages, and spending. But the improvement is still modest and with consumer confidence wavering.
 Consumer spirits have been sagging a bit in recent readings. The September reading on the Conference Board’s consumer confidence index dipped 2.1 points to 79.7. However, there were some positives. The present situation component was up 2.3 points to 73.2 which, next to July's 73.6, is the best reading of the recovery. Those saying jobs are currently hard to get, which is a closely followed reading, was down 6 tenths to a new recovery low of 32.7 percent. Additionally, there was a 2 tenths gain to 11.5 percent for those that describe jobs in the current market as plentiful. Consumer spirits have been sagging a bit in recent readings. The September reading on the Conference Board’s consumer confidence index dipped 2.1 points to 79.7. However, there were some positives. The present situation component was up 2.3 points to 73.2 which, next to July's 73.6, is the best reading of the recovery. Those saying jobs are currently hard to get, which is a closely followed reading, was down 6 tenths to a new recovery low of 32.7 percent. Additionally, there was a 2 tenths gain to 11.5 percent for those that describe jobs in the current market as plentiful.
The negatives in the report were in the expectations component which fell 4.9 points to 84.1 for the softest reading since May. Here, in contrast to the readings for the present situation, there is more pessimism on the jobs market with fewer seeing more jobs opening up and more seeing fewer jobs. Income expectations were also down.
Turning to the University of Michigan report, after four months in the low to mid 80s range, consumer sentiment in fell back below 80 to a final September reading of 77.5. This was slightly above the mid-month reading of 76.8 but with both sizably below the final August reading of 82.1.
The expectations component, at a final September reading of 67.8, was a bit higher than the mid-month reading of 67.2 and suggests that the recent rush of media focus on Washington has not rattled the consumer. But both the final and the mid-month readings are down compared to August's final of 73.7 in a decline that likely points to lack of confidence in income prospects. Right in line with the expectations component is a separate reading on the 12-month economic outlook which finishes September at 86 versus 85 at mid-month and a final August reading of 95.
The current conditions component, which was also down versus August, hints at weakness for the general slate of monthly economic indicators for September. This component ends September at 92.6 which is up slightly from mid-month's 91.8. Both readings, however, are down from August's final reading of 95.2.
The latest personal income & outlays report points to some strength in the consumer sector but in data that are for August. September readings on consumer confidence point to ongoing wavering in the consumer sector.
 Home sales have been volatile in recent months due to uncertainty over mortgage rats. New home sales rebounded 7.9 percent in August after plunging 14.1 percent the month before. August’s annualized rate of 421,000 was up 25.1 percent on a year-ago basis. Home sales have been volatile in recent months due to uncertainty over mortgage rats. New home sales rebounded 7.9 percent in August after plunging 14.1 percent the month before. August’s annualized rate of 421,000 was up 25.1 percent on a year-ago basis.
Downward revisions, though modest this time around, appeared for the third month in a row and included a 4,000 downward revision to July.
The median price was down 0.7 percent in the month to $254,600 which is the fourth monthly decline in a row. The year-on-year rate for the median price is up only 0.6 percent and is down from high single digit to low double digit gains earlier in the year. However, the price data are not repeat transactions and other (repeat transactions) measures show gains in home prices.
The number of new homes for sale rose 6,000 in the month to an adjusted 175,000 but supply relative to sales, given the August jump in sales, slipped to 5.0 months from 5.2 months in the very soft sales month of July. But supply is up relative to June's 4.3 months and to low 4 month readings earlier in the year and against 4.6 months in August last year.
 The near-term outlook for existing home sales slipped in August with pending home sales down 1.6 percent, following a 1.4 percent decline in July. The pending home sales index was at the lowest level since April and followed a rush of gains that the National Association of Realtors (NAR) tied to rising rates, that is nervous buyers rushing into the market before rates move even higher. The NAR, in a downbeat outlook, sees slower sales ahead along with tight inventory and higher prices. However, the outlook might improve as rates have eased a bit after the Fed chose not to taper in its policy decision on September 18. The near-term outlook for existing home sales slipped in August with pending home sales down 1.6 percent, following a 1.4 percent decline in July. The pending home sales index was at the lowest level since April and followed a rush of gains that the National Association of Realtors (NAR) tied to rising rates, that is nervous buyers rushing into the market before rates move even higher. The NAR, in a downbeat outlook, sees slower sales ahead along with tight inventory and higher prices. However, the outlook might improve as rates have eased a bit after the Fed chose not to taper in its policy decision on September 18.
 S&P Case-Shiller's 20-city adjusted monthly index was up 0.6 percent in July, but down from 0.9 percent gains in the prior two months and down from 1.7 and 1.9 percent gains in the two months before that. But the year-on-year adjusted rate, at plus 12.3 percent, was up 3 tenths for a new recovery high. S&P Case-Shiller's 20-city adjusted monthly index was up 0.6 percent in July, but down from 0.9 percent gains in the prior two months and down from 1.7 and 1.9 percent gains in the two months before that. But the year-on-year adjusted rate, at plus 12.3 percent, was up 3 tenths for a new recovery high.
A look at monthly change among individual cities showed only scattered negative signs with many showing strong gains led by cities in the West. Year-on-year, growth rates in the West are in the 20 percent area led by Las Vegas at 27.5 percent.
 Another measure for home prices showed strong gains in July. The FHFA house price index advanced a strong 1.0 percent after increasing 0.6 percent in June. The June HPI is the eighteenth consecutive monthly price increase in the purchase-only, seasonally adjusted index. Another measure for home prices showed strong gains in July. The FHFA house price index advanced a strong 1.0 percent after increasing 0.6 percent in June. The June HPI is the eighteenth consecutive monthly price increase in the purchase-only, seasonally adjusted index.
The gain was led by a 2.2 percent gain in the Pacific Census region. Showing the largest monthly decline was the East South Central region, down 0.7 percent. Seven of nine Census regions showed gains in the latest month while two decreased.
The year-on-year rate for July posted at 8.8 percent versus 7.8 percent in June.
The FHFA measure is based on homes with mortgages originated or bundled by federal housing agencies. Case-Shiller covers all types of repeat home sales but is limited to metropolitan areas.
Apparently, the Fed's strategy to boost asset prices (including home prices) appears to be working through lower mortgage rates.
 Durables orders have been volatile but the trend outside of aircraft and autos remains the same—anemic in recent months. August durables orders beat expectations but July was revised down notably. New factory orders for durables in August edged up 0.1 percent after dropping a huge 8.1 percent in July. The July estimate originally was down a monthly 7.3 percent and then down 7.4 percent in the total factory orders report. Durables orders have been volatile but the trend outside of aircraft and autos remains the same—anemic in recent months. August durables orders beat expectations but July was revised down notably. New factory orders for durables in August edged up 0.1 percent after dropping a huge 8.1 percent in July. The July estimate originally was down a monthly 7.3 percent and then down 7.4 percent in the total factory orders report.
The transportation component rose 0.7 percent after a monthly 21.9 percent plunge in July. The transportation rebound came from motor vehicles. Excluding transportation, durables orders slipped 0.1 percent, following a decrease of 0.5 percent in July.
 Within transportation, motor vehicles rose 2.4 percent, nondefense aircraft fell 1.2 percent, and defense aircraft dropped 11.8 percent. Outside of transportation, gains were seen in fabricated metals, machinery, and “other.” Components that declined were primary metals, computers & electronics, and electrical equipment. Within transportation, motor vehicles rose 2.4 percent, nondefense aircraft fell 1.2 percent, and defense aircraft dropped 11.8 percent. Outside of transportation, gains were seen in fabricated metals, machinery, and “other.” Components that declined were primary metals, computers & electronics, and electrical equipment.
Nondefense capital goods orders made a partial rebound in August, increasing 1.5 percent after a 3.3 percent decline in July. Shipments for this series made a 1.3 percent comeback, following a decrease of 1.4 percent the month before.
Manufacturing in August was soft outside of autos. Recent regional surveys for September have been mixed and the Markit flash PMI showed deceleration. The combination of national data for durables orders and manufacturing survey data indicate that the manufacturing sector is still sluggish.
Composite growth in the manufacturing sector slowed in September according to the PMI flash index for mid-September which was at 52.8 versus 53.1 for the final August reading and compared to 53.9 for the mid-month August reading. The new orders index was especially soft at 52.7 versus 55.7 in August and 56.5 at mid-month August. This is the lowest rate of order growth in Markit's sample since April.
 Composite activity in the Richmond Fed's manufacturing district shows no change this month versus last month with the index at zero. Details showed a slight monthly dip in shipments and hiring. New orders slowed but still show growth relative to August, though at a slower rate than August relative to July. Composite activity in the Richmond Fed's manufacturing district shows no change this month versus last month with the index at zero. Details showed a slight monthly dip in shipments and hiring. New orders slowed but still show growth relative to August, though at a slower rate than August relative to July.
Other readings include steady rates of inventory accumulation and a slight increase in prices for both raw materials and finished goods.
 Manufacturing decelerated in the Kansas City Fed District in September. The month-over-month composite index was 2 in September, down from 8 in August and 6 in July. The composite index is an average of the production, new orders, employment, supplier delivery time, and raw materials inventory indexes. The production index decreased at both durable and non-durable goods-producing plants, with the exception of machinery and computer equipment factories which posted slight gains. Most other month-over-month indexes also fell. The production index plunged from 21 to 4, and the shipments, new orders, and order backlog indexes also decreased. Manufacturing decelerated in the Kansas City Fed District in September. The month-over-month composite index was 2 in September, down from 8 in August and 6 in July. The composite index is an average of the production, new orders, employment, supplier delivery time, and raw materials inventory indexes. The production index decreased at both durable and non-durable goods-producing plants, with the exception of machinery and computer equipment factories which posted slight gains. Most other month-over-month indexes also fell. The production index plunged from 21 to 4, and the shipments, new orders, and order backlog indexes also decreased.
However, the outlook appears to be more positive. Most future factory indexes improved considerably from the previous month. The future composite index jumped from 9 to 18, its highest level since March 2012, and the future production, shipments, and new orders indexes also reached 18-month highs.
This past week, the brightest news was the personal income report, showing some improvement in income and spending. But the August numbers followed soft data for July and September consumer mood data are mixed. Housing prices continue a moderate uptrend but sales now appear iffy as mortgage rates are higher—even after some post FOMC slippage. Finally, the sluggish global economy has kept manufacturing in a slow growth phase. The recovery is still in the positive category but not where is should be according to past recoveries.
Fed taper plans will be back on the front burner for financial markets as the Fed is focusing on the labor market. That means Friday’s employment situation report will get highlighted attention. This assumes a government shutdown does not delay the report. A government shutdown would affect releases by the Commerce Department and Labor Department, starting with Tuesday’s report on construction outlays. But back to taper—Fed officials have emphasized that they still are watching the overall economy. For the consumer sector, sales of motor vehicles will be a key report. For the wavering manufacturing sector, September data are posted for Markit PMI, ISM manufacturing, factory orders, and the Dallas Fed.
The Chicago PMI in August rose 7 tenths to 53.0 to show the best rate of monthly growth in general activity since May. New orders were especially strong, up more than 3 points to 57.2 for the best rate of monthly growth also since May. But outside new orders, details in the report indicate a little bit of softness including slightly slower rates of growth for production and employment. Inventories continue to contract while backlog orders show a third straight month of contraction, though at an easing rate.
Chicago PMI Consensus Forecast for September 13: 54.4
Range: 52.0 to 64.0
The Dallas Fed general business activity index for August edged up from 4.4 to 5.0, and the company outlook index rose from 4.5 to 7.3. The production index, a key measure of state manufacturing conditions, remained positive but fell from 11.4 to 7.3. Other measures of current manufacturing activity also indicated slower growth in August. The new orders index was positive for the fourth month in a row, although it moved down from 10.8 to 5.4. The shipments index also posted a fourth consecutive positive reading but slipped 6 points to 11.4. The capacity utilization index fell from 12.2 to 4.6.
Dallas Fed general business activity index Consensus Forecast for September 13: 6.0
Range: 5.0 to 8.0
Sales of total light motor vehicles rose a very solid 1.8 percent in August to a 16.1 million annual rate for the best showing of the recovery going back to November 2007. August's gain was led by domestic light trucks but also included a solid gain for import cars. North American-made vehicles came in at a 12.6 million annual rate for a 2.1 percent gain on the month. Foreign-made vehicles rose 0.8 percent to a 3.5 million annual rate.
Motor vehicle domestic sales Consensus Forecast for September 13: 11.9 million-unit rate
Range: 11.8 to 12.4 million-unit rate
Motor vehicle total sales Consensus Forecast for September 13: 15.5 million-unit rate
Range: 15.1 to 16.2 million-unit rate
The Markit PMI manufacturing flash index slowed for mid-September which was at 52.8 versus 53.1 for the final August reading and versus 53.9 for the mid-month August reading. The new orders component was especially soft which posted at 52.7 versus 55.7 in August and 56.5 at mid-month August. This was the lowest rate of order growth in Markit's sample since April.
Markit PMI manufacturing index (final) Consensus Forecast for September 13: 52.9
Range: 52.5 to 54.0
The composite index from the ISM non-manufacturing survey rose to 55.7 in August which was even stronger than the 55.4 surge in July. Production, at 62.4 versus July's enormous jump to 65.0, was also extremely strong for a second month. The new orders index jumped 4.9 points to 63.2 and followed July’s surge of 6.4 points. The level was the first 60 reading in nearly 2-1/2 years.
ISM manufacturing composite index Consensus Forecast for September 13: 55.0
Range: 52.4 to 56.5
Construction spending was stronger than expected in July. Construction spending jumped 0.6 percent after no change for June. The July boost was led by a 1.3 percent gain in private nonresidential outlays, following a 0.9 percent decline in June. Private residential spending continued an uptrend, rising 0.6 percent in July after an advance of 0.4 percent the month before. Public outlays dipped 0.3 percent after a 0.3 percent increase in June. On a year-ago basis, construction was up 5.2 percent in July, compared to 4.7 percent the prior month.
Construction spending Consensus Forecast for August 13: +0.4 percent
Range: -0.5 to +1.2 percent
ADP private payroll employment for August grew 176,000, compared to July's downwardly revised rise of 198,000. The comparable BLS number for August posted a gain of 152,000.
ADP private payrolls Consensus Forecast for September 13: 180,000
Range: 160,000 to 235,000
Initial jobless claims fell 5,000 in the September 21 week to a much lower-than-expected total of 305,000. The Econoday consensus was for 330,000 with the low-end forecast at 315,000. Despite two weeks of uncertainty over counting issues in California and Nevada, revisions have been very narrow with the prior week revised only 1,000 higher to 310,000. The average was down for a 4th week in row, 7,000 lower in the latest week to 308,000 which is a new recovery low and more than 20,000 below levels in late August.
Jobless Claims Consensus Forecast for 9/28/13: 313,000
Range: 300,000 to 323,000
Factory orders, which had been on a 3-month winning streak, fell back 2.4 percent in July. The good news is that the decline was centered in transportation equipment, specifically aircraft. Excluding transportation, new orders rose 1.2 percent. Durable orders came in at minus 7.4 percent. The surprise in the report was a big bounce back in non-durable orders which, boosted by price effects for petroleum and coal, jumped 2.4 percent versus the prior month's 0.5 percent decline. More recently, new factory orders for durables in August edged up 0.1 percent.
Factory orders Consensus Forecast for August 13: +0.3 percent
Range: -0.4 to +2.0 percent
The composite index from the ISM non-manufacturing survey hit a recovery high in August at 58.6, compared to a still very healthy 56.0 the month before. August’s figure was the highest reading since December 2005. The new orders index, at 60.5 versus 57.7 in July, was a standout strength in the report and points to rising activity going into the fourth quarter and the holidays. Business activity was already very strong at 62.2.
ISM non-manufacturing composite index Consensus Forecast for September 13: 57.0
Range: 55.2 to 58.8
Nonfarm payroll employment in August gained 169,000, following a revised increase of 104,000 for July (originally up 162,000) and after a revised advance of 172,000 for June (previous estimate was 188,000). The market median forecast was for a 175,000 gain for August. The net revisions for June and July were down 74,000. Private payrolls rose 152,000, following a gain of 127,000 in July (originally 161,000). Wage growth improved. Average hourly earnings rose 0.2 percent in August after no change the month before. Expectations were for a 0.2 percent gain. The average workweek was up slightly to 34.5 hours from 34.4 hours in July. Analysts forecast 34.5 hours. The unemployment rate dipped to 7.3 percent from 7.4 percent in July. However, the unemployment rate fell for the wrong reason. Turning to detail for the household survey, household employment in August fell 115,000 after jumping 227,000 in July. The labor force dropped 312,000, following a 37,000 dip in July. The number of unemployed declined 198,000 after a drop of 263,000 in July. Essentially, declining labor force participation is at least partly behind the easing in the unemployment rate. The soft labor market has led to a greater number of discouraged workers.
Nonfarm payrolls Consensus Forecast for September 13: 184,000
Range: 155,000 to 240,000
Private payrolls Consensus Forecast for September 13: 184,000
Range: 154,000 to 245,000
Unemployment rate Consensus Forecast for September 13: 7.3 percent
Range: 7.1 to 7.4 percent
Average workweek Consensus Forecast for September 13: 34.5 hours
Range: 34.4 to 34.6 hours
Average hourly earnings Consensus Forecast for September 13: +0.2 percent
Range: +0.1 to +0.3 percent
R. Mark Rogers is the author of The Complete Idiot’s Guide to Economic Indicators, Penguin Books.
Econoday Senior Writer Mark Pender contributed to this article.
|
