|
Global investors shifted focus from international affairs to the saga in Washington DC concerning the budget and debt ceiling. With the new fiscal year beginning on October 1st, parts of the U.S. government would be shut down without any funding if a budget agreement is not reached between the House of Representatives and the Senate before that date. The downward pressures from the fiscal uncertainties escalated as the week progressed and the deadline neared. Also lurking is the need to raise the debt ceiling by October 17th to prevent possible default on U.S. debt.
The fiscal issues have increasingly unsettled investors since the U.S. Federal Reserve's surprise decision to keep its economic stimulus program of bond buying unchanged for now. But fiscal uncertainties fed into the FOMC's decision to keep policy unchanged.
With one trading day left in the month and quarter, the indexes followed here were up in September. But on a quarterly basis, several emerging Asian equity indexes (Jakarta Composite, SET and PSEi) retreated.
|
|
2012 |
2013 |
% Change |
|
Index |
31-Dec |
Sep 20 |
Sep 27 |
Week |
Year |
| Asia/Pacific |
|
|
|
|
|
|
| Australia |
All Ordinaries |
4664.6 |
5270.8 |
5302.3 |
0.6% |
13.7% |
| Japan |
Nikkei 225 |
10395.2 |
14742.4 |
14760.1 |
0.1% |
42.0% |
| Hong Kong |
Hang Seng |
22656.9 |
23502.5 |
23207.0 |
-1.3% |
2.4% |
| S. Korea |
Kospi |
1997.1 |
2005.6 |
2011.8 |
0.3% |
0.7% |
| Singapore |
STI |
3167.1 |
3237.5 |
3210.2 |
-0.8% |
1.4% |
| China |
Shanghai Composite |
2269.1 |
2191.9 |
2160.0 |
-1.5% |
-4.8% |
|
|
|
|
|
|
|
| India |
Sensex 30 |
19426.7 |
20263.7 |
19727.3 |
-2.6% |
1.5% |
| Indonesia |
Jakarta Composite |
4316.7 |
4583.8 |
4423.7 |
-3.5% |
2.5% |
| Malaysia |
KLCI |
1689.0 |
1801.8 |
1776.2 |
-1.4% |
5.2% |
| Philippines |
PSEi |
5812.7 |
6424.5 |
6379.8 |
-0.7% |
9.8% |
| Taiwan |
Taiex |
7699.5 |
8209.2 |
8230.7 |
0.3% |
6.9% |
| Thailand |
SET |
1391.9 |
1486.8 |
1417.5 |
-4.7% |
1.8% |
|
|
|
|
|
|
|
| Europe |
|
|
|
|
|
|
| UK |
FTSE 100 |
5897.8 |
6596.4 |
6512.7 |
-1.3% |
10.4% |
| France |
CAC |
3641.1 |
4203.7 |
4186.8 |
-0.4% |
15.0% |
| Germany |
XETRA DAX |
7612.4 |
8675.7 |
8661.5 |
-0.2% |
13.8% |
| Italy |
FTSE MIB |
16273.4 |
17970.1 |
17646.2 |
-1.8% |
8.4% |
| Spain |
IBEX 35 |
8167.5 |
9171.8 |
9228.4 |
0.6% |
13.0% |
| Sweden |
OMX Stockholm 30 |
1104.7 |
1285.8 |
1269.5 |
-1.3% |
14.9% |
| Switzerland |
SMI |
6822.4 |
8105.4 |
8055.0 |
-0.6% |
18.1% |
|
|
|
|
|
|
|
| North America |
|
|
|
|
|
|
| United States |
Dow |
13104.1 |
15451.1 |
15258.2 |
-1.2% |
16.4% |
|
NASDAQ |
3019.5 |
3774.7 |
3781.6 |
0.2% |
25.2% |
|
S&P 500 |
1426.2 |
1709.9 |
1691.8 |
-1.1% |
18.6% |
| Canada |
S&P/TSX Comp. |
12433.5 |
12806.5 |
12844.1 |
0.3% |
3.3% |
| Mexico |
Bolsa |
43705.8 |
41226.0 |
40903.7 |
-0.8% |
-6.4% |
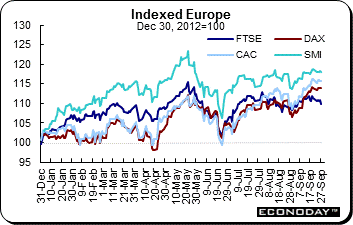 Equities struggled last week with most of the indexes retreating three of five days. Sentiment continued to be affected by a possible U.S. government shutdown on October 1st. The political situation in Italy also was in focus at the end of the trading week. The threat by the People of Freedom Party to leave parliament if former Prime Minister Silvio Berlusconi is expelled from the body led to rising yields on Italian government bonds. The FTSE lost 1.3 percent while the CAC was 0.4 percent lower and the DAX slid 0.2 percent. The SMI retreated 0.6 percent. Equities struggled last week with most of the indexes retreating three of five days. Sentiment continued to be affected by a possible U.S. government shutdown on October 1st. The political situation in Italy also was in focus at the end of the trading week. The threat by the People of Freedom Party to leave parliament if former Prime Minister Silvio Berlusconi is expelled from the body led to rising yields on Italian government bonds. The FTSE lost 1.3 percent while the CAC was 0.4 percent lower and the DAX slid 0.2 percent. The SMI retreated 0.6 percent.
Bank of England Governor Mark Carney said that he sees no case for more quantitative easing given that the UK economic recovery has gained momentum. In an interview to the Yorkshire Post, Carney said that the BoE would consider the case for more quantitative easing should the recovery falter. According to the newspaper, Carney said that in his personal view — given the recovery has strengthened and broadened — he does not see a case for additional quantitative easing and has not supported it. The Bank of England will study economic conditions in cities outside London before making any decision on a possible interest rate increase. He noted that it is incredibly important to get out of London and talk to businesses and find out what's really going on in the economy.
In Europe, the instability in the Italian political system was back in the spotlight. Supporters of Silvio Berlusconi threatened to leave parliament if the former prime minister is ousted due to a tax fraud conviction, prompting a rebuke from President Giorgio Napolitano. The President on Thursday reportedly accused the Berlusconi supporters of undermining Italy's parliamentary system and said the threat — if carried out — could pressure him into dissolving parliament.
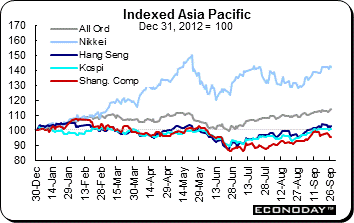 Equities were mixed last week as concerns about the U.S. budget and debt ceiling impasses weighed on investors. Despite the week’s uncertainties, with one trading day left in September, all indexes followed here are up on the month. For the week, however, only the Taiex and Kospi (both up 0.3 percent), the All Ordinaries (up 0.6 percent) and the Nikkei (up 0.1 percent) gained ground. Losses ranged from 0.7 percent (PSEi) to 4.7 percent (SET). Equities were mixed last week as concerns about the U.S. budget and debt ceiling impasses weighed on investors. Despite the week’s uncertainties, with one trading day left in September, all indexes followed here are up on the month. For the week, however, only the Taiex and Kospi (both up 0.3 percent), the All Ordinaries (up 0.6 percent) and the Nikkei (up 0.1 percent) gained ground. Losses ranged from 0.7 percent (PSEi) to 4.7 percent (SET).
Japanese equities continue to bounce around, generally in the opposite direction to the yen. When the yen rises in value against the U.S. dollar, equities — especially shares of exporters — usually decline.
However, this time investors are wary ahead of forthcoming government policy announcements on a controversial sales tax increase and a fiscal stimulus package that are expected to be introduced this week. There was speculation that Japan would consider the reduction in the corporate tax rate to mitigate the impact of a proposed sales tax increase. Prime Minster Shinzo Abe is set to approve sales tax increase from 5 to 8 percent next week to contain the debt burden.
As far as progress on ridding the economy of deflation, only little progress has been made. According to the August consumer price index report, the inflation evident was only due to food and energy and is not yet pervasive throughout economy. The jump in energy prices is related to the March 2011 earthquake and tsunami which shut down Japan’s nuclear energy facilities and has forced the country to import energy products instead. The price of these imports has been exacerbated by the declining value of the yen which makes them more expensive.
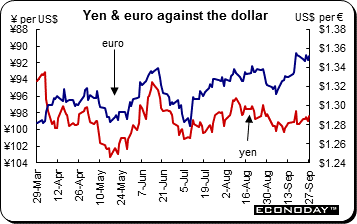 The U.S. dollar was up against the Australian dollar — but was unchanged against the euro and the Canadian dollar. It was down against the pound sterling, yen and Swiss franc on the week. The U.S. currency hit a 7-1/2-month low against the Swiss franc as wrangling over the U.S. budget and a lack of clarity over when the Federal Reserve will scale back stimulus curbed demand for the currency. The U.S. dollar was up against the Australian dollar — but was unchanged against the euro and the Canadian dollar. It was down against the pound sterling, yen and Swiss franc on the week. The U.S. currency hit a 7-1/2-month low against the Swiss franc as wrangling over the U.S. budget and a lack of clarity over when the Federal Reserve will scale back stimulus curbed demand for the currency.
The dollar also declined against the yen after Japanese Finance Minister Taro Aso said he was not thinking of lowering the effective corporate tax rate now. That surprised investors who had expected that the yen would weaken on expectations of more fiscal stimulus to prop up the economy. The pound sterling advanced against the dollar after Bank of England Governor Mark Carney said in a newspaper interview that he saw no need for more bond buying by the BoE given signs of recovery in the British economy.
Beyond the budget impasse and month- and quarter-end flows, investors are focused on upcoming FOMC meetings in October and December. With U.S. employment still not quite firmly on track, analysts are split on when the FOMC will rein in stimulus with some suggesting early 2014.
|
|
2012 |
2013 |
% Change |
|
|
Dec 31 |
Sep 20 |
Sep 27 |
Week |
2013 |
| U.S. $ per currency |
|
|
|
|
|
|
| Australia |
A$ |
1.040 |
0.941 |
0.932 |
-1.0% |
-10.4% |
| New Zealand |
NZ$ |
0.829 |
0.838 |
0.828 |
-1.2% |
-0.1% |
| Canada |
C$ |
1.007 |
0.971 |
0.971 |
0.0% |
-3.6% |
| Eurozone |
euro (€) |
1.319 |
1.353 |
1.352 |
0.0% |
2.5% |
| UK |
pound sterling (£) |
1.623 |
1.602 |
1.614 |
0.7% |
-0.6% |
|
|
|
|
|
|
|
| Currency per U.S. $ |
|
|
|
|
|
|
| China |
yuan |
6.231 |
6.121 |
6.119 |
0.0% |
1.8% |
| Hong Kong |
HK$* |
7.750 |
7.753 |
7.755 |
0.0% |
-0.1% |
| India |
rupee |
54.995 |
62.278 |
62.498 |
-0.4% |
-12.0% |
| Japan |
yen |
86.750 |
99.340 |
98.250 |
1.1% |
-11.7% |
| Malaysia |
ringgit |
3.058 |
3.165 |
3.228 |
-1.9% |
-5.3% |
| Singapore |
Singapore $ |
1.222 |
1.252 |
1.256 |
-0.3% |
-2.7% |
| South Korea |
won |
1064.400 |
1075.340 |
1073.650 |
0.2% |
-0.9% |
| Taiwan |
Taiwan $ |
29.033 |
29.539 |
29.567 |
-0.1% |
-1.8% |
| Thailand |
baht |
30.580 |
31.120 |
31.300 |
-0.6% |
-2.3% |
| Switzerland |
Swiss franc |
0.916 |
0.911 |
0.906 |
0.5% |
1.1% |
| *Pegged to U.S. dollar |
|
|
|
|
|
|
| Source: Bloomberg |
|
|
|
|
|
|
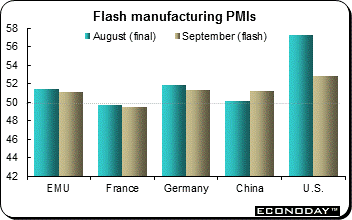 September flash PMI surveys indicated that economic activity in the private sector hit a 27-month high. At 52.1, the provisional composite output index advanced for the sixth consecutive month to stand 0.6 points above its final August reading and register its strongest level since June 2011. However, manufacturing news was less promising with the sector's PMI weighing in at a 51.1, three ticks short of its final August value. The sector's output sub-index shed 1.3 points in falling to 52.1, its lowest level in three months. By contrast, the services PMI rose 1.4 points to 52.1, exceeding expectations and reaching a 27-month peak. September's improvement in overall conditions was led by fresh gains in new orders in both manufacturing and services, but only in the latter's case was there acceleration. Business confidence in the year ahead in services posted a one and a half year high. In turn there was finally stabilization in backlogs which had been falling every month since June 2011. Employment still contracted but job losses were the smallest since the downturn began back in January 2012. Regionally, the core countries both saw their economies expand with the composite output index up 0.3 points to 53.8 in Germany and up 1.4 points to 50.2 in France. Elsewhere business activity rose on average for the second consecutive month and at its steepest rate since April 2011. September flash PMI surveys indicated that economic activity in the private sector hit a 27-month high. At 52.1, the provisional composite output index advanced for the sixth consecutive month to stand 0.6 points above its final August reading and register its strongest level since June 2011. However, manufacturing news was less promising with the sector's PMI weighing in at a 51.1, three ticks short of its final August value. The sector's output sub-index shed 1.3 points in falling to 52.1, its lowest level in three months. By contrast, the services PMI rose 1.4 points to 52.1, exceeding expectations and reaching a 27-month peak. September's improvement in overall conditions was led by fresh gains in new orders in both manufacturing and services, but only in the latter's case was there acceleration. Business confidence in the year ahead in services posted a one and a half year high. In turn there was finally stabilization in backlogs which had been falling every month since June 2011. Employment still contracted but job losses were the smallest since the downturn began back in January 2012. Regionally, the core countries both saw their economies expand with the composite output index up 0.3 points to 53.8 in Germany and up 1.4 points to 50.2 in France. Elsewhere business activity rose on average for the second consecutive month and at its steepest rate since April 2011.
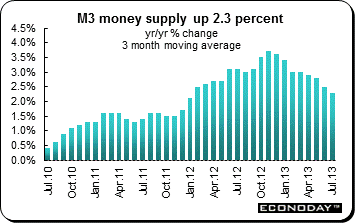 August M3 money supply was up 2.3 percent from a year ago. However, the ECB's closely monitored 3-month moving average measure slowed by 0.2 percentage points to 2.3 percent. There was more disappointing news on private sector bank lending which declined 2.0 percent on the year after retreating 1.9 percent in July. Loans to households were up a minimal 0.1 percent on the year, matching the previous period's rate, and borrowing for house purchase was similarly steady at a 0.7 percent annual pace. Borrowing by non-financial corporations weakened a tick to minus 3.8 percent and lending to non-monetary financial intermediaries (excluding insurance companies and pension funds) was down 6.1 percent from August 2012 after a 5.7 percent contraction last time. August M3 money supply was up 2.3 percent from a year ago. However, the ECB's closely monitored 3-month moving average measure slowed by 0.2 percentage points to 2.3 percent. There was more disappointing news on private sector bank lending which declined 2.0 percent on the year after retreating 1.9 percent in July. Loans to households were up a minimal 0.1 percent on the year, matching the previous period's rate, and borrowing for house purchase was similarly steady at a 0.7 percent annual pace. Borrowing by non-financial corporations weakened a tick to minus 3.8 percent and lending to non-monetary financial intermediaries (excluding insurance companies and pension funds) was down 6.1 percent from August 2012 after a 5.7 percent contraction last time.
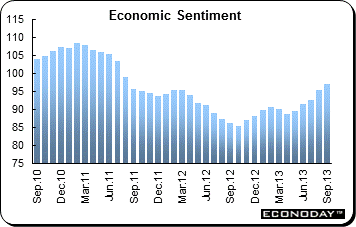 September EU Commission's measure of economic sentiment (ESI) was up 1.6 points to 96.9. September's advance was the fifth in a row and left the headline index at its highest level since August 2011. All of the major sectors saw some improvement, notably in construction where morale was up more than 4 points at minus 28.8 — its best reading since January. Confidence in the key consumer sector advanced a more modest 0.7 points to minus 14.9 and increased 1.1 points to minus 6.7 in industry, both comfortably the highs for the year so far. Services gained 1.9 points to minus 3.3 and retail advanced 3.6 points to minus 7.0. Regionally, all the larger national ESIs made fresh headway in September led by Spain and Italy (both up 2.5 points) ahead of France (1.6 points) and Germany (0.3 points). Even so, among this group only the German index (104.1) was above the common 100 long run average. Elsewhere, morale declined nearly a point to 91.8 in the Netherlands but was up in both Cyprus (2.1 points to 82.6) and Portugal (1.7 points to 90.0). September EU Commission's measure of economic sentiment (ESI) was up 1.6 points to 96.9. September's advance was the fifth in a row and left the headline index at its highest level since August 2011. All of the major sectors saw some improvement, notably in construction where morale was up more than 4 points at minus 28.8 — its best reading since January. Confidence in the key consumer sector advanced a more modest 0.7 points to minus 14.9 and increased 1.1 points to minus 6.7 in industry, both comfortably the highs for the year so far. Services gained 1.9 points to minus 3.3 and retail advanced 3.6 points to minus 7.0. Regionally, all the larger national ESIs made fresh headway in September led by Spain and Italy (both up 2.5 points) ahead of France (1.6 points) and Germany (0.3 points). Even so, among this group only the German index (104.1) was above the common 100 long run average. Elsewhere, morale declined nearly a point to 91.8 in the Netherlands but was up in both Cyprus (2.1 points to 82.6) and Portugal (1.7 points to 90.0).
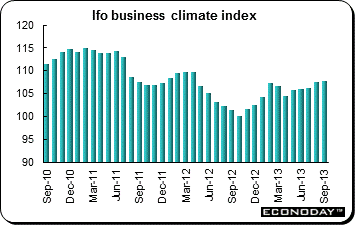 September Ifo survey points to a further small improvement in business conditions this month with the climate index edging up a point to 107.7. Although the outcome was the best since April 2012, it was still a little softer than generally anticipated and reflected a minor increase in expectations that was only just more than enough to offset a decline in current conditions. Overall sentiment has now risen for five months in a row. The expectations sub-index posted its second successive monthly gain, climbing 0.9 points to 104.3, its strongest reading since February. However, in slipping 0.6 points to 111.4, current conditions saw their first deterioration since June. However, this was still their second highest level so far this year. Among the major sectors, the manufacturing climate index gained 0.7 points to 11.9, retail was up a sizeable 3.8 points to 6.4 and services increased 1.1 points to 19.1. By contrast, morale in wholesale declined 2.5 points to 5.5 and was 2.1 points weaker in construction at minus 6.3. September Ifo survey points to a further small improvement in business conditions this month with the climate index edging up a point to 107.7. Although the outcome was the best since April 2012, it was still a little softer than generally anticipated and reflected a minor increase in expectations that was only just more than enough to offset a decline in current conditions. Overall sentiment has now risen for five months in a row. The expectations sub-index posted its second successive monthly gain, climbing 0.9 points to 104.3, its strongest reading since February. However, in slipping 0.6 points to 111.4, current conditions saw their first deterioration since June. However, this was still their second highest level so far this year. Among the major sectors, the manufacturing climate index gained 0.7 points to 11.9, retail was up a sizeable 3.8 points to 6.4 and services increased 1.1 points to 19.1. By contrast, morale in wholesale declined 2.5 points to 5.5 and was 2.1 points weaker in construction at minus 6.3.
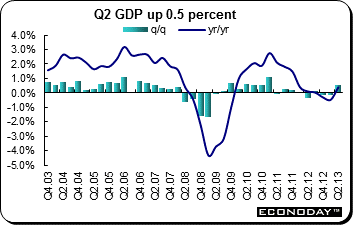 Second quarter gross domestic product was up an unrevised 0.5 percent on the quarter and was up 0.4 percent on the year. Household consumption expanded a quarterly 0.4 percent and government final spending was up 0.7 percent. However, gross fixed capital formation was down 0.4 percent, reflecting a 1.7 percent decline in the residential sector. Final domestic demand added 0.3 percentage points to the quarterly change in total output and inventory accumulation a further 0.2 percentage points. However, with exports up 2.0 percent and imports 1.7 percent, net foreign trade has a zero impact. Second quarter gross domestic product was up an unrevised 0.5 percent on the quarter and was up 0.4 percent on the year. Household consumption expanded a quarterly 0.4 percent and government final spending was up 0.7 percent. However, gross fixed capital formation was down 0.4 percent, reflecting a 1.7 percent decline in the residential sector. Final domestic demand added 0.3 percentage points to the quarterly change in total output and inventory accumulation a further 0.2 percentage points. However, with exports up 2.0 percent and imports 1.7 percent, net foreign trade has a zero impact.
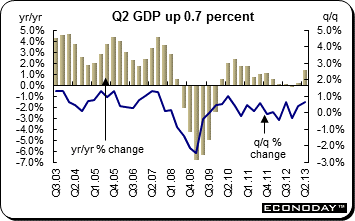 The final estimate of second quarter gross domestic product was up an unchanged 0.7 percent on the quarter and up a downwardly revised 1.3 percent when compared with the same quarter a year ago. Household spending was up 0.3 percent and provided the main domestic boost to the quarterly change in total output. However, gross fixed capital formation was up 0.8 percent and general government final expenditure 0.3 percent. Total domestic expenditure advanced 0.6 percent but the impact of net exports, previously put at 0.3 percentage points, was revised away to zero as export growth was lowered to 3.0 percent and the increase in imports increased to 2.9 percent. Among the principal output sectors, industrial production was up 0.8 percent on the quarter, within which manufacturing climbed 0.9 percent and services expanded 0.6 percent, thanks largely to a 1.8 percent advance in distribution, hotels & catering. Construction grew 1.9 percent and agriculture 2.0 percent. The final estimate of second quarter gross domestic product was up an unchanged 0.7 percent on the quarter and up a downwardly revised 1.3 percent when compared with the same quarter a year ago. Household spending was up 0.3 percent and provided the main domestic boost to the quarterly change in total output. However, gross fixed capital formation was up 0.8 percent and general government final expenditure 0.3 percent. Total domestic expenditure advanced 0.6 percent but the impact of net exports, previously put at 0.3 percentage points, was revised away to zero as export growth was lowered to 3.0 percent and the increase in imports increased to 2.9 percent. Among the principal output sectors, industrial production was up 0.8 percent on the quarter, within which manufacturing climbed 0.9 percent and services expanded 0.6 percent, thanks largely to a 1.8 percent advance in distribution, hotels & catering. Construction grew 1.9 percent and agriculture 2.0 percent.
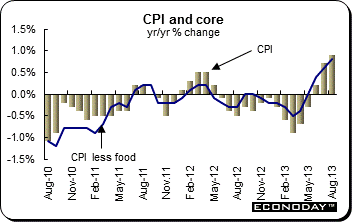 August consumer prices were up 0.3 percent and 0.9 percent on the year. Excluding fresh food, the CPI was up 0.3 percent on the month and 0.8 percent from a year ago. Excluding both fresh food and energy, the CPI was up 0.2 percent and was down 0.1 percent from August 2012. Energy prices were up 9.2 percent on the year and explain in part the annual increases for the CPI and core excluding only fresh food. The major categories were split between increases in prices and continued declines. Among the categories that increased from a year ago were food (up 0.5 percent), fuel, light &water charges (up 6.0 percent), clothes & footwear (up 0.8 percent) and transportation & communication (up 3.1 percent). However, prices declined for furniture & household utensils (down 1.7 percent), medical care (down 0.5 percent) and culture & recreation (down 0.8 percent). August consumer prices were up 0.3 percent and 0.9 percent on the year. Excluding fresh food, the CPI was up 0.3 percent on the month and 0.8 percent from a year ago. Excluding both fresh food and energy, the CPI was up 0.2 percent and was down 0.1 percent from August 2012. Energy prices were up 9.2 percent on the year and explain in part the annual increases for the CPI and core excluding only fresh food. The major categories were split between increases in prices and continued declines. Among the categories that increased from a year ago were food (up 0.5 percent), fuel, light &water charges (up 6.0 percent), clothes & footwear (up 0.8 percent) and transportation & communication (up 3.1 percent). However, prices declined for furniture & household utensils (down 1.7 percent), medical care (down 0.5 percent) and culture & recreation (down 0.8 percent).
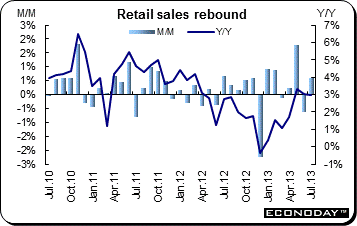 July retail sales were up 0.6 percent on the month, fully reversing June's decline for an annual growth rate of 3.0 percent. The pick-up in nominal purchases was almost matched by volumes which were up 0.5 percent on the month. This was their fourth increase in the last five months but not enough to make back all of July’s decline. Within the overall monthly advance in nominal sales, eight of the 11 reporting sub-sectors posted new gains. Gasoline was the dominant category, registering a 3.2 percent increase, but solid gains were also seen in general merchandise (1.1 percent), clothing & accessories (1.9 percent) and furniture & home furnishings (1.6 percent). Other significant gains were recorded in sporting goods & hobbies (1.7 percent), health & personal care (0.6 percent) and building material & garden equipment & supplies (0.4 percent). The main areas of weakness were motor vehicle & parts (down 0.6 percent), where a 1.2 percent drop in new vehicles impacted heavily, electronics & appliances (down 0.5 percent) and food & drink (down 0.3 percent). Excluding autos & parts & gasoline purchases retail sales were up 0.6 percent. July retail sales were up 0.6 percent on the month, fully reversing June's decline for an annual growth rate of 3.0 percent. The pick-up in nominal purchases was almost matched by volumes which were up 0.5 percent on the month. This was their fourth increase in the last five months but not enough to make back all of July’s decline. Within the overall monthly advance in nominal sales, eight of the 11 reporting sub-sectors posted new gains. Gasoline was the dominant category, registering a 3.2 percent increase, but solid gains were also seen in general merchandise (1.1 percent), clothing & accessories (1.9 percent) and furniture & home furnishings (1.6 percent). Other significant gains were recorded in sporting goods & hobbies (1.7 percent), health & personal care (0.6 percent) and building material & garden equipment & supplies (0.4 percent). The main areas of weakness were motor vehicle & parts (down 0.6 percent), where a 1.2 percent drop in new vehicles impacted heavily, electronics & appliances (down 0.5 percent) and food & drink (down 0.3 percent). Excluding autos & parts & gasoline purchases retail sales were up 0.6 percent.
Investors were cautious last week as they monitored the ongoing battles in Washington DC over the budget for the new fiscal year beginning October 1st and raising of the debt ceiling which needs to be done by October 17. Little attention was paid to economic data.
The Reserve Bank of Australia, Bank of Japan and the European Central Bank meet this week. Policy changes are not expected. A slew of new economic data will be released including Japan’s important Tankan report as well as manufacturing, services and composite purchasing managers’ indexes for Eurozone members, the UK, U.S., Japan and India. However, focus will continue to be on the U.S. Congress and decisions about the budget and then the debt ceiling. The repercussions of these decisions will reverberate globally.
| The following indicators will be released this week... |
| Europe |
|
|
| September 30 |
Eurozone |
Harmonized Index of Consumer Prices (September, flash) |
|
France |
Producer Price Index (August) |
| October 1 |
Eurozone |
Manufacturing PMI (September) |
|
|
Unemployment (August) |
|
Germany |
Manufacturing PMI (September) |
|
|
Unemployment (September) |
|
France |
Manufacturing PMI (September) |
|
UK |
Manufacturing PMI (September) |
| October 2 |
Eurozone |
Producer Price Index (August) |
| October 3 |
Eurozone |
Composite PMI (September) |
|
|
Retail Sales (August) |
|
Germany |
Composite PMI (September) |
|
France |
Composite PMI (September) |
|
UK |
Services PMI (September) |
| October 4 |
Germany |
Producer Price Index (August) |
| |
|
|
| Asia/Pacific |
|
|
| September 30 |
Japan |
Manufacturing PMI (September) |
|
|
Industrial Production (July) |
|
|
Retail Sales (July) |
| October 1 |
China |
Manufacturing PMI (September) |
|
Japan |
Household Spending (July) |
|
|
Unemployment (July) |
|
|
Tankan Survey (Q3.2013) |
|
Australia |
Retail Sales (August) |
| October 2 |
Australia |
Merchandise Trade Balance (August) |
| |
|
|
| Americas |
|
|
| September 30 |
Canada |
Monthly Gross Domestic Product (July) |
|
|
Industrial Product Price Index (August) |
Anne D Picker is the author of International Economic Indicators and Central Banks.
|
