|
The big news this past week was the FOMC’s decision to not taper its asset purchases. Markets had built in a modest $10 billion cut in monthly purchases which continue to stand at $85 billion.
 Equities ended the week up, largely on the Fed’s decision not to taper. Stocks started the week mostly up after former Treasury Secretary Larry Summers announced that he was taking himself out of consideration for the Fed chair after Bernanke’s term ends January 31, 2014. Summers is considered hawkish on Fed policy. Equities ended the week up, largely on the Fed’s decision not to taper. Stocks started the week mostly up after former Treasury Secretary Larry Summers announced that he was taking himself out of consideration for the Fed chair after Bernanke’s term ends January 31, 2014. Summers is considered hawkish on Fed policy.
Stocks gained Tuesday, primarily on technology and energy. Microsoft was up after it announced a US$40 billion share repurchase plan. The big move up was on Wednesday when the Fed chose to not taper its bond purchase programs. Markets expected a $10 billion monthly taper and the decision resulted in a dip in bond rates and boost in equities. The S&P 500 hit a record high.
 Thursday, equities slipped after Wednesday’s euphoria on the Fed not tapering. The biggest decliners included JP Morgan—after being severely fined by U.S. and U.K. regulators on the “London Whale” trading debacle—and homebuilders. However, homebuilders were some of the biggest gainers on Wednesday with the Fed decision which lowered long rates. Thursday, equities slipped after Wednesday’s euphoria on the Fed not tapering. The biggest decliners included JP Morgan—after being severely fined by U.S. and U.K. regulators on the “London Whale” trading debacle—and homebuilders. However, homebuilders were some of the biggest gainers on Wednesday with the Fed decision which lowered long rates.
At week’s close, traders’ attention turn to the reality of the pending federal debt ceiling being reached by October 1 if not sooner and the lack of cooperation between the House and the Senate and Administration. Stocks fell notably on the day.
Equities were up this past week. The Dow was up 0.5 percent; the S&P 500, up 1.3 percent; the Nasdaq, up 1.4 percent; the Russell 2000, up 1.8 percent; and the Wilshire 5000, up 1.4 percent.
For the year-to-date, major indexes are up as follows: the Dow, up 17.9 percent; the S&P 500, up 19.9 percent; the Nasdaq, up 25.0 percent; the Russell 2000, up 26.3 percent; and the Wilshire 5000, up 21.5 percent.
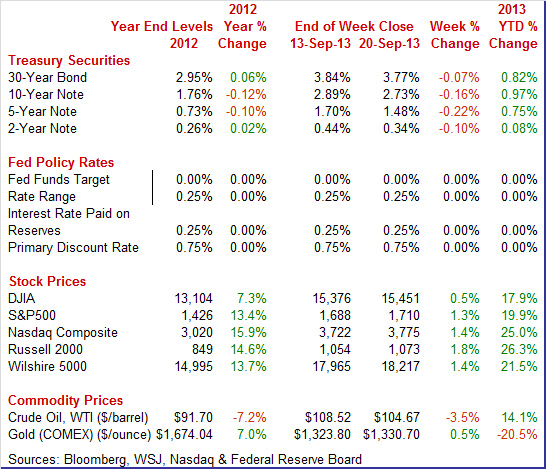
Weekly percent change column reflects percent changes for all components except interest rates. Interest rate changes are reflected in simple differences.
 The big move this past week for Treasury rates was Wednesday after the Fed’s decision to not taper. Yields nudged up modestly Thursday after a lower-than-expected jobless claims number and with some comeback after Wednesday’s huge swing down. Rates nudged down Friday on flight to safety as equities dropped sharply on worries about the federal debt ceiling being reached by month end. The big move this past week for Treasury rates was Wednesday after the Fed’s decision to not taper. Yields nudged up modestly Thursday after a lower-than-expected jobless claims number and with some comeback after Wednesday’s huge swing down. Rates nudged down Friday on flight to safety as equities dropped sharply on worries about the federal debt ceiling being reached by month end.
Overall, the lack of tapering resulted in the yield curve moving down after expectations of less demand in long bonds by the Fed were dashed.
 For this past week Treasury rates were down as follows: 3-month T-bill, down 1 basis point; the 2-year note, down 10 basis points; the 5-year note, down 22 basis points; the 7-year note, down 20 basis points; the 10-year note, down 16 basis points; and the 30-year bond, down 7 basis points. For this past week Treasury rates were down as follows: 3-month T-bill, down 1 basis point; the 2-year note, down 10 basis points; the 5-year note, down 22 basis points; the 7-year note, down 20 basis points; the 10-year note, down 16 basis points; and the 30-year bond, down 7 basis points.
The yield curve shifted down for medium-term and long-term rates after the Fed decision but remains higher than after the June policy decision when taper talk began in earnest. The dip in the longer maturities should help the housing market with lower mortgage rates.
 The spot price of West Texas Intermediate fell notably this past week despite the Fed’s unexpected continued quantitative easing with no taper. Crude fell more than $2 per barrel on Monday as talks regarding Syria were seen as averting military confrontation with that country. Belief that talks between the U.S. and Russia would lead to a diplomatic solution to Syria issues and expectations of Fed taper on Wednesday led to a dip in crude on Tuesday by somewhat under a buck a barrel. The spot price of West Texas Intermediate fell notably this past week despite the Fed’s unexpected continued quantitative easing with no taper. Crude fell more than $2 per barrel on Monday as talks regarding Syria were seen as averting military confrontation with that country. Belief that talks between the U.S. and Russia would lead to a diplomatic solution to Syria issues and expectations of Fed taper on Wednesday led to a dip in crude on Tuesday by somewhat under a buck a barrel.
But on Wednesday, spot WTI jumped almost $3 per barrel on news that the Fed was not tapering and would maintain its current pace of quantitative easing. Crude fell significantly the last two trading days. WTIE fell a little over $2 per barrel on news of an increase in Libya’s oil output and on a statement by Syrian President Bashar al-Assad that he would allow international inspectors access to chemical weapons facilities. Crude dropped another buck and a half on Friday on information of continued increase in Libya’s oil production.
Net for the week, the spot price for West Texas Intermediate dropped $3.85 per barrel to settle at $104.67.
It was mainly about the Fed taper decision this past week or rather the decision to not taper. Meanwhile, housing and manufacturing data were mixed but net positive. And inflation looks tame.
 The Federal Reserve surprised financial markets and did not curtail its bond purchase programs. Mortgage backed securities purchases remain at US$40 billion and long term Treasuries stay at US$45 billion. The fed funds rate range remains at zero to 0.25 percent where it has been since December 2008. The Federal Reserve surprised financial markets and did not curtail its bond purchase programs. Mortgage backed securities purchases remain at US$40 billion and long term Treasuries stay at US$45 billion. The fed funds rate range remains at zero to 0.25 percent where it has been since December 2008.
One of the main reasons that FOMC members did not taper is that they are concerned about fiscal drag given the looming impasse in Congress over the federal budget. Chairman Ben Bernanke estimated this to be about a 1 percentage point reduction in economic growth. A second reason for the delay in reducing its bond purchases was that labor market conditions continue to be questionable. The statement noted that despite progress, the unemployment rate remains “elevated.” Bernanke noted that part of the reason for the decline in the unemployment rate is the decrease in the labor force participation rate which was not seen as a positive.
 The Fed kept its guidance on the fed funds rate and anticipates that this exceptionally low range for the federal funds rate will be appropriate at least as long as the unemployment rate remains above 6.5 percent. Low rates also are dependent upon inflation being projected no more than a half percentage point above the Committee's 2 percent longer run goal and longer term inflation expectations continue to be well anchored between one and two years ahead. The Fed kept its guidance on the fed funds rate and anticipates that this exceptionally low range for the federal funds rate will be appropriate at least as long as the unemployment rate remains above 6.5 percent. Low rates also are dependent upon inflation being projected no more than a half percentage point above the Committee's 2 percent longer run goal and longer term inflation expectations continue to be well anchored between one and two years ahead.
In his press conference, Chairman Bernanke reiterated much of what was in the FOMC statement. He underlined yet again that the Fed’s policy moves are data driven. He said the plan is to maintain a highly accommodative policy, with the Fed looking to see if its basic outlook for the economy is confirmed. Only then would the Bank take the first step to remove the stimulus. He noted that the early part of the second half is turning out to be more sluggish than anticipated during the June FOMC meeting and that inflation is running slower than expected.
Kansas City Fed president Esther George dissented and Governor Raskin was absent, resulting in a 9 to 1 vote for the statement. George dissented and “was concerned that the continued high level of monetary accommodation increased the risks of future economic and financial imbalances and, over time, could cause an increase in long-term inflation expectations.”
The bottom line is that there now is no magic number for the beginning of taper. It is all about data dependency—meaning the status of the overall economy with focus on the labor market (but not just the unemployment rate). Apparently, all economic news counts for the Fed—as is appropriate.
The Econoday survey of economists now has a median forecast for taper to start in December although minority votes are for October and beyond December.
 Housing starts rose in August but only because July was revised down. Housing may be flattening. Housing starts in in August advanced 0.9 percent after rebounding 5.7 percent in July. The August starts annualized level of 0.891 million units was up 19.0 percent on a year-ago basis. July was revised down to 0.883 million units from the original estimate of 0.896 million. Housing starts rose in August but only because July was revised down. Housing may be flattening. Housing starts in in August advanced 0.9 percent after rebounding 5.7 percent in July. The August starts annualized level of 0.891 million units was up 19.0 percent on a year-ago basis. July was revised down to 0.883 million units from the original estimate of 0.896 million.
 The gain in starts was led by the single-family component which increased 7.0 percent after declining 3.0 percent the prior month. The volatile multifamily component declined 11.1 percent after jumping 28.7 percent in July. The gain in starts was led by the single-family component which increased 7.0 percent after declining 3.0 percent the prior month. The volatile multifamily component declined 11.1 percent after jumping 28.7 percent in July.
Forward momentum is slipping. Permits fell 3.8 percent after a 3.9 percent rebound in July. August’s annualized pace of 0.918 million units was up 11.0 percent on a year-ago basis. Weakness for the latest month was in the multifamily component.
Housing may be slowing although it is a tough call since weakness in August was in the volatile multifamily component. Determining the true trend is going to take more data. But the single-family component continues at a moderate uptrend.
 At a recovery best, sales of existing homes came in at a 5.480 million annual rate in August consensus for 5.255 million. The monthly 1.7 percent gain was on top of July's giant 6.5 percent surge when "panic" over rising rates moved buyers into the market. At a recovery best, sales of existing homes came in at a 5.480 million annual rate in August consensus for 5.255 million. The monthly 1.7 percent gain was on top of July's giant 6.5 percent surge when "panic" over rising rates moved buyers into the market.
The National Association of Realtors (NAR), which compiles the existing homes report, used the word "panic" in the July report and is warning that the gain in August may have also been skewed higher by nervous buyers. The NAR is further warning that the August gain may prove to be the "last hurrah" as higher mortgage rates, even with the Fed decision to maintain stimulus, are an immediate threat to the home sales market.
Another factor besides higher rates that is holding down sales is lack of homes on the market, at 4.9 months at the current sales rate versus 5.0 and 5.1 months in the two prior months. But a rise in prices is no longer a factor holding down sales, at least based on data in this report which show very slight downticks with the median price at $212,100.
 Overall industrial production posted a 0.4 percent increase in August, following no change in July (originally unchanged). Analysts projected a 0.5 percent jump for August. Overall industrial production posted a 0.4 percent increase in August, following no change in July (originally unchanged). Analysts projected a 0.5 percent jump for August.
The manufacturing component jumped 0.7 percent, following a 0.4 percent decrease in July. Market expectations were for a 0.5 percent rise. Gains were broadly based but led by motor vehicles. Excluding motor vehicles, manufacturing rebounded 0.4 percent after a 0.1 percent dip in July.
The output of durable goods jumped 1.2 percent in August after having declined 0.6 percent in July. In August, the production of motor vehicles and parts rebounded 5.2 percent after having fallen a downwardly revised 4.5 percent in July. The production of nondurable goods edged up 0.1 percent in August and was 1.5 percent above its level of a year earlier.
The output of utilities fell 1.5 percent in August, following a 1.3 percent decline the prior month. This was this component’s fifth consecutive decrease. Production at mines advanced 0.3 percent after a 2.4 percent jump the month before. Mining activity has increased five months in a row.

Capacity utilization for total industry rebounded to 77.8 percent from 77.6 percent in July. The median market forecast was for 77.9 percent.
The latest industrial production report shows a moderately strong manufacturing sector in August with autos a standout component. But manufacturing has wavered over recent months and one month doesn't make a trend.
 In the latest regional reports, the New York Fed reports slowing conditions in manufacturing while the Philly Fed indicates strengthening. In the latest regional reports, the New York Fed reports slowing conditions in manufacturing while the Philly Fed indicates strengthening.
 Growth in general conditions, at 6.29, has been soft so far this month in the New York manufacturing region with new orders especially soft which points to continued sluggish activity ahead. The new orders index rose to 2.35 in the latest reading for September, but the level is very close to dead-flat zero. The index was nearly at zero in August at 0.27 after drifting in the low positive single digits to low negative single digits since March. To keep activity going, manufacturers in the region continue to draw down their backlog with unfilled orders at minus 6.45 to extend a long series of monthly contraction. Growth in general conditions, at 6.29, has been soft so far this month in the New York manufacturing region with new orders especially soft which points to continued sluggish activity ahead. The new orders index rose to 2.35 in the latest reading for September, but the level is very close to dead-flat zero. The index was nearly at zero in August at 0.27 after drifting in the low positive single digits to low negative single digits since March. To keep activity going, manufacturers in the region continue to draw down their backlog with unfilled orders at minus 6.45 to extend a long series of monthly contraction.
Turning to the Philly Fed survey, activity was notably stronger in September. The Philly Fed index jumped from an already solid 9.3 in August to an outstanding 22.3 to show the greatest rate of monthly growth in 2-1/2 years. The strength was supported by a big jump in new orders to 21.2 from August's 5.3 with backlog orders, at plus 4.3, showing a rare build.
With production busy, demand for employment was up with the index at 10.3 versus August's 3.5.
Other readings include a dip in inventories, a slowing in delivery times, and increases in pricing -- all consistent with the rise in general activity.
 The latest consumer inflation numbers are tame and will not be pressuring the Fed to taper in a hurry. The consumer price index in August posted a 0.1 percent rise, compared to July’s 0.2 percent and June’s 0.5 percent. The core CPI—excluding food and energy—edged up 0.1 percent after rising 0.2 percent the month before. The latest consumer inflation numbers are tame and will not be pressuring the Fed to taper in a hurry. The consumer price index in August posted a 0.1 percent rise, compared to July’s 0.2 percent and June’s 0.5 percent. The core CPI—excluding food and energy—edged up 0.1 percent after rising 0.2 percent the month before.
By major components outside the core, energy declined 0.3 percent after edging up 0.2 percent in July. Gasoline slipped 0.1 percent, following an increase of1.0 percent the prior month. Food edged up 0.1 percent, matching the pace in July.
For the core measure, softness was seen in several areas. The new vehicles index, which rose in June and July, was unchanged in August, while the recreation index was unchanged for the second straight month. The index for airline fares declined sharply in August, falling 3.1 percent. This was the third consecutive decline for the index, but it has still risen 1.5 percent over the past 12 months. The indexes for used cars and trucks and household furnishings and operations both declined slightly in August, falling 0.1 percent.
For the core, there was upward pressure in some components. The shelter index increased 0.2 percent, the same increase as in June and July. The index for medical care increased 0.6 percent in August. Also rising in August were the indexes for personal care, which rose 0.3 percent, tobacco, which advanced 0.4 percent, and apparel, which increased 0.1 percent.
Year-on-year, overall CPI inflation eased to 1.5 percent from 2.0 percent in July (seasonally adjusted). The core rate posted at 1.8 percent versus 1.7 percent in July. On an unadjusted year-ago basis, the headline CPI in August was up 1.5 percent and the core was up 1.8 percent.
Overall, inflation for the consumer has been a little volatile at the headline level but on average has been tame. Fed hawks will be looking notably down the road on potential inflation pressures as the latest numbers paint a picture of subdued inflation.
 The index of leading economic indicators jumped a very sharp and higher-than-expected 0.7 percent in August following a very solid revised gain of 0.5 percent in July. The index of leading economic indicators jumped a very sharp and higher-than-expected 0.7 percent in August following a very solid revised gain of 0.5 percent in July.
Gains were widespread and included gains for manufacturing orders and the factory workweek. Unemployment claims are also a positive in August and, like manufacturing readings, may extend into this month given the big drop underway as seen in latest jobless claims report. Readings on interest rates and credit activity were also strong positives.
Other data included a rise in the coincident index, to plus 0.2 percent from plus 0.1 and zero percent in the two prior readings to indicate slight acceleration in ongoing growth. The lagging index is up 0.3 percent to hint at greater-than-expected growth in previously released data.
The Fed is continuing to supply lift to a sluggish recovery. Indicators are mixed but mostly moderately positive. However, the next hurdle for markets is the federal debt ceiling which is projected to be hit by October 1 if not sooner. Lack of progress on the debt ceiling could rattle markets. This was one reason for the Fed to continue bond purchases as is.
This week, there is a wide range of news on manufacturing, housing and the consumer sector. All three sectors have been wavering in recent months. Manufacturing updates are seen in the flash Markit PMI for September and durables orders for August. Durables outside of aircraft have been soft. Housing news includes new home sales after this past week’s surprise rise in existing home sales. The Fed gets to see if home prices continue their uptrend with FHFA and Case-Shiller. On the consumer front, the big update is Friday with personal income, including the spending components.
The Markit PMI manufacturing index (final) showed manufacturing growth slowed the last two weeks of August, to 53.1 from 53.9 for the mid-month flash reading. The index came in at 53.7 in July. Any reading over 50 indicates monthly growth and the implied reading for the last two weeks points to a low 52 pace. Growth in new orders was somewhat strong but at 55.7 versus the flash 56.5 at mid-month, was a bit less strong than earlier in the month.
Markit PMI manufacturing flash index Consensus Forecast for September 13: 54.0
Range: 53.5 to 54.5
The FHFA purchase only house price index for June gained 0.7 percent after rising 0.8 percent in May. The June HPI was the 17th consecutive monthly price increase in the purchase-only, seasonally adjusted index. The June boost was led by the East South Central region, increasing 1.6 percent. The weakest was the Middle Atlantic region which declined 0.6 percent. Six of nine Census regions showed gains in the latest month while three decreased. The year-on-year rate for June stood at 7.7 percent, compared to 7.5 percent in May.
FHFA purchase only house price index Consensus Forecast for July 13: +0.7 percent
Range: +0.4 to +1.2 percent
The S&P/Case-Shiller 20-city home price index (SA) was up 0.9 percent in the June report versus an average monthly gain of 1.4 percent from January to May. But the year-on-year adjusted gain, at a very sizable 12.0 percent, was just off its best level of the recovery which was May at plus 12.2 percent.
The S&P/Case-Shiller 20-city HPI (SA, m/m) Consensus Forecast for July 13: +0.8 percent
Range: +0.4 to +1.0 percent
The S&P/Case-Shiller 20-city HPI (NSA, m/m) Consensus Forecast for July 13: +2.0 percent
Range: +1.0 to +2.1 percent
The S&P/Case-Shiller 20-city HPI (NSA, y/y) Consensus Forecast for July 13: +12.4 percent
Range: +11.2 to +12.8 percent
The Conference Board's consumer confidence index for August showed a slight increase, to 81.5 from July's revised 81.0, but there was a little bit of weakness in the present situation component which was down to 70.7 from 73.6. On the plus side, the expectations component was up, to 88.7 for a 2.7 point gain. A very big plus was the consumer's outlook on income which, after sliding at the beginning of the year in reaction to the hike in payroll taxes, is now at a 2-1/2 year high. The consumer's outlook on business conditions and the jobs market was also up.
Consumer confidence Consensus Forecast for September 13: 80.0
Range: 76.3 to 82.0
The Richmond Fed manufacturing index was notably positive for August. Activity picked up strongly with the headline index at plus 14 versus July's minus 11. New orders showed a similar swing back into positive ground as did shipments. Employment was up, the workweek was up, and wages were up. One negative, however, was continued contraction in backlog orders.
Richmond Fed manufacturing index Consensus Forecast for September 13: 10.5
Range: 8.0 to 16.0
Durable goods orders in July dropped a huge 7.4 percent after jumping 3.9 percent the month before. The transportation component fell a monthly 19.4 percent, following a spike of 11.7 percent in June. Excluding transportation, durables orders dipped 0.8 percent after a rise of 0.1 percent in June. Numbers reflect revisions from the more recent total factory orders report.
New orders for durable goods Consensus Forecast for August 13: -0.5 percent
Range: -4.5 percent to +3.6 percent
New orders for durable goods, ex-trans., Consensus Forecast for August 13: +1.0 percent
Range: -0.2 percent to +2.5 percent
New home sales in July plunged a monthly 13.4 percent to a 394,000 annual rate and followed a 3.6 percent rise in June. For a second month in a row, the report included major downward revisions to the two prior months totaling 62,000 in the latest report. The 394,000 rate for July was the lowest since October 2012. Supply on a monthly basis is now at 5.2 months versus 4.3 months in June. The number of new homes on the market increased in the month, to an adjusted 171,000 from June's 164,000. However, the months’ supply number is volatile, heavily dependent on monthly swings in the sales pace. However, the latest rise in existing home sales point to modest optimism for new home sales. Sales may be up on worries about potential future gains in mortgage rates.
New home sales Consensus Forecast for August 13: 425 thousand-unit annual rate
Range: 400 thousand to 450 thousand-unit annual rate
GDP growth was a little healthier than earlier believed. In the BEA’s second estimate, real GDP growth for the second quarter was raised to an annualized rate of 2.5 percent compared to the initial estimate of 1.7 percent and compared to a first quarter rise of 1.1 percent. Final sales of domestic product showed a revised gain of 1.9 percent versus the advance estimate of 1.3 percent. This series increased 0.2 percent in the first quarter. Final sales to domestic producers (which exclude net exports) were nudged down to 1.9 percent versus the initial estimate of 2.0 percent. This followed a 0.5 percent gain in the first quarter. Headline inflation for the GDP price index was revised up to 0.8 percent compared to the advance estimate of a 0.7 percent annualized inflation rate. When excluding food and energy, inflation for the second quarter was unrevised at 1.1 percent.
Real GDP Consensus Forecast for third estimate Q2 13: +2.7 percent annual rate
Range: +2.4 to +3.1 percent annual rate
GDP price index Consensus Forecast for third estimate Q2 13: +0.8 percent annual rate
Range: +0.7 to +0.8 percent annual rate
Initial jobless claims rose 15,000 in the September 14 week but against a prior week that, despite administrative issues in California and Nevada that led to an undercount, was revised only 2,000 higher to what is still a recovery low, now at 294,000. The 4-week average is pointing to improvement in the labor market. The average is down 7,000 to a recovery low of 314,750 and is trending about 15,000 below the month-ago average.
Jobless Claims Consensus Forecast for 9/21/13: 330,000
Range: 315,000 to 370,000
The pending home sales index, which offers an early signal on final sales of existing homes, was down 1.3 percent in the July report, following a 0.4 percent decline in June. Weakness was concentrated in the two high-cost regions of the Northeast and the West. The National Association of Realtors, which compiles the report, notes that supply constraint is a special problem in the West. The two remaining regions, the Midwest and what is by far the largest housing region which is the South, show little change in the month.
Pending home sales Consensus Forecast for August 13: -1.0 percent
Range: -5.0 to +1.5 percent
The Kansas City Fed manufacturing index improved further in August, and producers’ expectations also edged higher after easing last month. Price indexes rose modestly, with a continued increase in future finished goods prices. The month-over-month composite index was 8 in August, up from 6 in July and minus 5 in June. Most other monthly indexes also improved. The production index remained solid at 21, and the new orders and order backlog indexes also rose moderately. The new orders for exports index edged higher from 2 to 4, and the employment index moved into positive territory for the first time in six months.
Kansas City Fed manufacturing index Consensus Forecast for September 13: 9.0
Range: 0.0 to 11.0
Personal income inched up 0.1 percent in July after gaining 0.3 percent the month before. However, the wages & salaries component was notably weak, declining 0.3 percent after an increase of 0.4 percent in June. Strength was in the dividend and rental income components. Odds are that dividend income will be down in August, given the monthly swoon in equities. Consumer spending slowed sharply to a 0.1 percent rise in July but followed a strong 0.6 percent boost the month before. Headline inflation eased notably to a 0.1 percent rise in July from a 0.4 percent jump in June. The core inflation rate slowed to a 0.1 percent increase from 0.2 in June. More recently, private aggregate weekly earnings rose a sizeable 0.6 percent in August, pointing to a significant gain in private wages & salaries. Unit new motor vehicle sales gained 1.8 percent in August while retail sales excluding autos edged up 0.1 percent, suggesting that the goods portion of personal spending will be up for the month.
Personal income Consensus Forecast for August 13: +0.4 percent
Range: +0.2 to +0.5 percent
Personal consumption expenditures Consensus Forecast for August 13: +0.3 percent
Range: +0.2 to +0.4 percent
PCE price index Consensus Forecast for August 13: +0.1 percent
Range: +0.1 to +0.2 percent
Core PCE price index Consensus Forecast for August 13: +0.1 percent
Range: +0.1 to +0.2 percent
The Reuter's/University of Michigan's consumer sentiment index fell to its lowest level since early in the year, to 76.8 versus 82.1 for final August and versus 80.0 at mid-month August. The data on the first half of the month were soft with current conditions falling 3.4 points to 91.8. Note that strength in August was confined to the second half of the month and that the first half was weak. In fact a comparison of the mid-month readings shows a 0.8 point improvement this month. The expectations component showed the most weakness, down 6.5 points to 67.2 which is the lowest reading since the tax-hike days of January. A separate reading on the 12-month economic outlook was down a very steep 10 points to 85.
Consumer sentiment Consensus Forecast for final September 13: 78.0
Range: 76.0 to 80.0
R. Mark Rogers is the author of The Complete Idiot’s Guide to Economic Indicators, Penguin Books.
Econoday Senior Writer Mark Pender contributed to this article.
|
