|
Despite most news on economic indicators being modestly positive, the consumer is less sure about the economy and is holding back growth in spending. Meanwhile, equities continued to rebound over developments regarding Syria.
 Equities advanced significantly this past week despite tepid economic news on the consumer sector. The strongest gains of the week posted Monday with most key indexes rising more than 1 percent. Stocks got an early boost after China reported a pickup in exports in August, and news on Syria—that a diplomatic solution might be reached regarding chemical weapons instead of military strikes—helped calm investor jitters about the region. The Dow climbed over the 15,000 benchmark again. Equities advanced significantly this past week despite tepid economic news on the consumer sector. The strongest gains of the week posted Monday with most key indexes rising more than 1 percent. Stocks got an early boost after China reported a pickup in exports in August, and news on Syria—that a diplomatic solution might be reached regarding chemical weapons instead of military strikes—helped calm investor jitters about the region. The Dow climbed over the 15,000 benchmark again.
 On Tuesday, Syria and China were the drivers behind notable increases in stocks. Fears about a possible military strike against Syria eased after Monday remarks by President Obama that he saw a possible breakthrough after Russia proposed that Syria hand over its chemical weapons for destruction. Before the open, economic data in China showed stronger than expected industrial output while retail sales grew at the fastest pace this year. At mid-week, equities were mostly up as optimism grew that a military strike against Syria would not take place. On Tuesday, Syria and China were the drivers behind notable increases in stocks. Fears about a possible military strike against Syria eased after Monday remarks by President Obama that he saw a possible breakthrough after Russia proposed that Syria hand over its chemical weapons for destruction. Before the open, economic data in China showed stronger than expected industrial output while retail sales grew at the fastest pace this year. At mid-week, equities were mostly up as optimism grew that a military strike against Syria would not take place.
Equities fell moderately on Thursday despite a sharp drop in initial jobless claims. Leading stocks down were materials producers on concern about Syria and as many investors in the materials sector decided that the Fed will cut back on QE sooner than later. At the end of the week, bad news was good news in the view of traders. Disappointing results for retail sales and consumer sentiment led to belief that the Fed may only slowly taper its QE purchases of bonds.
Equities were up this past week. The Dow was up 3.0 percent; the S&P 500, up 2.0 percent; the Nasdaq, up 1.7 percent; the Russell 2000, up 2.4 percent; and the Wilshire 5000, up 2.1 percent.
For the year-to-date, major indexes are up as follows: the Dow, up 17.3 percent; the S&P 500, up 18.4 percent; the Nasdaq, up 23.3 percent; the Russell 2000, up 24.1 percent; and the Wilshire 5000, up 19.8 percent.
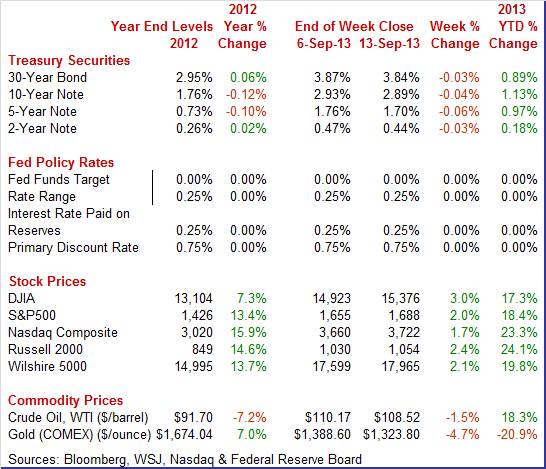
Weekly percent change column reflects percent changes for all components except interest rates. Interest rate changes are reflected in simple differences.
 Treasury rates declined moderately for the week. Throughout, an undercurrent was growing belief that the September 18 FOMC statement would at most announce a small amount of tapering initially. This started Monday with a small decline in yields. However, yields increased Tuesday on reversal of flight to safety as tensions over Syria eased. Treasury rates declined moderately for the week. Throughout, an undercurrent was growing belief that the September 18 FOMC statement would at most announce a small amount of tapering initially. This started Monday with a small decline in yields. However, yields increased Tuesday on reversal of flight to safety as tensions over Syria eased.
On Wednesday, rates resumed downward movement with moderately sizeable declines as the 10-year auction went better than expected. After flat yields on Thursday, rates eased marginally on Friday after disappointing reports on the consumer sector.
For this past week Treasury rates were down as follows: the 2-year note, down 3 basis points; the 5-year note, down 6 basis points; the 7-year note, down 7 basis points; the 10-year note, down 4 basis points; and the 30-year bond, down 3 basis points. The 3-month T-bill was unchanged.
 The spot price of West Texas Intermediate fell moderately this past week. After hitting a two-year high the prior Friday, crude fell Monday and Tuesday on an easing of worries that the U.S. would lead a military strike against Syria with daily decreases of a little more than a dollar a barrel and about a buck and half, respectively. The concern is that military conflict could spread and interrupt supply flows—notably through the Suez Canal. The spot price of West Texas Intermediate fell moderately this past week. After hitting a two-year high the prior Friday, crude fell Monday and Tuesday on an easing of worries that the U.S. would lead a military strike against Syria with daily decreases of a little more than a dollar a barrel and about a buck and half, respectively. The concern is that military conflict could spread and interrupt supply flows—notably through the Suez Canal.
Crude nudged up marginally on Wednesday as oil inventories at Cushing, Oklahoma dropped to the lowest level since February 2012. WTI rose for a second day Thursday—almost a dollar a barrel—as traders became increasingly skeptical that a diplomatic deal could be worked out to resolve the issue of Syria’s chemical weapons. Crude was flat on Friday.
Net for the week, the spot price for West Texas Intermediate dipped $1.65 per barrel to settle at $108.52.
This past week, it looks like the consumer paused as retail sales slowed and sentiment unexpectedly dropped. The latest numbers show inflation to remain subdued despite monthly volatility at the headline level.
 The consumer took a breather in August after lots of shopping in July. Retail sales increased 0.2 percent in August after a 0.4 percent gain the month before This was the weakest gain in four months. However, autos jumped 0.9 after a 0.5 percent dip in July. Retail sales excluding autos edged up 0.1 percent, following a 0.6 percent rise the month before. Gasoline sales were flat, following a 0.7 percent spike in July. Excluding the auto and gasoline components, sales nudged up 0.1 percent, following a 0.6 percent boost in July. The consumer took a breather in August after lots of shopping in July. Retail sales increased 0.2 percent in August after a 0.4 percent gain the month before This was the weakest gain in four months. However, autos jumped 0.9 after a 0.5 percent dip in July. Retail sales excluding autos edged up 0.1 percent, following a 0.6 percent rise the month before. Gasoline sales were flat, following a 0.7 percent spike in July. Excluding the auto and gasoline components, sales nudged up 0.1 percent, following a 0.6 percent boost in July.
 Within the core, the numbers were mixed. On the strong side were furniture & home furnishing (likely due to recent gains in home sales), electronics & appliances (possible boost from back to school) and miscellaneous store retailers. On the downside were building materials & garden equipment (but followed a robust July), clothing & accessories, and sporting goods & hobbies. Within the core, the numbers were mixed. On the strong side were furniture & home furnishing (likely due to recent gains in home sales), electronics & appliances (possible boost from back to school) and miscellaneous store retailers. On the downside were building materials & garden equipment (but followed a robust July), clothing & accessories, and sporting goods & hobbies.
For August, sales strength clearly was in motor vehicle sales. Outside of autos, components were mixed but net flat. However, August followed a robust July and some deceleration probably should be expected. But also, slippage in consumer confidence may be holding back spending.
 The consumer mood has turned sour in September. Consumer sentiment so far this month has fallen to its lowest level since early in the year, to 76.8 versus 82.1 for final August and versus 80.0 at mid-month August. The consumer mood has turned sour in September. Consumer sentiment so far this month has fallen to its lowest level since early in the year, to 76.8 versus 82.1 for final August and versus 80.0 at mid-month August.
The causes are difficult to pinpoint but could reflect August’s drop in the stock market, rising mortgage rates, and slowing in growth of home prices. Only a small percentage was worried about the Syria situation slowing economic growth.
 But the data on the first half of the month were soft with current conditions, a component that offers early clues on the monthly comparison with August, falling 3.4 points to 91.8. Note that strength in August was confined to the second half of the month and that the first half was weak. In fact a comparison of the mid-month readings shows a 0.8 point improvement this month. But the data on the first half of the month were soft with current conditions, a component that offers early clues on the monthly comparison with August, falling 3.4 points to 91.8. Note that strength in August was confined to the second half of the month and that the first half was weak. In fact a comparison of the mid-month readings shows a 0.8 point improvement this month.
The expectations component showed the most weakness, down 6.5 points to 67.2 which is the lowest reading since the tax-hike days of January. A separate reading on the 12-month economic outlook was down a very steep 10 points to 85.
Gas prices, despite the brief Syrian-related spike in oil to $110, have been steady so far this month, yet inflation readings in this report showed a little pressure perhaps related to the oil spike. Expectations for the 1-year outlook are up 2 tenths to 3.2 percent with the 5-year outlook up 1 tenth to 3.0 percent.
More recently, the Bloomberg weekly measure of consumer confidence leveled off in the September 8 week after hitting an almost five-month low the prior week. Overall, the consumer is less confident about the economy but confidence remains significantly higher than during the past recession.
 Jobs were harder to find in July. There were 3.689 million job openings on the last business day of July, down marginally from June at a revised 3.869 million. The job openings rates slipped to 2.6 percent from 2.8 percent in June. Jobs were harder to find in July. There were 3.689 million job openings on the last business day of July, down marginally from June at a revised 3.869 million. The job openings rates slipped to 2.6 percent from 2.8 percent in June.
The number of job openings in July (not seasonally adjusted) was little changed over the year for total nonfarm, total private, and government. Increases in job openings in several industries were offset by decreases in job openings in several other industries, leading to little change at the total nonfarm level.
The hires rate, 3.2 percent, and separations rate, 3.0 percent, were little changed in July. But looking at levels, there was modest improvement. Hires edged up to 4.419 million from 4.318 million in June while separations eased slightly to 4.109 million in July from 4.228 million the month before.
Overall, the latest JOLTS report still reflects a sluggish labor market but one that is modestly positive.
 Consumer credit grew at a slightly slower pace in July, up $10.4 billion versus a revised $11.9 billion in June. Revolving credit shows weakness for a second month, down $1.8 billion versus June's dip of $3.7 billion in declines that suggest credit-card use is down. Consumer credit grew at a slightly slower pace in July, up $10.4 billion versus a revised $11.9 billion in June. Revolving credit shows weakness for a second month, down $1.8 billion versus June's dip of $3.7 billion in declines that suggest credit-card use is down.
Non-revolving credit once again showed strength which for July, because of slowing in the student-loan category, points to financing for vehicle sales which, however, were not that strong in the month.
Consumer activity has been mixed in recent months, reflecting stubbornly soft job growth and increased nervousness about the economy.
 Producer prices accelerated in August on food and energy. The August producer price index rose 0.3 percent after no change in July. The core rate, which excludes both food and energy, was flat after a 0.1 percent rise in July. Expectations were for a 0.1 percent increase. Producer prices accelerated in August on food and energy. The August producer price index rose 0.3 percent after no change in July. The core rate, which excludes both food and energy, was flat after a 0.1 percent rise in July. Expectations were for a 0.1 percent increase.
Food prices jumped 0.6 percent after being flat in July. Energy surged 0.8 percent, following a 0.2 percent dip the prior month. Gasoline prices spiked 2.6 percent after decreasing 0.8 percent in July.
 Weakness in the core included a 0.5 percent decline in prices for passenger cars and a 0.3 percent decrease for light trucks. Weakness in the core included a 0.5 percent decline in prices for passenger cars and a 0.3 percent decrease for light trucks.
For the overall PPI, the year-ago rate slowed to 1.4 percent from 2.1 percent in July (seasonally adjusted). The core rate held steady at 1.2 percent in August. On a not seasonally adjusted basis for August, the year-ago headline PPI was up 1.4 percent, while the core was up 1.1 percent. The overall year-ago pace is the lowest since April.
Outside of energy, the Fed will not see much inflation at the producer level which gives the Fed latitude for slow tapering. And the consumer sector softened with the release of August retail sales—adding to that possibility.
 Currently, inflation is not being imported to the U.S. Instead, there continues to be more downward price pressure than upward pressure in import and export price data. Import prices were unchanged in the August report following a slight 0.1 percent revised uptick in July that follows 4 prior months of declines. Year-on-year, import prices were down 0.4 percent. Currently, inflation is not being imported to the U.S. Instead, there continues to be more downward price pressure than upward pressure in import and export price data. Import prices were unchanged in the August report following a slight 0.1 percent revised uptick in July that follows 4 prior months of declines. Year-on-year, import prices were down 0.4 percent.
 When stripping out petroleum, import prices were down 0.2 percent for a fourth straight decline. Petroleum, up 0.8 percent in August, was one of the few components showing upward pressure. Otherwise, minus signs swept the import components including another sweep of small downticks for finished goods. When stripping out petroleum, import prices were down 0.2 percent for a fourth straight decline. Petroleum, up 0.8 percent in August, was one of the few components showing upward pressure. Otherwise, minus signs swept the import components including another sweep of small downticks for finished goods.
Weakness in global economic growth, however, is hurting U.S. producers. Downticks also swept the export side of the report with the headline at minus 0.5 percent which is a sixth straight negative reading. Year-on-year export prices were down 1.1 percent. Agricultural prices are the outsized component for export prices and were down a steep 4.3 percent in August with the year-on-year rate at minus 5.7 percent. Export prices for finished goods also showed a sweep of declines especially for consumer goods.
Global price pressures, judging from this report, are in reverse and could even spark talk within the Fed of deflation—supporting the case for either continuing QE programs as is or with only minimal initial tapering.
The latest week of economic news does not paint a picture of a robust U.S. economy—but still one with modest growth. But the data on the consumer were sluggish or negative with a slowing in retail sales, a dip in job openings, revolving credit in negative territory, and consumer sentiment dropping. A case likely will be made at the September 17-18 FOMC meeting that any tapering should be small initially.
Traders are focusing on the Fed’s policy statement Wednesday afternoon and whether the Fed will decide to cut back on quantitative easing purchases now or later this year. Ahead of Wednesday’s decision, the Fed will get the chance to mull over some hard numbers for industrial production and housing starts. Both have been fluctuating recently. And before the policy announcement, there will be another reading on whether inflation is remaining subdued with the CPI report. Later in the week, traders will be watching to see if existing home sales continue upward after July’s spike.
The Empire State manufacturing index in August eased to 8.24 from 9.46 in July. The change in the headline index was not as striking as the change in many of the details especially new orders where growth, at only 0.27, was essentially at a standstill. New orders have not been showing much life at all, posting only a slight rise in July following a run of slight contraction in prior months. One positive, however, was a big jump in employment growth, at 10.84 that combined with a surprising rise in the workweek, at 4.82.
Empire State Manufacturing Survey Consensus Forecast for September 13: 9.00
Range: 4.50 to 12.50
Industrial production was flat in July, following a 0.2 percent rise in June and no change in May. The manufacturing component slipped 0.1 percent after a 0.2 percent rise in June. Excluding motor vehicles, manufacturing was unchanged in July, following a 0.1 percent increase in June. The output of utilities fell 2.1 percent after declining 0.8 percent in June. Production at mines showed a 2.1 percent boost, following a 1.0 gain in June. Capacity utilization for total industry slipped to 77.6 in July from 77.7 the month before. Looking ahead, from the employment report, production worker hours in manufacturing were up 0.5 percent for the month, suggesting a healthy manufacturing component for August industrial production.
Industrial production Consensus Forecast for August 13: +0.5 percent
Range: +0.2 to +0.8 percent
Manufacturing production component Consensus Forecast for August 13: +0.5 percent
Range: +0.2 to +0.7 percent
Capacity utilization Consensus Forecast for August 13: 77.9 percent
Range: 77.6 to 78.0 percent
The consumer price index July decelerated to a 0.2 percent rise after surging 0.5 percent the month before. The core CPI—excluding food and energy—posted at 0.2 percent, equaling the June rate. By major components outside the core, energy edged up 0.2 percent, following a spike of 3.4 percent in June. Food edged up 0.1 percent, following a rebound of 0.2 percent in June.
CPI Consensus Forecast for August 13 +0.1 percent
Range: 0.0 to +0.3 percent
CPI ex food & energy Consensus Forecast for August 13: +0.2 percent
Range: +0.1 to +0.2 percent
NAHB housing market index in August rose another 3 points to 59 for its highest reading since the really big bubble days of 2005. Strength is centered in the 6-month outlook which, at 68, points to increasing confidence among builders and what is likely to translate into increasing strains on the construction supply chain. But current sales were also extremely strong, at 62, which points to another month of strength for new home sales. Traffic continues to lag, at 45, which may suggest that buyers are tending to be high powered, relying on cash and less on debt for new purchases.
NAHB housing market index Consensus Forecast for September 13: 59
Range: 55 to 60
Housing starts made somewhat of a comeback in July and taking into account wet weather on the east coast should be taken as stronger than face value. Housing starts in July rebounded 5.9 percent after falling 7.9 percent in June. The July starts annualized level of 0.896 million units was up 20.9 percent on a year-ago basis. The boost in starts was led by a monthly 26.0 percent jump in the volatile multifamily component after a 24.8 percent fall in June. The single-family component dipped 2.2 percent after rising 1.2 percent the month before. Permits made a 2.7 percent comeback after dropping 6.8 percent in June. July’s annualized pace of 0.943 million units was up 12.4 percent on a year-ago basis.
Housing starts Consensus Forecast for August 13: 0.915 million-unit rate
Range: 0.885 million to 0.950 million-unit rate
Housing permits Consensus Forecast for August 13: 0.950 million-unit rate
Range: 0.910 million to 0.975 million-unit rate
The FOMC announcement at 2:00 p.m. ET for the September 17-18 FOMC policy meeting is expected to leaves policy rates unchanged but focus on whether bond purchases will be cut back sooner or later and how fast. Also, the Fed will release its quarterly forecasts before the chairman’s press conference, generally about 2:00 p.m. ET with the statement.
FOMC Consensus Forecast for 9/18/13 policy vote on fed funds target range: unchanged at a range of zero to 0.25 percent
For expectations of Fed taper, the Econoday survey panel has a median forecast for a $10 billion reduction to $75 billion from the current level of QE purchases of $85 billion monthly. The low forecast for QE purchases is $70 billion ($15 billion reduction) and the high is $85 billion (no taper at the September meeting). For timing, the median forecast is for taper to start with the September FOMC meeting; the low (earliest), of course, also is September. The furthest out for taper start is the October 29-30 FOMC meeting.
Chairman press conference after the FOMC meeting statement is scheduled for 2:15 p.m. ET. Fed Chairman Ben Bernanke conducts a press conference after FOMC meetings in which participants present their quarterly economic forecasts. Bernanke is expected to comment on the forecast and take Q&A. Focus will be on the taper decision and any changes in guidance.
Initial jobless claims dropped an eye-popping 31,000 drop in initial jobless claims to a much lower-than-expected 292,000 in the September 7 week. An administrative issue is a big special factor behind the huge decrease. The issue is tied to computer upgrades in two unnamed states, one large and one small, which the Labor Department is warning may have led to an undercount. Whether computer-related or not the count is a recovery low. The report for September 14 should be watched closely for revisions.
Jobless Claims Consensus Forecast for 9/14/13: 341,000
Range: 320,000 to 355,000
The U.S. current account deficit for the first quarter came in at a smaller-than-expected $106.1 billion. This follows a fourth quarter gap of $102.3 billion, after annual revisions and reclassifications, was revised sharply lower from the initial reading of $110.4 billion. The deficit on goods & services narrowed slightly in the first quarter but was offset by a smaller surplus in the balance on income and a wider deficit on unilateral transfers.
Current account Consensus Forecast for Q2 13: -$96.7 billion
Range: -$103.8 billion to -$94.5 billion
Existing home sales in July jumped 6.5 percent to a 5.390 million annual rate. This followed a 1.6 percent dip the month before. For the latest month, sales gains swept all four Census regions with the percentage gain the strongest in the Northeast. Supply is coming into the market but supply relative to sales, given July's spike, was no better than flat, at 5.1 months which was unchanged from June and up only slightly from May's 5.0 months.
Existing home sales Consensus Forecast for August 13: 5.255 million-unit rate
Range: 5.100 to 5.400 million-unit rate
The general business conditions index of the Philadelphia Fed's Business Outlook Survey for August dropped to 9.3 versus July's 19.8. Details were mostly negative though new orders were modestly positive, at 5.3 though indicating slowing growth from 10.2 in July. But other readings month were disappointing, including a small monthly contraction for shipments and unfilled orders as well as a significant shortening in delivery times and a significant draw down in inventories both of which point to declining activity. Employment growth slowed, but was still slightly positive.
Philadelphia Fed survey Consensus Forecast for September 13: 10.0
Range: 6.0 to 16.6
The Conference Board's index of leading indicators spiked an outsized 0.6 percent in July, following no change in June. However, the July data have mixed elements. The biggest positives were once again readings on interest rates and credit activity. Building permits were also a positive as are unemployment claims. A big positive in July, one however that looks to reverse in the August report, is the stock market which was down significantly for the month. Another positive that turned lower, at least based on the latest consumer sentiment report, is the consumer expectations component. The coincident index was up 0.2 percent to indicate a respectable rate of ongoing economic growth.
Leading indicators Consensus Forecast for August 13: +0.6 percent
Range: +0.3 to +0.9 percent
Quadruple Witching
R. Mark Rogers is the author of The Complete Idiot’s Guide to Economic Indicators, Penguin Books.
Econoday Senior Writer Mark Pender contributed to this article.
|
