|
The employment report for August posted this past Friday and was tepid. The question is whether the numbers tipped the balance on whether the Fed starts to taper asset purchases with the upcoming September 18 FOMC policy decision.
 Equities posted notably healthy gains this past week. After the Labor Day holiday, stocks gained Tuesday as better-than-expected economic news outweighed concerns about possible military action in Syria. ISM manufacturing and also construction outlays topped expectations. Gains were notably strong Wednesday after the Federal Reserve’s Beige Book showed overall economic activity continues to expand, though at a slow pace. This was seen as leading the Fed to not be aggressive about tapering asset purchases. Also, automakers Ford and General Motors rose significantly after releasing August sales that beat forecasts. Equities posted notably healthy gains this past week. After the Labor Day holiday, stocks gained Tuesday as better-than-expected economic news outweighed concerns about possible military action in Syria. ISM manufacturing and also construction outlays topped expectations. Gains were notably strong Wednesday after the Federal Reserve’s Beige Book showed overall economic activity continues to expand, though at a slow pace. This was seen as leading the Fed to not be aggressive about tapering asset purchases. Also, automakers Ford and General Motors rose significantly after releasing August sales that beat forecasts.
 On Thursday, stocks advanced cautiously after jobless claims declined more than expected and the ISM nonmanufacturing index jumped. But many traders were on the sidelines waiting for Friday’s employment report. At week’s close, equities initially rallied after a sluggish employment report was seen as lending to continued Fed ease. Later in the day, stocks fell flat for the day on remarks at the G-20 summit by Russian President Vladimir Putin and U.S. President Barack Obama. Putin indicated that his country would help Syria if attacked but he did not say it would be direct military confrontation. Obama stated that global consensus was developing that the Syrian leadership must be held accountable for the use of chemical weapons. On Thursday, stocks advanced cautiously after jobless claims declined more than expected and the ISM nonmanufacturing index jumped. But many traders were on the sidelines waiting for Friday’s employment report. At week’s close, equities initially rallied after a sluggish employment report was seen as lending to continued Fed ease. Later in the day, stocks fell flat for the day on remarks at the G-20 summit by Russian President Vladimir Putin and U.S. President Barack Obama. Putin indicated that his country would help Syria if attacked but he did not say it would be direct military confrontation. Obama stated that global consensus was developing that the Syrian leadership must be held accountable for the use of chemical weapons.
Equities were up this past week. The Dow was up 0.8 percent; the S&P 500, up 1.4 percent; the Nasdaq, up 2.0 percent; the Russell 2000, up 1.8 percent; and the Wilshire 5000, up 1.4 percent.
For the year-to-date, major indexes are up as follows: the Dow, up 13.9 percent; the S&P 500, up 16.1 percent; the Nasdaq, up 21.2 percent; the Russell 2000, up 21.2 percent; and the Wilshire 5000, up 17.4 percent.
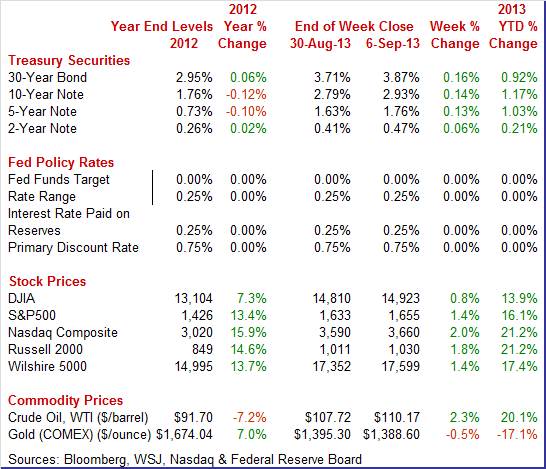
Weekly percent change column reflects percent changes for all components except interest rates. Interest rate changes are reflected in simple differences.
 Treasury yields ended the week higher. Rates headed up on Tuesday on strong economic news on manufacturing and construction. Bond traders took a different view on Wednesday compared to equity traders. Bond traders interpreted the Beige Book characterization of the economy—a “modest to moderate” pace of growth—as allowing the Fed to start to taper asset purchases. Treasury yields ended the week higher. Rates headed up on Tuesday on strong economic news on manufacturing and construction. Bond traders took a different view on Wednesday compared to equity traders. Bond traders interpreted the Beige Book characterization of the economy—a “modest to moderate” pace of growth—as allowing the Fed to start to taper asset purchases.
Rates rose again Thursday on lower-than-expected initial jobless claims. But on Friday yields declined on disappointing payroll numbers in the August employment situation and on flight to safety on worries about military action in Syria.
For this past week Treasury rates were mostly up as follows: the 2-year note, up 6 basis points; the 5-year note, up 13 basis points; the 7-year note, up 13 basis points; the 10-year note, up 14 basis points; and the 30-year bond, up 16 basis points. The 3-month T-bill was down 1 basis point.
 Oil prices swung this past week, on views on whether the U.S. will intervene in Syria and, if so, by what magnitude. On Tuesday, spot West Texas Intermediate rose moderately on comments by President Obama was seeking Congressional support for limited military action in Syria. But on Wednesday WTI fell more than a dollar a barrel after the Senate Foreign Relations Committee passed a resolution authorizing the “tailored use of military force. This is just one step in the approval of Congress for military intervention in Syria. Prices also dipped on concern that the Fed will soon be reducing stimulus. Oil prices swung this past week, on views on whether the U.S. will intervene in Syria and, if so, by what magnitude. On Tuesday, spot West Texas Intermediate rose moderately on comments by President Obama was seeking Congressional support for limited military action in Syria. But on Wednesday WTI fell more than a dollar a barrel after the Senate Foreign Relations Committee passed a resolution authorizing the “tailored use of military force. This is just one step in the approval of Congress for military intervention in Syria. Prices also dipped on concern that the Fed will soon be reducing stimulus.
On Thursday, the holiday-delayed EIA report on oil stockpiles indicated that inventories dropped to a low not seen in a year and half, boosting WTI by just over a dollar a barrel. Crude ended the week up almost $2 a barrel on remarks by Russian President Putin that his country would support Syria if the U.S. intervenes militarily. Support would likely be in terms of providing supplies. Nonetheless, his comments raised worries about whether military intervention in Syria would spread and disrupt oil flows.
Net for the week, the spot price for West Texas Intermediate gained $2.45 per barrel to settle at $110.17.
Once again, economic news was mixed this past week. Notably sluggish were payroll jobs.
 There was conflicting information between payroll survey headlines and household survey headlines. Payroll jobs were slow while the unemployment rate dipped—and revisions were significant. There was conflicting information between payroll survey headlines and household survey headlines. Payroll jobs were slow while the unemployment rate dipped—and revisions were significant.
The August payroll jobs figure came in near expectations but the biggest news was downward revisions. Total payroll jobs in August gained 169,000, following a revised increase of 104,000 for July (originally up 162,000) and after a revised advance of 172,000 for June (previous estimate was 188,000). The market median forecast was for a 175,000 gain for August. The net revisions for June and July were down 74,000.
 Private payrolls rose 152,000, following a gain of 127,000 in July (originally 161,000). Analysts projected a 178,000 boost. Private payrolls rose 152,000, following a gain of 127,000 in July (originally 161,000). Analysts projected a 178,000 boost.
Private service-providing jobs gained 134,000 after a 144,000 increase in July. The August advance was led by retail trade (up 44,000), health care (up 33,000), professional & business services (up 23,000), and food services & drinking places (up 21,000).
Goods-producing jobs rebounded 18,000 in August after declining 17,000 the month before. Manufacturing gained 14,000 in August after falling 16,000 in July. Construction was flat after dipping 3,000. Mining rose 3,000 in each of the two latest months.
Government jobs rebounded 17,000 in August after dropping 23,000 in July. Given that the rebound was in local government education, it may have been due to seasonal adjustment issues from teacher hiring or lack of firing.
Wage growth improved. Average hourly earnings rose 0.2 percent in August after no change the month before. Expectations were for a 0.2 percent gain. The average workweek was up slightly to 34.5 hours from 34.4 hours in July. Analysts forecast 34.5 hours.
The unemployment rate dipped to 7.3 percent from 7.4 percent in July. Expectations were for a 7.4 percent unemployment rate. Despite the unemployment rate being the lowest since December 2008, the details were not pretty. The unemployment rate fell for the wrong reason. Turning to detail for the household survey, household employment in August fell 115,000 after  jumping 227,000 in July. The labor force dropped 312,000, following a 37,000 dip in July. The number of unemployed declined 198,000 after a drop of 263,000 in July. Essentially, declining labor force participation is at least partly behind the easing in the unemployment rate. The soft labor market has led to a greater number of discouraged workers. jumping 227,000 in July. The labor force dropped 312,000, following a 37,000 dip in July. The number of unemployed declined 198,000 after a drop of 263,000 in July. Essentially, declining labor force participation is at least partly behind the easing in the unemployment rate. The soft labor market has led to a greater number of discouraged workers.
However, there were some clear positives. Looking ahead to the personal income report, private aggregate weekly earnings rose a sizeable 0.6 percent in August, pointing to a significant gain in private wages & salaries. Production worker hours in manufacturing were up 0.5 percent for the month, suggesting a healthy manufacturing component for August industrial production.
The August employment report was mixed. But the downward revisions to July and June payroll numbers will have the doves within the Fed arguing for continued asset purchases or at least very minimal tapering.
 Despite sluggish employment growth and oscillating confidence, consumers have been more than just test driving autos, they've picking up new keys. Unit new motor vehicle sales rose a very solid 1.8 percent in August to a 16.1 million annual rate for the best showing of the recovery going back to November 2007. Despite sluggish employment growth and oscillating confidence, consumers have been more than just test driving autos, they've picking up new keys. Unit new motor vehicle sales rose a very solid 1.8 percent in August to a 16.1 million annual rate for the best showing of the recovery going back to November 2007.
Auto loan rates are a little above the recovery low early in 2013. But car loan rates have firmed only slightly as Fed taper concerns have been affecting longer rates more. Fed policy rates are expected to remain low for some time even after the end of Fed asset purchases. Auto rates have even eased a little in recent weeks with a typical 60-month new car rate at about 2.5 percent versus 2.7 percent a month ago.
August's gain was led by domestic light trucks but also included a solid gain for import cars. North American-made vehicles came in at a 12.6 million annual rate for a 2.1 percent gain on the month. Foreign-made vehicles rose 0.8 percent to a 3.5 million annual rate. The latest motor vehicle data point squarely to a sizable monthly gain for motor vehicles in the retail sales report, a component that fell sharply in July after rising sharply in the three prior months.
The Fed's Beige Book retained the characterization of the economy from the one released July 17. Economic activity continued to increase at a "modest to moderate pace" since the previous survey.
Consumer spending rose in most Districts, reflecting, in part, strong demand for automobiles and housing-related goods. Many Districts noted strong demand for home furnishing and home improvement items. However, reports from several Districts indicated that consumers remain cautious in their purchases and highly price-sensitive.
Manufacturing activity expanded modestly. In general, contacts in most Districts expressed optimism about a near-term pickup in overall manufacturing activity. Residential real estate activity increased moderately in most Districts. Reports from several Districts suggested that rising home prices and mortgage interest rates may have spurred a pickup in recent market activity. Demand for nonresidential real estate gained overall.
With the Fed focus on the labor market, the Beige Book stated that for most occupations and industries, hiring held steady or increased modestly relative to the prior reporting period. Hiring increased for selected services occupations. Increases in demand for information technology workers were widespread. Wage pressures remained modest overall. Upward price pressures were subdued, and price increases were limited during the reporting period.
Overall, the latest Beige Book leaves the door open for the possible start of tapering with the September 18 policy decision.
There definitely are mixed signals from the manufacturing sector in August. Production worker hours are up and ISM manufacturing improved, but the Markit PMI eased.
Manufacturing growth slowed the last two weeks of August based on the final PMI from Markit Economics which slipped to 53.1 from 53.9 for the mid-month flash reading. The index came in at 53.7 in July. Any reading over 50 indicates monthly growth and the implied reading for the last two weeks points to a low 52 pace.
Growth in new orders was strong but at 55.7 versus the flash 56.5 at mid-month, was a bit less strong than earlier in the month. Output, at 52.5, also slowed from mid-month. Otherwise, details show very little change with export orders up slightly, employment up moderately, and backlog orders contracting slightly. Essentially, the strongest portion of the Markit report was new orders. Components show soft growth for August but improving growth afterwards.
 The ISM manufacturing report for August was somewhat more robust for a second month with the index at 55.7 in August which was even stronger than the 55.4 surge in July. Production, at 62.4 versus July's enormous jump to 65.0, is also extremely strong for a second month. The ISM manufacturing report for August was somewhat more robust for a second month with the index at 55.7 in August which was even stronger than the 55.4 surge in July. Production, at 62.4 versus July's enormous jump to 65.0, is also extremely strong for a second month.
But it appears there is even more strength ahead. The real eye popper is new orders which were at 63.2, up 4.9 points from July when the index surged 6.4 points. The level is the first 60 reading in nearly 2-1/2 years. New export orders at 55.5 were also a big highlight, one that points to improvement in foreign economies.
 The trade deficit worsened in July but remained relatively low after an especially good June number. The trade gap widened to $39.1 billion from $34.4 billion in June. Exports dipped 0.6 percent, following a 2.2 percent gain in June. Imports rose 1.6 percent in July after a 2.2 percent decline the month before. The trade deficit worsened in July but remained relatively low after an especially good June number. The trade gap widened to $39.1 billion from $34.4 billion in June. Exports dipped 0.6 percent, following a 2.2 percent gain in June. Imports rose 1.6 percent in July after a 2.2 percent decline the month before.
 The worsening in the trade gap was primarily due to the nonpetroleum goods deficit which grew to $38.7 billion in July from $35.0 billion in June. The petroleum deficit increased to $18.7 billion from $17.5 billion in June. The services surplus slipped to $19.4 billion from $19.5 billion. The worsening in the trade gap was primarily due to the nonpetroleum goods deficit which grew to $38.7 billion in July from $35.0 billion in June. The petroleum deficit increased to $18.7 billion from $17.5 billion in June. The services surplus slipped to $19.4 billion from $19.5 billion.
The dip in merchandise exports was led by capital goods excluding autos (down $1.6 billion) and consumer goods (down $1.4 billion). Automotive was down $0.2 billion. Gains were seen in industrial supplies (up $1.7 billion) and in food, feeds & beverages (up $0.4 billion).
Most import categories of merchandise showed improvement in July but generally followed weakness in June. Increases were seen in food, feeds & beverages (up $0.1 billion), industrial supplies (up $2.0 billion with $1.4 billion in crude oil), automotive (up $0.8 billion), and consumer goods (up $0.8 billion). Capital goods excluding autos dipped $0.3 billion.
In the merchandise import categories, the only notable net gain of the last two months was for autos. In contrast, over the last two months imports were down the most for consumer goods.
The trade deficit remains relatively low partly due to sluggish import demand. Exports also are soft due to modest global growth. Taking into account averages, it appears that U.S. businesses still are not hugely optimistic about demand.
 Construction in July was stronger than expected. Construction spending jumped 0.6 percent after an upwardly revised no change for June (originally down 0.6 percent). Expectations were for a 0.3 percent rise in July. Construction in July was stronger than expected. Construction spending jumped 0.6 percent after an upwardly revised no change for June (originally down 0.6 percent). Expectations were for a 0.3 percent rise in July.
The July boost was led by a 1.3 percent gain in private nonresidential outlays, following a 0.9 percent decline in June. Private residential spending continued an uptrend, rising 0.6 percent in July after an advance of 0.4 percent the month before. Public outlays dipped 0.3 percent after a 0.3 percent increase in June.
On a year-ago basis, construction was up 5.2 percent in July, compared to 4.7 percent the prior month. The construction sector appears to have regained some momentum in July.
 The recovery may be gaining traction in the third quarter, according to the latest ISM non-manufacturing report. This report’s composite index hit a recovery high in August at 58.6, compared to a still very healthy 56.0 the month before. August’s figure is the highest reading since December 2005. The recovery may be gaining traction in the third quarter, according to the latest ISM non-manufacturing report. This report’s composite index hit a recovery high in August at 58.6, compared to a still very healthy 56.0 the month before. August’s figure is the highest reading since December 2005.
The new orders index, at 60.5 versus 57.7 in July, was a standout strength in the report and points to rising activity going into the fourth quarter and the holidays. Business activity is already very strong at 62.2.
The ISM's non-manufacturing sample is enjoying unusually strong conditions and offers an indication of increasing steam for the economy as well as for the jobs market.
The labor market is still sluggish. This is the key concern of the Fed currently. Other indicators are mixed although there are signs of improvement in manufacturing and construction. Given the soft employment report, odds are it will be “taper lite” in the FOMC statement on September 18 with more than usual guidance. During a speech Friday, Kansas City Fed president Esther George “only” called for a $15 billion reduction in monthly asset purchases initially. No one on the FOMC is calling for an increase in policy rates soon.
This week’s focus is on the consumer sector. With employment sluggish, the key question is whether consumer spending can hold up. The highlight will be Friday’s retail sales report. Later Friday, consumer sentiment hits the wires. Earlier in the week, we get to see if consumers are taking on debt with the consumer credit report. Consumers have been asking for credit for autos but have been keeping their credit cards in their wallets for everything else.
Consumer credit outstanding in June slowed to a gain of versus May's revised $17.5 billion. Revolving credit, which had jumped a revised $6.4 billion in May, contracted $2.7 billion. Revolving credit has been up and down for the whole recovery, reflecting consumer caution and tight lending standards. Non-revolving credit jumped $16.5 billion in June for one of the largest gains of the recovery and one of the largest in the 70-year history of the series. The gain reflected strong car sales but also continued growth in student loans. Note that growth in student loans reflects ongoing government acquisition of student loans from private lenders and does not necessarily reflect current student borrowing.
Consumer credit Consensus Forecast for July 13: +$12.3 billion
Range: +$10.0 billion to +$18.8 billion
The NFIB Small Business Optimism Index for July continued to improve, up 6 tenths to 94.1 for the fourth highest reading of the recovery. Job readings showed slight improvement. Sales and earnings expectations also show improvement. The report noted that credit is a "non-issue" for small businesses. Business investment plans were mixed and inflation readings were flat.
NFIB Small Business Optimism Index Consensus Forecast for August 13: 95.0
Range: 93.5 to 95.5
The Labor Department’s Job Openings and Labor Turnover Survey showed job openings in June were flat based on the latest JOLTS (BLS’s Job Openings and Turnover Survey). Openings rose but only very slightly to 3.936 million versus a revised 3.907 million in May. The job openings rate was unchanged at 2.8 percent. There were somewhat positive readings including the separations rate, down 2 tenths to 3.0 percent, and the layoff rate, also down 2 tenths to 1.1 percent. The quit rate was unchanged at 1.6 percent. On the negative side was the hiring rate, down 2 tenths to 3.1 percent.
JOLTS job openings Consensus Forecast for July 13: 3.9275 million
Range: 3.870 million to 3.950 million
Wholesale inventories fell 0.2 percent in June as sales rose 0.4 percent, lowering the inventory-to-sales ratio from 1.18 in May to 1.17 for the leanest reading since April last year. Wholesale inventories of metals and of farm products showed sustained contraction as did inventories of apparel with sales for all these categories mixed. Inventories of autos in the wholesale sector, in what in this case reflects strong sales, were down for a second month.
Wholesale inventories Consensus Forecast for July 13: +0.3 percent
Range: -0.6 to +0.5 percent
Initial jobless claims fell 9,000 in the August 31 week to a 323,000 level that is very near a recovery low. Initial claims in the prior week were revised slightly higher to 332,000. The 4-week average was at a recovery low, down 3,000 to 328,500 from a revised 331,500 in the prior week. The average has been trending about 10,000 lower from July levels which points to monthly improvement in the jobs market.
Jobless Claims Consensus Forecast for 9/7/13: 330,000
Range: 325,000 to 335,000
Import prices were soft in July, rising only 0.2 percent after a drop of 0.4 percent the month before. There was a petroleum effect for import prices, at plus 3.2 percent, but it failed to lift overall prices much at all. Excluding petroleum, which is a key reading watched by policy makers, import prices fell 0.5 percent in what may add concern among the Federal Reserve doves that inflation is too low. Export prices slipped 0.1 percent in each of the latest two months. Year-on-year, total import prices were up only 1.0 percent. Export prices tell the same story with the year-on-year rate at plus 0.4 percent.
Import prices Consensus Forecast for August 13: +0.5 percent
Range: -0.2 to +1.2 percent
Export prices Consensus Forecast for August 13: +0.1 percent
Range: -0.1 to +0.4 percent
The U.S. Treasury monthly budget report for July showed a sizable deficit of $97.6 billion. However, the deficit is a shrinking problem for the US government where the year-to-date total, 10 months into the fiscal year, was down 38 percent from a year ago. Year-to-date receipts were up 13.9 percent to a record level of $2.29 trillion led by a 17.5 percent increase in individual taxes and by a 16.6 percent increase in the much smaller component of corporate taxes. Outlays were also lower, down 2.9 percent year-to-date led by a 6.2 percent decline in defense spending and including a 2.8 percent decline in net interest payments. The total deficit so far in fiscal 2013 was $607.4 billion versus $973.8 billion this time last year. Looking ahead, the month of August typically shows a deficit for the month. Over the past 10 years, the average deficit for the month of August has been $98.1 billion and $126.1 billion over the past 5 years. The August 2012 deficit came in at $190.5 billion. The August 2012 deficit was sharp due to technical calendar adjustments.
No consensus numbers are available for this month’s report
The producer price index for July came in much softer than expected—largely due to a surprise drop in energy costs. The July producer price index was unchanged after jumping 0.8 percent in June. The core rate, which excludes both food and energy, posted at 0.1 percent, compared to 0.2 percent in June. Food prices were flat in July, following a 0.2 percent rise the month before. Energy dipped 0.2 percent, following a surge of 2.9 percent in June. Weakness in energy was led by a 3.9 percent drop in residential gas. Gasoline prices decreased 0.8 percent after spiking 7.2 percent the prior month. The July advance for the core index was led by prices for pharmaceutical preparations, which rose 1.0 percent. Increases in the indexes for light motor trucks and for communication and related equipment also contributed to higher finished core prices. Weakness was seen in passenger cars which fell 1.1 percent.
PPI Consensus Forecast for August 13: +0.2 percent
Range: -0.2 to +0.6 percent
PPI ex food & energy Consensus Forecast for August 13: +0.1 percent
Range: 0.0 to +0.3 percent
Retail sales improved in July even after discounting for the impact of higher gasoline prices for the month. Retail sales rose 0.2 percent in July after an upwardly revised 0.6 percent. As expected, autos were weak with a 1.0 decline after a 2.9 percent boost in June. The level of motor vehicle sales was still healthy. Retail sales excluding autos rose 0.5 percent after a 0.1 percent rise in June. Gasoline sales were up a significant 0.9 percent, following a 0.6 percent rise in June. The core showed solid improvement after a questionable June. Excluding both autos and gasoline components, sales gained 0.4 percent after no change in June. More recently, unit new motor vehicle sales in August were up 1.8 percent, suggesting a notable gain in the auto component of retail sales.
Retail sales Consensus Forecast for August 13: +0.5 percent
Range: +0.2 to +0.7 percent
Retail sales excluding motor vehicles Consensus Forecast for August 13: +0.3 percent
Range: +0.1 to +0.7 percent
Less motor vehicles & gasoline Consensus Forecast for August 13: +0.3 percent
Range: +0.2 to +0.6 percent
The Reuters/University of Michigan's consumer sentiment index picked up the last two weeks of August, helping to lift the consumer sentiment index from 80.0 at mid-month to 82.1. Though the final reading is still 3 points shy of July's 85.1, the implied reading for the last two weeks of the report is in the low 84 area which points to little change in what may be a good sign for momentum going into September. The current conditions component rose 4.2 points to 95.2 with the implied reading for the last two weeks near 99 which is little changed from July's 98.6. Also up was the expectations component, to 73.7 for a 1.2 point gain from mid-month and versus 76.5 in July. This reading, which hinges on expectations of future income, has been steady in the mid-70s area since moving up from the high 60s in April.
Consumer sentiment index Consensus Forecast for preliminary August 13: 82.0
Range: 80.5 to 85.0
Business inventories were flat in June even as sales inched 0.2 percent higher. The inventory-to-sales ratio was unchanged at 1.29. Cautious inventory management points to limited expectations for future sales. Retail inventories rose 0.1 percent which was far under a 0.8 percent rise in sales, driving down the inventory-to-sales ratio for the retail sector from 1.41 to 1.40. More recently, factory inventories for July rose 0.2 percent.
Business inventories Consensus Forecast for July 13: +0.3 percent
Range: +0.1 to +0.4 percent
R. Mark Rogers is the author of The Complete Idiot’s Guide to Economic Indicators, Penguin Books.
Econoday Senior Writer Mark Pender contributed to this article.
|
