|
Politics on foreign issues topped worries about Fed taper—notably on whether the U.S. will take military action against Syria on the apparent use of chemical weapons.
 Stocks were down this week, primarily on worries about U.S. military intervention in Syria and continued concern about Fed tapering. Equities declined Monday on remarks by Secretary of State John Kerry that Syria should be held accountable for use of chemical weapons. Earlier in the day, a sharp drop in durables orders supported stocks on belief that Fed ease would continue. Equities fell sharply Tuesday as it then appeared an international coalition was forming for military intervention in Syria. The coalition seemed to include Britain, based on official remarks. Equities also got downdraft from federal debt ceiling concerns after the Treasury estimated the debt ceiling will be hit in mid-October. Stocks were down despite improvement in consumer confidence, regional manufacturing, and house prices. Stocks were down this week, primarily on worries about U.S. military intervention in Syria and continued concern about Fed tapering. Equities declined Monday on remarks by Secretary of State John Kerry that Syria should be held accountable for use of chemical weapons. Earlier in the day, a sharp drop in durables orders supported stocks on belief that Fed ease would continue. Equities fell sharply Tuesday as it then appeared an international coalition was forming for military intervention in Syria. The coalition seemed to include Britain, based on official remarks. Equities also got downdraft from federal debt ceiling concerns after the Treasury estimated the debt ceiling will be hit in mid-October. Stocks were down despite improvement in consumer confidence, regional manufacturing, and house prices.
 At mid-week, equities partially rebounded basically on the belief that stocks had been oversold. Also, the energy sector pulled indexes up on nervousness about the Middle East. Economic news took the spotlight on Thursday when stocks advanced for a second straight day following a positive revision to second quarter gross domestic product and jobless claims once again declined. Also acting as a positive for the markets was that the threat of military strikes against Syria appeared less immediate. The U.K. stated that it was waiting on a United Nations report before getting on board for intervention. At mid-week, equities partially rebounded basically on the belief that stocks had been oversold. Also, the energy sector pulled indexes up on nervousness about the Middle East. Economic news took the spotlight on Thursday when stocks advanced for a second straight day following a positive revision to second quarter gross domestic product and jobless claims once again declined. Also acting as a positive for the markets was that the threat of military strikes against Syria appeared less immediate. The U.K. stated that it was waiting on a United Nations report before getting on board for intervention.
Stocks declined Friday as Britain’s parliament voted against joining a U.S. led coalition for military intervention in Syria but also as U.S. Secretary of State John Kerry spoke on the evidence of chemical strikes by Syria on its citizens. Economic news was mixed for the day with personal income soft but consumer sentiment up.
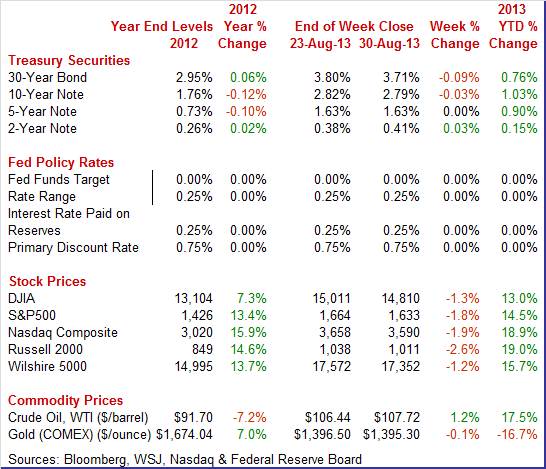
 Equities were down this past week. The Dow was down 1.3 percent; the S&P 500, down 1.8 percent; the Nasdaq, down 1.9 percent; the Russell 2000, down 2.6 percent; and the Wilshire 5000, down 1.9 percent. Equities were down this past week. The Dow was down 1.3 percent; the S&P 500, down 1.8 percent; the Nasdaq, down 1.9 percent; the Russell 2000, down 2.6 percent; and the Wilshire 5000, down 1.9 percent.
Equities were down in August due to worries about the possibility of the Fed cutting back on asset purchases. The Dow was down 5.4 percent; the S&P 500, down 4.5 percent; the Nasdaq, down 2.7 percent; the Russell 2000, down 4.4 percent; and the Wilshire 5000, down 4.6 percent.
For the year-to-date, major indexes are up as follows: the Dow, up 13.0 percent; the S&P 500, up 14.5 percent; the Nasdaq, up 18.9 percent; the Russell 2000, up 19.0 percent; and the Wilshire 5000, up 15.7 percent.
Weekly percent change column reflects percent changes for all components except interest rates. Interest rate changes are reflected in simple differences.
 Treasury yields ended the week mixed with flight to safety over Middle East concerns offset by ongoing worries about Fed tapering. Treasury yields ended the week mixed with flight to safety over Middle East concerns offset by ongoing worries about Fed tapering.
Adding to lower yields on Monday was the sharp drop in durables orders. There was a partial rebound in rates Wednesday on weak auction results. Rates were mixed and little changed Thursday and Friday. For the week, long rates dipped on the view that Fed tapering might be very gradual.
Nonetheless, long rates are still up in recent weeks on Fed tapering concerns.
For this past week Treasury rates were mixed as follows: 3-month T-bill, unchanged; the 2-year note, up 3 basis points; the 5-year note, unchanged; the 7-year note, unchanged; the 10-year note, down 3 basis points; and the 30-year bond, down 9 basis points.
 Oil prices rose moderately this past week with two crosscurrents. Worries about military intervention in Syria provided uplift while Fed tapering concerns provided downdraft. Oil prices rose moderately this past week with two crosscurrents. Worries about military intervention in Syria provided uplift while Fed tapering concerns provided downdraft.
The spot price of West Texas Intermediate hit a two-year high on Wednesday before easing the last two trading days of the week.
Net for the week, the spot price for West Texas Intermediate firmed $1.28 per barrel to settle at $107.72.
Economic news this past week was mixed and with sector directions uncertain.
 It is in the rear view mirror now but the second quarter was a little healthier than earlier believed. Real GDP growth for the second quarter was raised to an annualized rate of 2.5 percent compared to the initial estimate of 1.7 percent and compared to a first quarter rise of 1.1 percent. It is in the rear view mirror now but the second quarter was a little healthier than earlier believed. Real GDP growth for the second quarter was raised to an annualized rate of 2.5 percent compared to the initial estimate of 1.7 percent and compared to a first quarter rise of 1.1 percent.
Final sales of domestic product showed a revised gain of 1.9 percent versus the advance estimate of 1.3 percent. This series increased 0.2 percent in the first quarter. Final sales to domestic producers (which exclude net exports) were nudged down to 1.9 percent versus the initial estimate of 2.0 percent. This followed a 0.5 percent gain in the first quarter.
The upward revision to GDP growth was mainly due to a sharp upward revision to net exports. Also, there were improvements to inventories and nonresidential structures investment. Government purchases were modestly weaker. Other components were little changed.
Headline inflation for the GDP price index was revised up to 0.8 percent compared to the advance estimate of a 0.7 percent annualized inflation rate. When excluding food and energy, inflation for the second quarter was unrevised at 1.1 percent.
Overall, GDP growth for the second quarter was better than earlier believed. Compared to past recoveries, the latest growth rates are not inspiring but the upward revision may add to Fed debate to gradually start to taper asset purchases—other than the fact that more recent data have been mostly soft.
 The third quarter is having a bumpy start as both personal income and personal spending were near flat. Personal income inched up 0.1 percent in July after gaining 0.3 percent the month before. However, the wages & salaries component was notably weak, declining 0.3 percent after an increase of 0.4 percent in June. The third quarter is having a bumpy start as both personal income and personal spending were near flat. Personal income inched up 0.1 percent in July after gaining 0.3 percent the month before. However, the wages & salaries component was notably weak, declining 0.3 percent after an increase of 0.4 percent in June.
Strength was in the dividend and rental income components. Odds are that dividend income will be down in August, given the monthly swoon in equities.
Consumer spending slowed sharply to a 0.1 percent rise in July but followed a strong 0.6 percent boost the month before. July posted lower than market expectations for a 0.3 percent increase. Weakness was led by a 0.2 percent dip in durables, following a 0.9 percent jump the prior month. Services were unchanged after a 0.3 percent advance in June. Strength was in nondurables, up 0.9 percent after a 1.2 percent spike in June.
Inflation was not as much of a factor supporting nominal spending. Real spending was only slightly lower than nominal but still was flat. Real spending in July was unchanged after a 0.2 percent rise in June. The July figure is not a good start for third quarter GDP estimates.
Headline inflation eased notably to a 0.1 percent rise in July from a 0.4 percent jump in June. The core inflation rate slowed to a 0.1 percent increase from 0.2 in June.
Little to no progress was seen in PCE inflation getting to the Fed’s goal of 2 percent. Year-on-year, headline prices were up 1.4 percent in July versus 1.3 percent in June. The core held steady at 1.2 percent compared to June.
Measures of the consumer mood have been mixed with two traditional measures up and a more recent one down.
 The Conference Board’s composite headline index for August showed a slight increase, to 81.5 this month from July's revised 81.0, but there was a little bit of weakness in the present situation component which was down to 70.7 from 73.6 which hints at general weakness for August's run of economic indicators. The Conference Board’s composite headline index for August showed a slight increase, to 81.5 this month from July's revised 81.0, but there was a little bit of weakness in the present situation component which was down to 70.7 from 73.6 which hints at general weakness for August's run of economic indicators.
On the plus side, the expectations component is up, to 88.7 for a 2.7 point gain. A very big plus here is the consumer's outlook on income which, after sliding at the beginning of the year in reaction to the hike in payroll taxes, is now at a 2-1/2 year high. The consumer's outlook on business conditions and the jobs market is also up.
Turning to the Reuters/University of Michigan index, the consumer's assessment of economic conditions picked up the last two weeks of August, helping to lift the consumer sentiment index from 80.0 at mid-month to 82.1. Though the final reading is still 3 points shy of July's 85.1, the implied reading for the last two weeks of the report is in the low 84 area which points to little change in what may be a good sign for momentum going into September.
The current conditions component rose 4.2 points to 95.2 with the implied reading for the last two weeks near 99 which is little changed from July's 98.6. Also up was the expectations component, to 73.7 for a 1.2 point gain from mid-month and versus 76.5 in July. This reading, which hinges on expectations of future income, has been steady in the mid-70s area since moving up from the high 60s in April.
 In contrast, according to a Bloomberg weekly survey, consumer confidence continued a precipitous drop this past week, with the Bloomberg consumer comfort index falling to its worst level since early April—snapping a 19-week rally with a sharp retreat from what had been a more than five-and-a-half-year high just three weeks ago. In contrast, according to a Bloomberg weekly survey, consumer confidence continued a precipitous drop this past week, with the Bloomberg consumer comfort index falling to its worst level since early April—snapping a 19-week rally with a sharp retreat from what had been a more than five-and-a-half-year high just three weeks ago.
The CCI fell to minus 31.7 on its scale of minus 100 to plus 100 after holding in the minus 20s, its recovery zone, for 10 weeks straight and 17 out of the last 19. It has lost 8.2 points since the first week of August; a drop this steep has occurred only 41 times previously in more than 27 years of continuous polling. The CCI is based on Americans’ ratings of the national economy, the buying climate and their personal finances.
 Higher mortgage rates and higher prices are now cutting into sales of existing homes—but not dramatically. The pending home sales index, which offers an early signal on final sales of existing homes, was down 1.3 percent in the July report, following a 0.4 percent decline in June. Higher mortgage rates and higher prices are now cutting into sales of existing homes—but not dramatically. The pending home sales index, which offers an early signal on final sales of existing homes, was down 1.3 percent in the July report, following a 0.4 percent decline in June.
Weakness was concentrated in the two high-cost regions of the Northeast and the West. The National Association of Realtors, which compiles the report, notes that supply constraint is a special problem in the West. The two remaining regions, the Midwest and what is by far the largest housing region which is the South, show little change in the month.
 Somewhat higher mortgage rates may be a headwind to housing to an uncertain degree, but rising home prices indicate that the housing sector is still strengthening. Somewhat higher mortgage rates may be a headwind to housing to an uncertain degree, but rising home prices indicate that the housing sector is still strengthening.
Case-Shiller's 20-city adjusted index was up 0.9 percent in the June report versus an average monthly gain of 1.4 percent from January to May. But the year-on-year adjusted gain, at a very sizable 12.0 percent, was just off its best level of the recovery which was May at plus 12.2 percent.
 Manufacturing remains weak with aircraft orders swinging sharply down to drag down the headline number. But other durables orders were weak also. New factory orders for durables in July dropped a huge 7.3 percent after jumping 3.9 percent the month before. The transportation component fell a monthly 19.4 percent, following a spike of 11.7 percent in June. Excluding transportation, durables orders dipped 0.6 percent after a rise of 0.1 percent in June. Manufacturing remains weak with aircraft orders swinging sharply down to drag down the headline number. But other durables orders were weak also. New factory orders for durables in July dropped a huge 7.3 percent after jumping 3.9 percent the month before. The transportation component fell a monthly 19.4 percent, following a spike of 11.7 percent in June. Excluding transportation, durables orders dipped 0.6 percent after a rise of 0.1 percent in June.
Within transportation, motor vehicles rose 0.5 percent, nondefense aircraft plunged 52.3 percent, and defense aircraft decreased 2.2 percent. Outside of transportation, gains were seen in fabricated metals and “other” durables. Declines occurred in computers & electronics and electrical equipment. Primary metals and machinery were flat.
Nondefense capital goods orders excluding aircraft fell 3.3 percent, following a 1.3 percent rise in June. Shipments for this series declined 1.5 percent, following a decrease of 0.8 percent the month before.
Durables orders are almost always volatile on the transportation component. But stripping out transportation, this sector is still soft in July. News is mixed for August based on regional surveys—some slowing and some improving.
Early indications for manufacturing in August continue to be mixed but at least with some positives compared to a very sluggish July.
 Texas factory activity increased but at a slower pace in August. The production index, a key measure of state manufacturing conditions, remained positive but fell from 11.4 to 7.3. Texas factory activity increased but at a slower pace in August. The production index, a key measure of state manufacturing conditions, remained positive but fell from 11.4 to 7.3.
Other measures of current manufacturing activity also indicated slower growth in August. The new orders index was positive for the fourth month in a row, although it moved down from 10.8 to 5.4. The shipments index also posted a fourth consecutive positive reading but slipped 6 points to 11.4. The capacity utilization index fell from 12.2 to 4.6.
 The Richmond Fed manufacturing survey was notably positive for August. Activity picked up strongly with the headline index at plus 14 versus July's minus 11. New orders showed a similar swing back into positive ground as did shipments. Employment was up, the workweek was up, and wages were up. One negative, however, was continued contraction in backlog orders. Inventory readings show slight accumulation while price readings show a slight easing. The Richmond Fed manufacturing survey was notably positive for August. Activity picked up strongly with the headline index at plus 14 versus July's minus 11. New orders showed a similar swing back into positive ground as did shipments. Employment was up, the workweek was up, and wages were up. One negative, however, was continued contraction in backlog orders. Inventory readings show slight accumulation while price readings show a slight easing.
Reports so far for August from other regions show slowing in the New York area, the Mid-Atlantic and in Texas but a bit better pace in the Kansas City area.
 August was a good month for businesses in Chicago where the composite headline index rose 7 tenths to 53.0 to show the best rate of monthly growth in general activity since May. New orders were especially strong, up more than 3 points to 57.2 for the best rate of monthly growth also since May. August was a good month for businesses in Chicago where the composite headline index rose 7 tenths to 53.0 to show the best rate of monthly growth in general activity since May. New orders were especially strong, up more than 3 points to 57.2 for the best rate of monthly growth also since May.
But outside new orders, details in the report indicate a little bit of softness including slightly slower rates of growth for production and employment. Inventories continue to contract while backlog orders show a third straight month of contraction, though at an easing rate.
Prices paid are on the hot side in this report, at 65.2 to indicate the greatest rate of monthly increase since November last year. This may reflect rising prices for fuel in line with the rise underway in oil. But it may also be a positive given concern among some policy makers that inflation is running too low.
Economic news continues to be mixed but net positive. However, the net positive is sluggish. The consumer and manufacturing sectors have been soft. Housing has been on the rise but is at risk from higher mortgage rates although only modestly higher rates. The latest inflation numbers leave the Fed plenty of room to maintain quantitative easing. The employment situation report out next week will be important for the Fed’s decision on whether to taper at its mid-September policy meeting. Given that a number of Fed officials want to start tapering, it looks like “taper lite” unless there is a really strong employment report.
The Fed is focusing on the labor market for deciding when and how fast to cut back on asset purchases. This week’s employment situation report will be key as it is the last employment report before the September 17-18 FOMC meeting. The strength of the consumer sector is updated with motor vehicle sales. Manufacturing has been wavering and early national news for August posts from Markit PMI and ISM.
U.S. Holiday: Labor Day. Bond, Equity Markets Closed
The Markit PMI manufacturing flash index for August hit a 5-month high of 53.9 for a 2 tenths gain from the final July reading and for a 7 tenths gain from the flash reading in July. The most important detail in the report—new orders--was decidedly positive, up 1.1 points to 56.5 in a reading that is well above breakeven 50 to indicate a very solid rate of monthly growth. New orders have been accelerating for 4 months now and are at their fastest rate of monthly growth since January. Export orders, at 52.0, also show monthly growth and offer some confirmation of improvement in foreign demand, underscored by surprising strength in flash PMIs for Europe and China.
Markit PMI manufacturing index (final) Consensus Forecast for August 13: 53.9
Range: 53.5 to 54.5
The composite index from the ISM manufacturing survey in July was up a striking 4.5 points to 55.4. This is the strongest reading in more than 2 years. New orders led the way, up nearly 6-1/2 points to 58.3. The production reading was also incredibly strong, up more than 11-1/2 points to 65.0 which is the strongest reading of the whole recovery.
ISM manufacturing composite index Consensus Forecast for August 13: 53.8
Range: 52.1 to 55.8
Construction spending eased in June with a 0.6 percent dip after a gain of 1.3 percent in May and an increase of 1.1 percent in April. The June decrease was led by a 1.1 percent decline in public outlays after a 0.1 percent rise in May. Also, private nonresidential spending decreased 0.9 percent, following a 0.6 percent boost in May. Private residential outlays were flat after a 2.8 percent jump the month before.
Construction spending Consensus Forecast for July 13: +0.3 percent
Range: -0.6 to +1.0 percent
Sales of total light motor vehicles slipped in July, down 1.8 percent, but were at still a very strong annual rate of 15.7 million. Also, the July dip followed a strong 4.2 percent boost in June. July sales of imports were steady at a 3.4 million rate with the monthly softness on the domestic side at a 12.2 million rate versus June's 12.6 million. The softness on the domestic side was split evenly between cars and light trucks.
Motor vehicle domestic sales Consensus Forecast for August 13: 12.3 million-unit rate
Range: 11.9 to 12.6 million-unit rate
Motor vehicle total sales Consensus Forecast for August 13: 15.8 million-unit rate
Range: 15.7 to 16.1 million-unit rate
The U.S. international trade gap, due to a drop in imports together with a rise in exports, made for a surprisingly narrow trade gap in June, at minus $34.2 billion versus a revised minus $44.1 billion in May. This was the lowest trade gap in more than 4 years. About two thirds of the improvement came from non-oil goods. The improvement in the trade gap was primarily due to the nonpetroleum goods deficit which shrank to $34.4 billion in June from $41.3 billion the prior month. The petroleum deficit narrowed to $17.4 billion from $20.8 billion in May. The services surplus improved to $18.9 billion from $18.8 billion. Though the drop in imports may be good for the trade balance, it does pose a negative signal for domestic demand. Imports of consumer goods showed the steepest drop followed by industrial supplies. But the rise in exports is a clearly positive signal, led by gains for industrial supplies and including strong gains for capital goods, boosted by aircraft, and also gains for consumer goods.
International trade balance Consensus Forecast for July 13: -$39.0 billion
Range: -$42.5 billion to -$35.0 billion
The Beige Book being prepared for the September 17-18 FOMC meeting is released in the afternoon. Markets will be watching for news on the strength of the recovery to decide if tapering is announced September 18 and if so, at what pace.
ADP private payroll employment sample reported a 200,000 rise in private payroll growth for July with June being upwardly revised to a 198,000 rise. The Labor Department’s later released number for July private payrolls posted at up 161,000 with June at 196,000.
ADP private payrolls Consensus Forecast for August 13: 177,000
Range: 150,000 to 225,000
Initial jobless claims in the August 24 week fell 6,000 to 331,000 versus a revised 337,000 in the prior week. The 4-week average rose slightly to 331,250, after a revised 330,500 in the prior week. But a comparison with the month-ago trend shows a roughly 10,000 decline.
Jobless Claims Consensus Forecast for 8/31/13: 330,000
Range: 325,000 to 335,000
Nonfarm business productivity in the second quarter rebounded an annualized 0.9 percent, following a decline of 1.7 percent in the first quarter. Unit labor costs rose 1.4 percent, following a 4.2 percent decline in the first quarter. Looking at component detail, output advanced to 2.6 percent from a 0.3 percent dip in the first quarter. Growth in hours worked bumped up to an annualized 1.7 percent, following 1.5 percent the prior period. Growth in compensation turned to a positive 2.3 percent from a negative 5.9 percent in the first quarter. Based on the latest upward revision to second quarter GDP (to 2.5 percent from the original estimate of 1.7 percent), productivity growth is likely to be revised up.
Nonfarm Business Productivity Consensus Forecast for revised Q2 13: +1.8 percent annual rate
Range: +1.1 to +2.7 percent annual rate
Unit Labor Costs Consensus Forecast for revised Q2 13: +0.7 percent annual rate
Range: -0.1 to +1.2 percent annual rate
Factory orders, up 1.5 percent, were solid in June though down from an especially strong May which was revised upward to 3.0 percent. But the gains were narrow and tied mostly to aircraft and some to autos, excluding which orders fell 0.4 percent. More recently, new factory orders for durables in July dropped a huge 7.3 percent after jumping 3.9 percent the month before.
Factory orders Consensus Forecast for July 13: -3.4 percent
Range: -4.5 to +0.6 percent
The composite index from the ISM non-manufacturing survey showed a surge in July that drove the composite index up a very substantial 3.8 points to 56.0 for the best reading since February. New orders, the key component in the report, rose nearly 7 points to 57.7 for its best reading since December. Business activity really took off, up more than 7-1/2 points to 60.4, also the best reading since December.
ISM non-manufacturing composite index Consensus Forecast for August 13: 55.0
Range: 54.0 to 57.5
Nonfarm payroll employment grew less than expected in July even though the unemployment rate came in lower than expected. Total payroll jobs in July increased 162,000 after gaining 188,000 in June and increasing 176,000 in May. The unemployment rate eased to 7.4 percent in July from 7.6 percent the month before. Turning back to payroll data, private payrolls increased 161,000 after rising 196,000 in June. Wage growth turned negative in July but followed a strong month before. Average hourly earnings slipped 0.1 percent in July after a 0.4 percent jump the prior month. The average workweek was 34.4 hours, down from 34.5 in June.
Nonfarm payrolls Consensus Forecast for August 13: 175,000
Range: 150,000 to 234,000
Private payrolls Consensus Forecast for August 13: 178,000
Range: 150,000 to 230,000
Unemployment rate Consensus Forecast for August 13: 7.4 percent
Range: 7.3 to 7.5 percent
Average workweek Consensus Forecast for August 13: 34.5 hours
Range: 34.3 to 34.5 hours
Average hourly earnings Consensus Forecast for August 13: +0.2 percent
Range: +0.1 to +0.4 percent
R. Mark Rogers is the author of The Complete Idiot’s Guide to Economic Indicators, Penguin Books.
Econoday Senior Writer Mark Pender contributed to this article.
|
