|
This past week had significant economic news from the Fed, on housing, and on manufacturing. But there was plenty of divergence in the news—not clarifying much on any of these.
 Equities ended the week mostly up with the Dow being a notable exception. Stocks swooned Monday on worries that Wednesday’s Fed FOMC minutes would indicate early tapering of quantitative easing. Financial stocks, weighing on the Dow, declined after The Wall Street Journal reported that JP Morgan could replace Bank of America as the US lender with the most legal troubles. Most stocks rebounded Tuesday but with the Dow continuing to slip. Earnings news from retailers led traders to temporarily forget about potential Fed tapering as favorable reports were posted by Best Buy, Urban Outfitters, TJX, Home Depot, and even net for J.C. Penney. Equities ended the week mostly up with the Dow being a notable exception. Stocks swooned Monday on worries that Wednesday’s Fed FOMC minutes would indicate early tapering of quantitative easing. Financial stocks, weighing on the Dow, declined after The Wall Street Journal reported that JP Morgan could replace Bank of America as the US lender with the most legal troubles. Most stocks rebounded Tuesday but with the Dow continuing to slip. Earnings news from retailers led traders to temporarily forget about potential Fed tapering as favorable reports were posted by Best Buy, Urban Outfitters, TJX, Home Depot, and even net for J.C. Penney.
 Stocks dropped Wednesday on Fed minutes of its July 30-31 policy meeting. However, there were significant swings during the afternoon as traders digested the news. According to the minutes, there is no timetable for cuts in quantitative easing. However, guidance still calls for reduced asset purchases if the recovery continues on track. Although the minutes technically were neutral, traders saw the minutes as pointing to a cutback of asset purchases as early as September. Stocks dropped Wednesday on Fed minutes of its July 30-31 policy meeting. However, there were significant swings during the afternoon as traders digested the news. According to the minutes, there is no timetable for cuts in quantitative easing. However, guidance still calls for reduced asset purchases if the recovery continues on track. Although the minutes technically were neutral, traders saw the minutes as pointing to a cutback of asset purchases as early as September.
Equities were up notably Thursday on economic news, including initial jobless claims, a jump in existing home sales, and from overseas—optimistic purchasing managers' reports in Europe and improved manufacturing in China. Stocks were up despite problems at the Nasdaq exchange where trading was halted for more than three hours due to computer problems. Stocks were up Friday despite an unexpected drop in new home sales. Traders appear to have liked the fact that no market moving FedSpeak had yet come out of the Fed’s internal conference in Jackson Hole, Wyoming.
Equities mostly were up this past week. The S&P 500 was up 0.5 percent; the Nasdaq, up 1.5 percent; the Russell 2000, up 1.4 percent; and the Wilshire 5000, up 0.7 percent. However, the Dow was down 0.5 percent;
For the year-to-date, major indexes are up as follows: the Dow, up 14.5 percent; the S&P 500, up 16.6 percent; the Nasdaq, up 21.1 percent; the Russell 2000, up 22.2 percent; and the Wilshire 5000, up 18.0 percent.
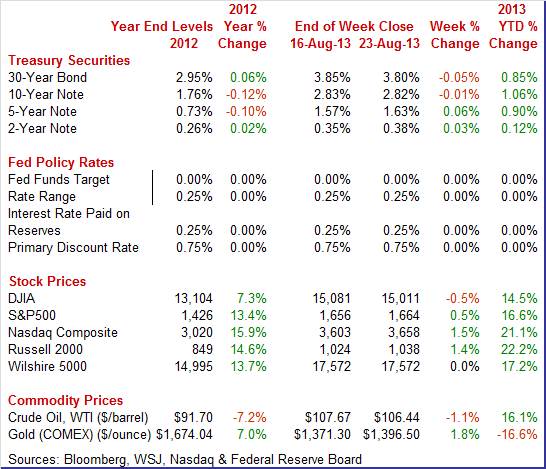
Weekly percent change column reflects percent changes for all components except interest rates. Interest rate changes are reflected in simple differences.
 Treasury yields were mixed this past week and little changed. Rates firmed Monday on little news and as traders awaited Fed minutes on Wednesday. Yields dipped Tuesday as traders took the view that potential Fed tapering would hurt currently weak emerging economies, leading to flight to safety. Treasury yields were mixed this past week and little changed. Rates firmed Monday on little news and as traders awaited Fed minutes on Wednesday. Yields dipped Tuesday as traders took the view that potential Fed tapering would hurt currently weak emerging economies, leading to flight to safety.
But on Wednesday, the FOMC minutes were seen as showing the Fed as being comfortable with beginning to taper its bond purchase programs. Rates were little changed Thursday despite somewhat strong economic news. Yields fell Friday after a very disappointing report on new home sales.
For this past week Treasury rates were mixed as follows: 3-month T-bill, down 2 basis points; the 2-year note, up 3 basis points; the 5-year note, up 6 basis points; the 7-year note, up 2 basis points; the 10-year note, down 1 basis point; and the 30-year bond, down 5 basis points.
 The spot price of crude eased this past week. Spot West Texas Intermediate slipped less than a dollar a barrel on news that the risk of a storm in the Gulf of Mexico had diminished. On Tuesday, traders anticipated the Fed minutes on Wednesday suggesting reduced stimulus in coming months, bumping crude down $2 a barrel. WTI fell another buck a barrel on Wednesday as traders saw the actual minutes as being supportive of tapering. The spot price of crude eased this past week. Spot West Texas Intermediate slipped less than a dollar a barrel on news that the risk of a storm in the Gulf of Mexico had diminished. On Tuesday, traders anticipated the Fed minutes on Wednesday suggesting reduced stimulus in coming months, bumping crude down $2 a barrel. WTI fell another buck a barrel on Wednesday as traders saw the actual minutes as being supportive of tapering.
On Thursday, good economic news was seen as favorable. Jobless claims improved over the most recent four weeks, leading indicators were up, and manufacturing data for the U.S., China and Europe improved. Curiously, at week’s close, bad news was good news as a sharp drop in new home sales was seen as lowering the odds of early tapering by the Fed or at least slowing the pace of tapering.
Net for the week, the spot price for West Texas Intermediate declined $1.23 per barrel to settle at $106.44.
The economy was a mixed bag this past week.
Based on the latest FOMC minutes, the Fed is cautious about cutting back on quantitative easing in the near term. But guidance still calls for reduced asset purchases if the recovery continues on track. The September decision is going to be data dependent. Low inflation is seen by some FOMC participants as reason for extending asset purchases.
Policy direction is under heavy debate within the Fed. The first questions are whether the labor market is improving enough and whether inflation is a concern. It appears that most FOMC participants see current inflation as low but diverge on whether quantitative easing raises medium term risks for inflation. Most FOMC participants see the labor market as improving but still sluggish.
Slow inflation seems to be as much of a concern as high unemployment.
“In addition to updating its description of the state of the economy, the Committee decided to underline its concern about recent shortfalls of inflation from its longer run goal by including in the statement an indication that it recognizes that inflation persistently below its 2 percent objective could pose risks to economic performance, while also noting that it continues to anticipate that inflation will move back toward its objective over the medium term.”
The minutes indicated that unwinding is likely to be gradual and that rate changes will be slow.
“Moreover, investors may have perceived that Committee communications about the possibility of slowing the pace of asset purchases also implied a higher probability of an earlier firming of the federal funds rate. Subsequent Federal Reserve communications, which emphasized that decisions about the two policy tools were distinct and underscored that a highly accommodative stance of monetary policy would remain appropriate for a considerable period after purchases are completed, were seen as having helped clarify the Committee's policy strategy.”
Prior to the next FOMC decision on September 18 (which includes forecasts), market focus will be on FedSpeak and the next employment situation report on September 6. In an interview at the Fed’s internal economics conference at Jackson Hole, Wyoming, St. Louis Fed President James Bullard said the questionable housing market (after the latest drop in new home sales was reported) may be a reason for delaying tapering.
 There were two very different reports on home sales in July. Existing home sales were up sharply while new home sales fell significantly. There were two very different reports on home sales in July. Existing home sales were up sharply while new home sales fell significantly.
"Panic" over rising rates is how the National Association of Realtors explains a big jump in existing home sales during July, to a 5.390 million annual rate. Sales gains swept all four Census regions with the percentage gain the strongest in the Northeast.
Supply is coming into the market but supply relative to sales, given July's spike, was no better than flat, at 5.1 months which was unchanged from June and up only slightly from May's 5.0 months.
Price concession was not behind the jump in sales with price readings steady compared to June. The median national price for an existing home was $213,500 for a 13.7 percent year-on-year gain which is nearly unchanged from June.
 The July report on new home sales was in stark contrast to the existing home sales report. The July report on new home sales was in stark contrast to the existing home sales report.
New home sales plunged a monthly 13.4 percent to a 394,000 annual rate in July and following a 3.6 percent rise in June. For a second month in a row, the report included major downward revisions to the two prior months totaling 62,000 in the latest report.
The 394,000 rate for July is the lowest since October 2012. Double-digit monthly declines hit three of four Census regions. A mid-single digit monthly decline hit the Northeast.
Supply on a monthly basis is now at 5.2 months versus 4.3 months in June. The number of new homes on the market increased in the month, to an adjusted 171,000 from June's 164,000. However, the months’ supply number is volatile, heavily dependent on monthly swings in the sales pace.
Prices data were not good in July—but those numbers also are volatile, depending in part on shifts in sales between low end and high end homes. The year-on-year median price gain, which had been in the double-digits as recently as May, is now at 8.3 percent for a 0.5 percent monthly decline to $257,200. This is the lowest median price since January.
 Housing data clearly were mixed this past week. But one indicator that suggests that the housing sector continues to mend was the FHFA house price index. This index for June gained 0.7 percent after rising 0.8 percent in May. The June HPI was the 17th consecutive monthly price increase in the purchase-only, seasonally adjusted index. Housing data clearly were mixed this past week. But one indicator that suggests that the housing sector continues to mend was the FHFA house price index. This index for June gained 0.7 percent after rising 0.8 percent in May. The June HPI was the 17th consecutive monthly price increase in the purchase-only, seasonally adjusted index.
The June boost was led by the East South Central region, increasing 1.6 percent. The weakest was the Middle Atlantic region which declined 0.6 percent. Six of nine Census regions showed gains in the latest month while three decreased.
The year-on-year rate for June stood at 7.7 percent, compared to 7.5 percent in May.
A key point is that the FHFA index is a repeat transactions measure, not affected by shifts in sales between low end and high end home sales. The healthy rise in prices suggests that housing is still improving, although the data are for June before July worries about Fed tapering gained traction.
The PMI flash index for August hit a 5-month high of 53.9 for a 2 tenths gain from the final July reading and for a 7 tenths gain from the flash reading in July.
The most important detail in the report—new orders--was decidedly positive, up 1.1 points to 56.5 in a reading that is well above breakeven 50 to indicate a very solid rate of monthly growth. New orders have been accelerating for 4 months now and are at their fastest rate of monthly growth since January. Export orders, at 52.0, also show monthly growth and offer some confirmation of improvement in foreign demand, underscored by surprising strength in flash PMIs for Europe and China.
The latest PMI report contrasts with last week's early August indications from the New York and Philly Feds which reported slowing growth this month in their regions. But this is a national report and will help build expectations for manufacturing gains in the month of August.
 Kansas City Fed District manufacturing activity improved further in August, and producers’ expectations also edged higher after easing last month. Price indexes rose modestly, with a continued increase in future finished goods prices. Kansas City Fed District manufacturing activity improved further in August, and producers’ expectations also edged higher after easing last month. Price indexes rose modestly, with a continued increase in future finished goods prices.
The month-over-month composite index was 8 in August, up from 6 in July and minus 5 in June. The composite index is an average of the production, new orders, employment, supplier delivery time, and raw materials inventory indexes.
Most other monthly indexes also improved. The production index remained solid at 21, and the new orders and order backlog indexes also rose moderately. The new orders for exports index edged higher from 2 to 4, and the employment index moved into positive territory for the first time in six months. The raw materials inventory index fell from 4 to 0, while the finished goods inventory index increased after falling last month.
Overall, the Kansas City report hints that manufacturing may be regaining some strength in August.
 According to the latest index of leading indicators, the recovery may be regaining momentum in coming months but the big question is whether July data were a head fake. According to the latest index of leading indicators, the recovery may be regaining momentum in coming months but the big question is whether July data were a head fake.
The index of leading economic indicators spiked an outsized 0.6 percent in July, following no change in June. However, the July data have mixed elements.
The biggest positives were once again readings on interest rates and credit activity. Building permits were also a positive as are unemployment claims. A big positive in July, one however that looks to reverse in the August report, was the stock market which has since turned decidedly lower. Another positive that has turned lower, at least based on the latest consumer sentiment report, is the consumer expectations component.
The coincident index was up 0.2 percent to indicate a respectable rate of ongoing economic growth.
This past week had mixed results on economic news and FedSpeak. The Fed’s FOMC minutes and FedSpeak at Jackson Hole added no clarity about when the Fed will begin to taper asset purchases. Existing home sales show an improving housing market as did FHFA house prices. But new home sales pointed in the other direction. Perhaps the existing home market is more attractive but recent NAHB surveys indicate that home builders are moderately optimistic. Manufacturing is showing modest signs of life in August led by the Markit PMI and Kansas City Fed. But other Fed manufacturing surveys have come in soft for August. Finally, the latest report on leading indicators was very favorable but more recent numbers for some components are negative. Overall, the latest economic news leaves quite a few questions about the strength of the economy. Growth still is positive but the question is by how much. The latest numbers suggest only modest growth in the near term.
Manufacturing has been wavering in recent months and the durables report will be important to see if there is any strength outside of aircraft. Last week’s sales numbers for existing and new homes were very contradictory and pending home sales may add some clarity on market strength. The second estimate for second quarter GDP posts Thursday and will indicate the strength of forward momentum coming out of that quarter. Finally, the personal income report at week’s close will add key information on the health of the consumer sector.
Durable goods orders in June surged 3.9 percent, following a 5.5 percent increase for May. The transportation component spiked 12.0 percent after a 15.1 percent jump in May. Excluding transportation, durables orders slipped 0.1 percent in June, following a 1.3 percent rise in May. Nondefense capital goods orders excluding aircraft declined 0.9 percent, following a 2.0 percent boost in May. Outside of aircraft, manufacturing appears to have been sluggish in June although following moderate strength in May. Numbers reflect revisions from the more recent total factory orders report.
New orders for durable goods Consensus Forecast for July 13: -4.0 percent
Range: -7.2 percent to +1.4 percent
New orders for durable goods, ex-trans., Consensus Forecast for July 13: +0.3 percent
Range: -0.5 percent to +1.5 percent
The Dallas Fed general business activity index for July slowed to plus 4.4 from June's 6.5 with production at 11.4 versus 17.1 in June. New orders slowed but remained moderately positive, posting at 10.8 in July, compared to 13.0 the month before.
Dallas Fed general business activity index Consensus Forecast for August 13: 4.5
Range: 3.5 to 8.5
The S&P/Case-Shiller 20-city home price index (SA) in May gained 1.0 percent, although quite strong was down from gains of 1.7 and 1.9 percent in the prior two months. May's data showed gains across 18 of 20 cities with modest declines in Minneapolis and Cleveland interrupting what had been sweeping gains across the 20 city sample going back to the beginning of the year. Year-on-year, prices showed a 12.1 percent gain in May which matches April's recovery high.
The S&P/Case-Shiller 20-city HPI (SA, m/m) Consensus Forecast for June 13: +1.0 percent
Range: +0.6 to +1.4 percent
The S&P/Case-Shiller 20-city HPI (NSA, y/y) Consensus Forecast for June 13: +12.2 percent
Range: +11.3 to +12.3 percent
The Conference Board's consumer confidence index for July raised the question of whether the consumer has a more optimistic view of the current labor market than official statistics. There was more good news than meets the eye with the consumer confidence report where a nearly 2 point dip to 80.3 masked a strong gain in the present situation component. The assessment of the present situation, up nearly 5 points to 73.6, offers the consumer's view of month-to-month conditions. Jobs hard to get, which is a closely watched month-to-month reading on the consumer's assessment of the current jobs market, fell to 35.5 percent for a sizable 1.6 percentage point decline from June which is very good news. However, the expectations component was down 6.4 points to 84.7 in a drop that reflects lack of confidence in the outlook for the jobs market, which of course is in contrast to the current assessment. Fewer consumers see job openings rising six months from now and more see job openings contracting.
Consumer confidence Consensus Forecast for August 13: 78.0
Range: 74.8 to 80.0
The Richmond Fed manufacturing index in July slid to minus 11 from June's plus 7. Both new orders and shipments showed substantial contraction, each at minus 15. Backlog orders and capacity utilization were both down while inventories of finished goods were up which, given the declines in other readings, was another likely indication of weakness.
Richmond Fed manufacturing index Consensus Forecast for August 13: 0
Range: -5 to 2
The pending home sales index for June was down 0.4 percent. However, this followed a robust 5.8 percent jump in May. This report tracks contract signings and the NAR notes that rising rates are making prospective buyers change their minds which helps explain why strength in this report for May did not translate to strength for existing home sales in June. Typically, about 80 percent of pending home sales become existing home sales within two months. Another factor hurting sales is a continued lack of supply on the market which, however, may begin to ease as prices rise. Also, atypically wet weather in June on the East Coast may have cut into contract signings as wet weather reduces traffic of pending buyers.
Pending home sales Consensus Forecast for July 13: -1.0 percent
Range: -2.0 to +5.3 percent
GDP growth for the second quarter topped expectations but partly due to first quarter GDP being revised down with annual revisions. GDP gained an annualized 1.7 percent, following a 1.1 percent rise in the first quarter. The prior estimate for the first quarter was 1.8 percent. Analysts had projected a 1.1 percent advance for second quarter GDP. Demand was soft in the second quarter but even softer than earlier believed in the first quarter. Final sales of domestic product posted at a gain of 1.3 percent versus the second quarter rise of 0.2 percent. Final sales to domestic producers (which exclude net exports) increased 2.0 percent after nudging up 0.5 percent in the first quarter. Overall inflation slowed in the second quarter. Headline inflation for the GDP price index rose an annualized 0.7 percent after a 1.3 percent increase in the first quarter. When excluding food and energy, inflation eased to 1.1 percent in the second quarter from 1.6 percent the prior quarter.
Real GDP Consensus Forecast for second estimate Q2 13: +2.2 percent annual rate
Range: +2.0 to +2.5 percent annual rate
GDP price index Consensus Forecast for second estimate Q2 13: +0.7 percent annual rate
Range: +0.7 to +0.8 percent annual rate
Initial jobless claims for the August 17 week rose 13,000 to 336,000. The prior week was revised 3,000 higher to 323,000. The latest week is also the sample week for the monthly payroll employment and a comparison shows no change with the July 13 week, which was the sample week for the July employment report. Leading the positive indications was the 4-week average which, despite the rise in the latest week, was down 2,250 to a 330,500 level that is decidedly below levels in July.
Jobless Claims Consensus Forecast for 8/24/13: 330,000
Range: 318,000 to 335,000
Personal income in June advanced 0.3 percent in June percent after a 0.4 percent rise in May. The wages & salaries component grew a robust 0.5 percent, following a 0.3 percent boost in May. Consumer spending surged 0.5 percent in June, following a 0.2 percent rise the prior month. Nondurables led the gain, boosted by gasoline prices. Durables also were strong due to auto sales. Headline inflation was stronger with a 0.4 percent increase after rising 0.1 percent in May. The core inflation rate rose 0.2 percent in June, following a 0.1 percent gain in May. Looking ahead, private aggregate earnings slipped 0.1 percent in July and suggest softness in the private wages & salary component of personal income. There is notable uncertainty about July consumer spending. Unit new motor vehicle sales declined 1.8 percent in July while retail sales excluding autos gained 0.5 percent. PCE inflation should ease at the headline level as the CPI slowed to 0.2 percent in July from 0.5 percent the month before. The core CPI also posted at 0.2 percent for July.
Personal income Consensus Forecast for July 13: +0.2 percent
Range: -0.1 to +0.3 percent
Personal consumption expenditures Consensus Forecast for July 13: +0.3 percent
Range: 0.0 to +0.5 percent
PCE price index Consensus Forecast for July 13: +0.2 percent
Range: +0.1 to +0.3 percent
Core PCE price index Consensus Forecast for July 13: +0.2 percent
Range: +0.1 to +0.2 percent
The Chicago PMI for July was up 7 tenths to 52.3 but several key components showed slowing: new orders 53.9 versus 54.6 in June, production 53.6 versus 57.0, and inventories 37.7 versus 41.4. In positives, delivery times, which shortened sharply in June to 46.9 in a sign of weakness, rose to 51.0 to indicate a little bit of congestion in the supply chain that is consistent with rising activity. Another sign of activity is employment which, though slipping 1.2 points in the month, was at 56.6 to indicate soilid growth.
Chicago PMI Consensus Forecast for August 13: 53.0
Range: 52.0 to 54.0
The Reuter's/University of Michigan's consumer sentiment index for preliminary August fell 5.1 points to 80.0. This was the lowest reading since April. The decline was concentrated in the current conditions component which was down 7.6 points to 91.0 and is also the lowest reading since April. The reason for the decline is hard to pinpoint given the improvement underway in jobless claims and the strong uptrend in home prices. The price of gas, which has been coming down from last month, is not to blame either. The recent retreat in the stock market may be a negative, at least for the high income group. Another negative perhaps is the prospect that the Federal Reserve will begin tapering down its stimulus—but most consumers likely are not tracking this issue. The expectations component was also lower, down 3.6 points to 72.9 which again was the lowest reading since April.
Consumer sentiment Consensus Forecast for final August 13: 80.0
Range: 79.0 to 82.0
R. Mark Rogers is the author of The Complete Idiot’s Guide to Economic Indicators, Penguin Books.
Econoday Senior Writer Mark Pender contributed to this article.
|
