|
This past week, economic news was mixed. The Fed likely does not have a compelling picture for tapering in September although many traders believe the start of tapering will be announced at the September FOMC meeting.
 Equities ended the week down significantly and it was all about renewed worries on the possibility that the Fed might start tapering bond purchases in September. Economic news and corporate news was not very inspiring in either direction. Equities ended the week down significantly and it was all about renewed worries on the possibility that the Fed might start tapering bond purchases in September. Economic news and corporate news was not very inspiring in either direction.
Indexes were mixed Monday on a report indicating a slowing in Japan’s economic growth and as traders sat on the sideline, awaiting Tuesday’s report on retail sales. Stocks rebounded on Tuesday after Atlanta Fed president Dennis Lockhart said the economic picture is too mixed for the Federal Reserve to detail its exit strategy from massive stimulus. Also, core retail sales beat expectations.
 Traders on Wednesday simply decided to worry about Fed taper despite no real economic or corporate news and FedSpeak that actually leaned toward later than sooner taper. St. Louis Federal Reserve President James Bullard said the FOMC needs to gather more data that show the economy is improving and inflation heading higher before deciding to taper its bond buying program. On Thursday, “good news was bad news” as initial jobless claims fell somewhat more than expected, resulting in belief that Fed tapering will be announced in September. This was despite disappointing reports on national industrial production and from New York and Philly Fed manufacturing surveys. Markets were also nervous about political instability in Egypt. Traders on Wednesday simply decided to worry about Fed taper despite no real economic or corporate news and FedSpeak that actually leaned toward later than sooner taper. St. Louis Federal Reserve President James Bullard said the FOMC needs to gather more data that show the economy is improving and inflation heading higher before deciding to taper its bond buying program. On Thursday, “good news was bad news” as initial jobless claims fell somewhat more than expected, resulting in belief that Fed tapering will be announced in September. This was despite disappointing reports on national industrial production and from New York and Philly Fed manufacturing surveys. Markets were also nervous about political instability in Egypt.
Equities eased the last day of the week as a drop in consumer sentiment offset a gain in housing starts.
Equities were down this past week. The Dow was down 2.2 percent; the S&P 500, down 2.1 percent; the Nasdaq, down 1.6 percent; the Russell 2000, down 2.3 percent; and the Wilshire 5000, down 2.2 percent.
For the year-to-date, major indexes are up as follows: the Dow, up 15.1 percent; the S&P 500, up 16.1 percent; the Nasdaq, up 19.3 percent; the Russell 2000, up 20.6 percent; and the Wilshire 5000, up 17.2 percent.
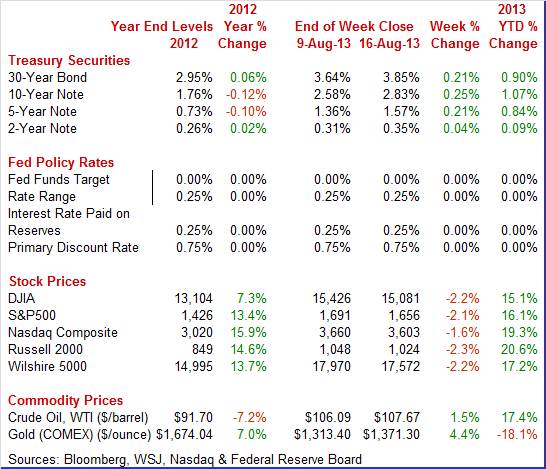
Weekly percent change column reflects percent changes for all components except interest rates. Interest rate changes are reflected in simple differences.
 Treasury yields ended the week up on worries about the Fed cutting back on quantitative easing—mainly impacting long rates. Rates moved up steadily except on Wednesday. Treasury yields ended the week up on worries about the Fed cutting back on quantitative easing—mainly impacting long rates. Rates moved up steadily except on Wednesday.
Rates nudged up Monday ahead of Tuesday’s retail sales report. Yields gained further on Tuesday’s better-than-expected retail sales report. Rates were essentially unchanged Wednesday.
Yields rose moderately Thursday on the initial jobless claims report which fueled speculation of early Fed tapering of asset purchases. Traders focused more on the claims data than on soft manufacturing numbers. Yields firmed further on Friday—again on taper concerns.
For this past week Treasury rates were up as follows: the 2-year note, up 4 basis points; the 5-year note, up 21 basis points; the 7-year note, up 25 basis points; the 10-year note, up 25 basis points; and the 30-year bond, up 21 basis points. The 3-month T-bill edged down 1 basis point.
 The spot price of West Texas Intermediate rose moderately for the week with slow gains each day. There were no standout daily swings. The spot price of West Texas Intermediate rose moderately for the week with slow gains each day. There were no standout daily swings.
Several factors came into play but only modestly. North Sea production was temporarily stopped on a production breakdown. Libya also temporarily shut its export point. Oil stockpiles were lower than expected. Finally, political unrest in Egypt supported higher prices.
Net for the week, the spot price for West Texas Intermediate gained $1.58 per barrel to settle at $107.67.
The economic news definitely was mixed this past week. The recovery is shifting more toward construction while manufacturing is soft.
Retail sales improved in July even after discounting for the impact of higher gasoline prices for the month.
 Retail sales rose 0.2 percent in July after an upwardly revised 0.6 percent. As expected, autos were weak with a 1.0 decline after a 2.9 percent boost in June. The level of motor vehicle sales was still healthy. Retail sales excluding autos rose 0.5 percent after a 0.1 percent rise in June. Gasoline sales were up a significant 0.9 percent, following a 0.6 percent rise in June. Retail sales rose 0.2 percent in July after an upwardly revised 0.6 percent. As expected, autos were weak with a 1.0 decline after a 2.9 percent boost in June. The level of motor vehicle sales was still healthy. Retail sales excluding autos rose 0.5 percent after a 0.1 percent rise in June. Gasoline sales were up a significant 0.9 percent, following a 0.6 percent rise in June.
The core showed solid improvement after a questionable June. Excluding both autos and gasoline components, sales gained 0.4 percent after no change in June.
 Within the core, gains were widespread with increases in food & beverage stores, health & personal care, clothing, sporting goods & hobbies & music, general merchandise, miscellaneous store retailers, nonstore retailers, and food services & drinking places. Within the core, gains were widespread with increases in food & beverage stores, health & personal care, clothing, sporting goods & hobbies & music, general merchandise, miscellaneous store retailers, nonstore retailers, and food services & drinking places.
On the downside were furniture & furnishings, electronics & appliances, and building materials & garden equipment. However, some of the negative home related categories may have been weighed down by atypically wet weather on the east coast.
Overall, consumer spending is moderately healthy. Estimates for third quarter GDP might be nudged up and Fed taper talk will continue.
The consumer seems to be having difficulty figuring out the economy even though spending was moderately strong in July.
 Three months of gains in consumer sentiment were suddenly scaled back sharply with the index falling 5.1 points to 80.0 which was well below the Econoday consensus for 85.5. This was the lowest reading since April. It also fell below the low end of the forecasts at 82.5. Three months of gains in consumer sentiment were suddenly scaled back sharply with the index falling 5.1 points to 80.0 which was well below the Econoday consensus for 85.5. This was the lowest reading since April. It also fell below the low end of the forecasts at 82.5.
 The decline was concentrated in the current conditions component which was down 7.6 points to 91.0, which is also the lowest reading since April. The reason for the decline is hard to pinpoint given the improvement underway in jobless claims and the strong uptrend in home prices. The price of gas, which has been coming down from last month, is not to blame either. The recent retreat in the stock market may be a negative, at least for the high income group. Another negative perhaps is the prospect that the Federal Reserve will begin tapering down its stimulus—but most consumers likely are not tracking this issue.
The expectations component was also lower, down 3.6 points to 72.9 which again was the lowest reading since April. This decline hints at concern over future income in what would point to doubts over the jobs market. Doubts over the economy are apparent in a separate reading on the 12-month economic outlook which was down a sharp 12 points from July to 92.
 Housing made somewhat of a comeback in July and taking into account wet weather on the East coast should be taken as stronger than face value. Housing starts in July rebounded 5.9 percent after falling 7.9 percent in June. The July starts annualized level of 0.896 million units was up 20.9 percent on a year-ago basis. Housing made somewhat of a comeback in July and taking into account wet weather on the East coast should be taken as stronger than face value. Housing starts in July rebounded 5.9 percent after falling 7.9 percent in June. The July starts annualized level of 0.896 million units was up 20.9 percent on a year-ago basis.
 The boost in starts was led by a monthly 26.0 percent jump in the volatile multifamily component after a 24.8 percent fall in June. The single-family component dipped 2.2 percent after rising 1.2 percent the month before. The boost in starts was led by a monthly 26.0 percent jump in the volatile multifamily component after a 24.8 percent fall in June. The single-family component dipped 2.2 percent after rising 1.2 percent the month before.
Permits returned to a moderate uptrend. Permits made a 2.7 percent comeback after dropping 6.8 percent in June. July’s annualized pace of 0.943 million units was up 12.4 percent on a year-ago basis. Market expectations were for 0.935 million units for July permits.
Housing data are groggy currently due to atypically wet weather on the east coast and there is uncertainty from mortgage rates nudging up from worries about Fed tapering. But the trend still appears to be a moderate uptrend—especially as short supply of houses on the market is boosting construction.
 Manufacturing is slowing the recovery—even more than expected. Manufacturing is slowing the recovery—even more than expected.
Industrial production disappointed for July with manufacturing posting a modest decline. Overall industrial production was flat in July, following a 0.2 percent rise in June and no change in May.
The manufacturing component slipped 0.1 percent after a 0.2 percent rise in June. Excluding motor vehicles, manufacturing was unchanged in July, following a 0.1 percent increase in June.
 The output of durable goods fell 0.2 percent in July while nondurable manufacturing was unchanged in July for a second month in a row. The output of durable goods fell 0.2 percent in July while nondurable manufacturing was unchanged in July for a second month in a row.
The output of utilities fell 2.1 percent after declining 0.8 percent in June. Production at mines showed a 2.1 percent boost, following a 1.0 gain in June.
Capacity utilization for total industry slipped to 77.6 in July from 77.7 the month before. Expectations were for 77.9 percent.
Manufacturing is still sluggish and the latest reports for Empire State and Philly Fed add to that view.
Manufacturing decelerated in August in both the New York and Philly Fed District regions.
 Manufacturing activity slowed in August in the New York region based on the Empire State general conditions index which eased to 8.24 from 9.46 in July. The change in the headline index was not as striking as the change in many of the details especially new orders where growth, at only 0.27, was essentially at a standstill. New orders have not been showing much life at all, posting only a slight rise in July following a run of slight contraction in prior months. Manufacturing activity slowed in August in the New York region based on the Empire State general conditions index which eased to 8.24 from 9.46 in July. The change in the headline index was not as striking as the change in many of the details especially new orders where growth, at only 0.27, was essentially at a standstill. New orders have not been showing much life at all, posting only a slight rise in July following a run of slight contraction in prior months.
 In the absence of order strength, manufacturers in the region have been working down backlogs which continue to contract, at minus 6.02 in the latest reading to extend an extremely long run of weakness. Shipments were up for August but not very much, at only 1.47 which indicates much slower growth than July's 8.96. In the absence of order strength, manufacturers in the region have been working down backlogs which continue to contract, at minus 6.02 in the latest reading to extend an extremely long run of weakness. Shipments were up for August but not very much, at only 1.47 which indicates much slower growth than July's 8.96.
One positive, however, was a big jump in employment growth, at 10.84 that combined with a surprising rise in the workweek, at 4.82.
The news from the Philly Fed also was disappointing.
The Philly Fed’s general business conditions index dropped to 9.3 versus July's 19.8.
Details were mostly negative though new orders were modestly positive, at 5.3 though indicating slowing growth from 10.2 in July.
But other readings this month were disappointing, including a small monthly contraction for both shipments and unfilled orders as well as a significant shortening in delivery times and a significant draw down in inventories both of which point to declining activity. Employment growth slowed, but was still slightly positive.
 Inflation is not yet presenting a problem for the Fed to cut back on asset purchases—but the numbers are warm enough to raise the debate. The consumer price index July decelerated to a 0.2 percent rise after surging 0.5 percent the month before. The July figure matched expectations for a 0.2 percent rise. The core CPI—excluding food and energy—posted at 0.2 percent, equaling both the June number and analysts’ forecast. Inflation is not yet presenting a problem for the Fed to cut back on asset purchases—but the numbers are warm enough to raise the debate. The consumer price index July decelerated to a 0.2 percent rise after surging 0.5 percent the month before. The July figure matched expectations for a 0.2 percent rise. The core CPI—excluding food and energy—posted at 0.2 percent, equaling both the June number and analysts’ forecast.
By major components outside the core, energy edged up 0.2 percent, following a spike of 3.4 percent in June. Gasoline increased 1.0 percent, following a surge of 6.3 the prior month. Food edged up 0.1 percent, following a rebound of 0.2 percent in June.
 For the core measure, upward pressure primarily came from tobacco and apparel. Downward pressure was seen in airline fare, used cars & trucks, and physician services. For the core measure, upward pressure primarily came from tobacco and apparel. Downward pressure was seen in airline fare, used cars & trucks, and physician services.
Year-on-year, overall CPI inflation fired to 2.0 percent from 1.8 percent June (seasonally adjusted). The core rate came in at 1.7 percent, compared to 1.6 percent the month before. On an unadjusted year-ago basis, the headline CPI in July was up 2.0 percent and the core was up 1.7 percent. These numbers are below the Fed’s threshold of 2.5 percent inflation for triggering debate on tapering, but they are closer and higher than in recent months. Some on the FOMC clearly will be pointing out that inflation may be low but is creeping back up.
There was a conflict in direction in inflation between consumer and producer prices—consumer price inflation firmed while producer price inflation eased.
 Producer price inflation for July came in much softer than expected—largely due to a surprise drop in energy costs. The July producer price index was unchanged after jumping 0.8 percent in June. The core rate, which excludes both food and energy, posted at 0.1 percent, compared to 0.2 percent in June. Producer price inflation for July came in much softer than expected—largely due to a surprise drop in energy costs. The July producer price index was unchanged after jumping 0.8 percent in June. The core rate, which excludes both food and energy, posted at 0.1 percent, compared to 0.2 percent in June.
Food prices were flat in July, following a 0.2 percent rise the month before. Energy dipped 0.2 percent, following a surge of 2.9 percent in June. Weakness in energy was led by a 3.9 percent drop in residential gas. Gasoline prices decreased 0.8 percent after spiking 7.2 percent the prior month. Home heating oil and electricity were up 2.4 percent and 0.2 percent, respectively, in July.
 The July advance for the core index was led by prices for pharmaceutical preparations, which rose 1.0 percent. Increases in the indexes for light motor trucks and for communication and related equipment also contributed to higher finished core prices. Weakness was seen in passenger cars which fell 1.1 percent. The July advance for the core index was led by prices for pharmaceutical preparations, which rose 1.0 percent. Increases in the indexes for light motor trucks and for communication and related equipment also contributed to higher finished core prices. Weakness was seen in passenger cars which fell 1.1 percent.
For the overall PPI, the year-ago rate eased to 2.1 percent from 2.5 percent in June (seasonally adjusted). The core rate slipped to 1.2 percent in July from 1.6 percent the prior month. On a not seasonally adjusted basis for July, the year-ago headline PPI was up 2.1 percent, while the core was up 1.2 percent.
The divergence in direction in CPI and PPI inflation likely will lead to increased debate at the Fed on inflation trends and the timing of tapering. The crystal ball on Fed policy seems to be fogging a bit.
 Nonfarm business productivity rebounded an annualized 0.7 percent, following a decline of 1.7 percent in the fourth quarter. Market expectations were for a 1.3 percent rise. Unit labor costs rose 0.5 percent, following a 4.4 percent jump in the fourth quarter. The consensus forecast a 0.1 percent rise. Nonfarm business productivity rebounded an annualized 0.7 percent, following a decline of 1.7 percent in the fourth quarter. Market expectations were for a 1.3 percent rise. Unit labor costs rose 0.5 percent, following a 4.4 percent jump in the fourth quarter. The consensus forecast a 0.1 percent rise.
 Looking at component detail, output improved to 2.5 percent versus 0.7 percent in the fourth quarter. Growth in hours worked slowed to an annualized 1.8 percent, following 2.4 percent the prior period. Growth in compensation also decelerated—to 1.2 percent from 2.7 percent in the fourth quarter. Looking at component detail, output improved to 2.5 percent versus 0.7 percent in the fourth quarter. Growth in hours worked slowed to an annualized 1.8 percent, following 2.4 percent the prior period. Growth in compensation also decelerated—to 1.2 percent from 2.7 percent in the fourth quarter.
Year-on-year, productivity was up 0.9 percent in the first quarter versus 0.6 percent the quarter before. Year-ago unit labor costs were up 0.6 percent, compared to 2.0 percent in the fourth quarter. Hourly compensation was up 1.6 percent, following 2.7 percent in the fourth quarter.
If the Fed is looking at productivity numbers to determine when and how much to taper, the latest report probably is neutral. Growth in hours worked improved but is still sluggish. On the margin, compensation rebounded but from a low first quarter and the year-ago trend is still soft. The productivity news is modestly good but still below par compared to history.
Indicator news is mixed and should leave the Fed scratching its collective head. Housing seems to be improving while manufacturing has stalled. The consumer is confused with spending up but sentiment down. And on the inflation front, data are mixed with the CPI firming but the PPI rate softening. The Fed has a lot to debate on current data but more are to come before the September policy meeting when some think the Fed will hint at or actually begin to taper quantitative easing. But so far, the data are not compelling.
Housing is this week’s focus. Indicators will add to whether or not this sector is maintaining momentum despite the recent moderate rise in mortgage rate. Homebuilders and traders will be hoping for gains in both existing and new home sales. Rising home prices are helping support consumer spirits and bring more homes from under water. FHFA home prices will update on that front. Manufacturing has been sluggish and the first number out for the U.S. is the Markit PMI this week.
The Chicago Fed National Activity Index in June was soft, but a little less soft than May. The national activity index improved to minus 0.13 from May's revised minus 0.29. A negative reading indicates that economic growth was below historical trend. The 3-month average also improved but was still well on the negative side, at minus 0.26 from a revised minus 0.37. Improvement came from the employment and production groups. Weighing down on the June composite were consumption & housing and sales/orders/inventories.
No consensus numbers are available for this month’s report
Existing home sales in June slowed to a 5.08 million annual rate from 5.14 million the month before. This was a 1.2 percent drop after a gain in May of 3.4 percent. But prices continued to rise, up 5.5 percent for the median to $214,200 and up 4.0 percent on the average to $261,100. Year-on-year price growth was in the low double digits for the median and in the high single digits for the average. These price data are not derived from repeat transactions and are subject to substantial volatility. A few more sellers are putting their homes on the market, helping to ease what is still a noticeable lack of supply that is holding down sales. Supply was at 5.2 months at the current sales rate versus 5.0 months in May.
Existing home sales Consensus Forecast for July 13: 5.15 million-unit rate
Range: 5.00 to 5.30 million-unit rate
The Minutes of the July 30-31 FOMC meeting are scheduled for release at 2:00 p.m. ET.
Market focus will be on any hints at early tapering of the Fed’s bond purchase programs. This will include how extensive comments were by FOMC participants.
Initial jobless claims fell a very sharp 15,000 in the August 10 week to a new recovery low of 320,000. The Labor Department saw nothing unusual that may be skewing the data. The 4-week average, down 4,000 to 332,000, was also at a recovery low and was more than 10,000 below the month-ago trend to point to tangible improvement in monthly employment conditions.
Jobless Claims Consensus Forecast for 8/17/13: 329,000
Range: 315,000 to 330,000
The Markit PMI manufacturing index (final) came in at 53.7 versus the flash mid-month reading of 53.2, both of which were meaningfully above June's final reading of 51.9.
New orders were a special positive in the report, at 55.5 for a more than 2 point gain from June. The export orders index was up which was especially good news given prior weakness in foreign markets, as are total backlog orders. Output was up as was employment.
Markit PMI manufacturing flash index Consensus Forecast for August 13: 53.5
Range: 53.0 to 54.5
The FHFA purchase only house price index for May advanced 0.7 percent after gaining 0.5 percent in April. The May HPI change marked the sixteenth consecutive monthly price increase in the purchase-only, seasonally adjusted index. The U.S. index is 11.2 percent below its April 2007 peak. The year-on-year rate for May posted at 7.3 percent, matching the April pace.
FHFA purchase only house price index Consensus Forecast for June 13: +0.6 percent
Range: +0.5 to +1.0 percent
The Conference Board's index of leading indicators was unchanged in the June, following gains of 0.2 percent in May and 0.8 percent in April. The building permit component pulled down on the overall index with a negative contribution of 0.25 percentage points. Other negatives were slight. The positive contributors were led by the interest rate spread (0.24 percent points), the leading credit index (inverted) (0.13), and average weekly initial claims for unemployment insurance (inverted) (0.07).
Leading indicators Consensus Forecast for July 13: +0.5 percent
Range: +0.2 to +0.7 percent
The Kansas City Fed manufacturing index in July rose moderately improving to 6 in July, up from minus 5 in June and 2 in May. Production increased at both durable and non-durable goods-producing plants. Most other month-over-month indexes also improved. The production index increased from minus 17 to plus 21, its highest level since June 2011, and the shipments and new orders indexes also rose markedly. In contrast, the order backlog index edged lower from minus 4 to minus 7, and the employment index also eased slightly.
Kansas City Fed manufacturing index Consensus Forecast for August 13: +5
Range: -2 to +7
New home sales in June were at a new recovery high, at a 497,000 annual rate in June, compared to 459,000 in May for an 8.3 percent surge in June after a 1.3 percent rise the month before. The availability of new homes on the market is extremely tight, at only 3.9 months at the current sales rate.
New home sales Consensus Forecast for July 13: 487 thousand-unit annual rate
Range: 450 thousand to 505 thousand-unit annual rate
R. Mark Rogers is the author of The Complete Idiot’s Guide to Economic Indicators, Penguin Books.
Econoday Senior Writer Mark Pender contributed to this article.
|
