|
June payroll jobs topped expectations. And equities appear to see the latest reading as favorable. But is it expectations that the Fed cares about or actually healthy and consistently healthy numbers' Also, some portions of the jobs report were not favorable.
 Equities kicked off the week with sizeable gains due to a rebound in the manufacturing sector, according to ISM, and due to a strong boost in construction activity. Stocks rose early in the day on Tuesday on healthy auto sales but ended flat to down modestly on worries about the pending employment situation report on Friday. Equities kicked off the week with sizeable gains due to a rebound in the manufacturing sector, according to ISM, and due to a strong boost in construction activity. Stocks rose early in the day on Tuesday on healthy auto sales but ended flat to down modestly on worries about the pending employment situation report on Friday.
 Stocks advanced in a volatile half-day session on Wednesday as traders squared positions before the Thursday Independence Day holiday and Friday's job market data. Indicators were mixed with ADP employment and jobless claims beating expectations but international trade and ISM non-manufacturing coming in worse than projected. Stocks advanced in a volatile half-day session on Wednesday as traders squared positions before the Thursday Independence Day holiday and Friday's job market data. Indicators were mixed with ADP employment and jobless claims beating expectations but international trade and ISM non-manufacturing coming in worse than projected.
The week ended on a positive note with equities up on better-than-expected gains in payroll employment for June with significant upward revisions to the prior two months. Equities traders appeared to ignore weakness in the household survey portion of the report.
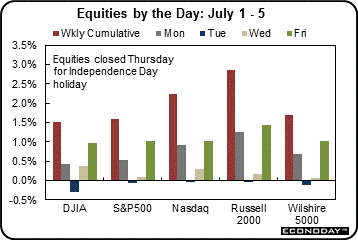
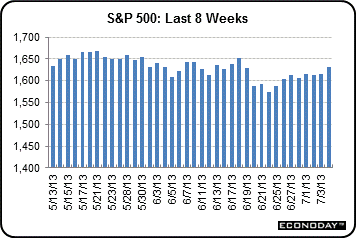
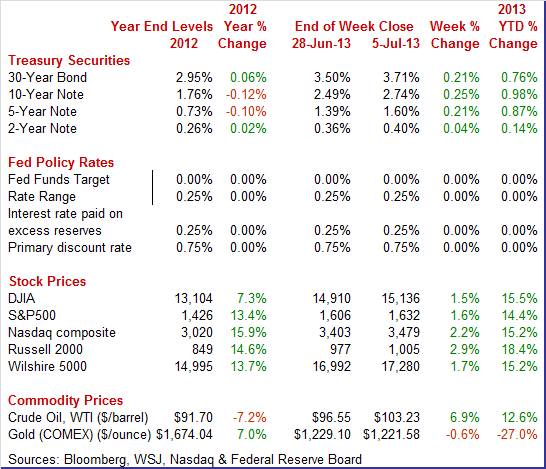
Equities were up this past week. The Dow was up 1.5 percent; the S&P 500, up 1.6 percent; the Nasdaq, up 2.2 percent; the Russell 2000, up 2.9 percent; and the Wilshire 5000, up 1.7 percent.
For the year-to-date, major indexes are up as follows: the Dow, up 15.5 percent; the S&P 500, up 14.4 percent; the Nasdaq, up 15.2 percent; the Russell 2000, up 18.4 percent; and the Wilshire 5000, up 15.2 percent.
Weekly percent change column reflects percent changes for all components except interest rates. Interest rate changes are reflected in simple differences.
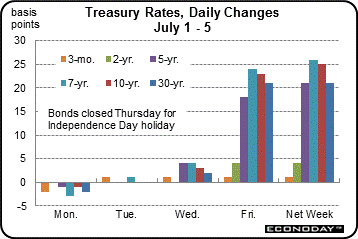 Treasury yields spiked on this past week’s employment news. However, rates nudged down at the start of the week on comments by Federal Reserve Bank of New York President William Dudley that the Fed likely will continue asset purchases for a prolonged period if the economy turns out to be weaker than expected. Treasury yields spiked on this past week’s employment news. However, rates nudged down at the start of the week on comments by Federal Reserve Bank of New York President William Dudley that the Fed likely will continue asset purchases for a prolonged period if the economy turns out to be weaker than expected.
After essentially no change on Tuesday, yields firmed Wednesday after the ADP private employment report came in higher than expected, raising concern about early Fed tapering of asset purchases.
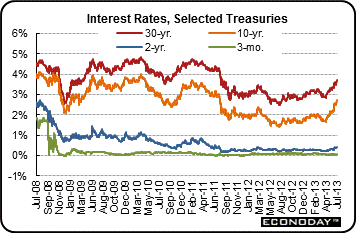 The big move in rates came Friday after the employment situation report for June posted a significantly higher than expected increase in payroll jobs plus upward revisions. This reinforced the bond market belief that tapering will occur later this year. The big move in rates came Friday after the employment situation report for June posted a significantly higher than expected increase in payroll jobs plus upward revisions. This reinforced the bond market belief that tapering will occur later this year.
For this past week Treasury rates were up as follows: 3-month T-bill, up 1 basis point; the 2-year note, up 4 basis points; the 5-year note, up 21 basis points; the 7-year note, up 26 basis points; the 10-year note, up 25 basis points; and the 30-year bond, up 21 basis points.
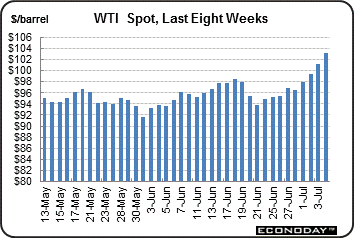 The spot price of West Texas rose steadily and significantly this past week and it was all about tensions in Egypt and the chage in leadership by the country’s military. On Monday, large protests against President Mohamed Mursi caused concern that the protests could spread beyond Egypt and disrupt oil supplies from the Middle East. A specific worry was how oil transport traffic through the Suez Canal might be affected. The same concerns lifted crude sharply on Tuesday—especially on news that the country’s military announced they would implement their own plan if Mursi was not able to resolve the political crisis within two days. Concern about a military coup boosted crude on Wednesday. The spot price of West Texas rose steadily and significantly this past week and it was all about tensions in Egypt and the chage in leadership by the country’s military. On Monday, large protests against President Mohamed Mursi caused concern that the protests could spread beyond Egypt and disrupt oil supplies from the Middle East. A specific worry was how oil transport traffic through the Suez Canal might be affected. The same concerns lifted crude sharply on Tuesday—especially on news that the country’s military announced they would implement their own plan if Mursi was not able to resolve the political crisis within two days. Concern about a military coup boosted crude on Wednesday.
At week’s close, the strong jobs report added to upward momentum and worries about Egypt continued. Egypt’s military ousted Mursi and replaced him with military-appointed interim president, Adly Mansour.
Net for the week, the spot price for West Texas Intermediate spiked $6.68 per barrel to settle at $103.23. This is the highest since early May 2012.
Economic news this past week showed mostly improvement in the consumer and construction sectors. However, markets missed some of the weak points in the employment report. Manufacturing continues to struggle.
 Hiring in June was moderately stronger in terms of payroll jobs growth. However, the unemployment rate remains elevated and by some measures, the household survey data headed in the wrong direction. Hiring in June was moderately stronger in terms of payroll jobs growth. However, the unemployment rate remains elevated and by some measures, the household survey data headed in the wrong direction.
Total payroll jobs in June increased 195,000 after rising a revised 195,000 in May (originally up 175,000). The consensus forecast was for a 161,000 gain for June. The net revisions for April and May were up 70,000. The unemployment rate held steady at 7.6 percent. The market median was for a 7.5 percent unemployment rate.
Turning back to payroll data, private payrolls gained 202,000 after rising 207,000 in May (originally 178,000). Expectations were for a 175,000 advance.
Once again, strength was in the private service-providing sector. Private service-providing jobs increased 194,000 after a 207,000 boost in May. The June increase was led by leisure & hospitality (up 75,000), professional & business services (up 53,000), retail trade (up 37,000), and health care (up 20,000).
 The goods-producing sector was mixed with manufacturing a clear disappointment. Goods-producing jobs advanced modestly, rising 8,000 after no change in May. Construction increased 13,000 in June while mining edged up 1,000. Manufacturing employment decreased 6,000. However, within manufacturing, jobs in the motor vehicle subcomponent gained 5,000 in June. The goods-producing sector was mixed with manufacturing a clear disappointment. Goods-producing jobs advanced modestly, rising 8,000 after no change in May. Construction increased 13,000 in June while mining edged up 1,000. Manufacturing employment decreased 6,000. However, within manufacturing, jobs in the motor vehicle subcomponent gained 5,000 in June.
Government jobs fell 7,000 in June, following a decrease of 12,000 the month before. Federal jobs fell 5,000; state jobs were down 15,000; and local government employment rose 13,000.
There was a notable monthly improvement in wages. Average hourly earnings jumped 0.4 percent in June after a modest 0.1 percent rise the month before. However, over the longer run, wages remain soft on average. On a year ago basis, average hourly earnings were up 2.0 percent, matching the rate for May. The average workweek was 34.5 hours, equaling the number for May. The market consensus was for 34.5 hours.
 Turning to detail for the household survey, household employment in June rose 160,000 after a 319,000 increase the month before. The labor force increased 177,000, following a 420,000 jump in May. Turning to detail for the household survey, household employment in June rose 160,000 after a 319,000 increase the month before. The labor force increased 177,000, following a 420,000 jump in May.
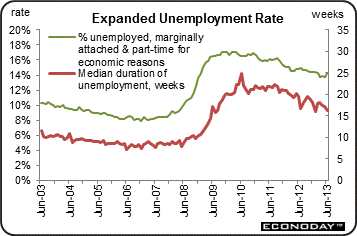
The expanded underemployment rate actual jumped to 14.3 percent in June from 13.8 percent the prior month. This increase was largely due to a spike in the number of part-time workers for economic reasons.
There was moderate improvement in payroll numbers but no progress on the unemployment rate. The big question is how the Fed will view the numbers. Most likely there will be caution in FedSpeak—waiting on more months of information on the labor market. Even the June payroll figures look good only compared to a low bar. But the consumer sector is improving as well as construction. Manufacturing still looks soft.
Looking ahead, the latest payroll data point toward a nice gain in personal income but to sluggish manufacturing production. Private aggregate earnings jumped 0.6 percent in June and suggest a sizeable increase in the private wages & salary component of personal income. The manufacturing component of industrial production may dip as production worker hours in manufacturing declined 0.2 percent in June.
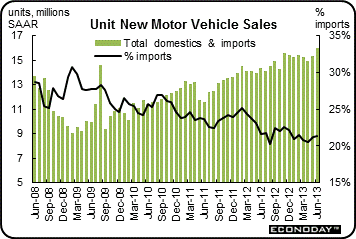 Another sign of the consumer sector improving is the June boost in motor vehicle sales. Vehicle sales moved higher, up 4.2 percent in June to a recovery best annual rate of 16.0 million units. Another sign of the consumer sector improving is the June boost in motor vehicle sales. Vehicle sales moved higher, up 4.2 percent in June to a recovery best annual rate of 16.0 million units.
June's strength was split evenly between cars and trucks and also between imports and domestic-made, with the latter coming in at a 12.6 million rate.
These results are impressive and point to the strength of the consumer and to a third straight big gain for the motor vehicle component of the monthly retail sales report which surged 1.8 percent in May. This also adds to likely upward revisions to the personal consumption expenditures portion of second quarter GDP growth. This is more evidence that the consumer sector is regaining traction—although moderately.
Both the Markit and ISM manufacturing indexes were sluggish at the headline level.
According to Markit, growth in the U.S. manufacturing sector during June slowed a slight bit more than the flash estimate, with the PMI at 51.9 versus 52.2 at mid-month and versus May's 52.3. The slight downgrade from mid-month includes slightly slower growth for new orders, which ends June at 53.4 to show virtually no change from May's 53.3. A mid-to-low 50s reading points to no better than modest growth for the manufacturing sector.
The Markit reading on new orders for exports showed significant contraction at a faster rate, at 46.3 versus May's 49.8. This reading is a concern and could, importantly, reflect slowing demand in China.
Other factors in June include a slight pickup in production, little monthly change in employment which had been expanding, marginal pressures on prices, and very little change in inventories or delivery times.
 Turning to ISM, the headline manufacturing index posted at 50.9 to indicate slight growth from what was a weak May at 49.0. Turning to ISM, the headline manufacturing index posted at 50.9 to indicate slight growth from what was a weak May at 49.0.
But new orders were the big highlight in the report, up more than 3 points to 51.9—although the latest reading is still only marginally positive. And unlike the PMI manufacturing report, the ISM report shows improvement for new export orders at 54.5 compared to 51.0 in May.
For June, production picked up as did imports. Other factors are mixed with employment weak, at 48.7, and with other readings flat including inventories, delivery times, and prices.
The manufacturing sector is in slow growth mode, not contributing much to total economic growth. Currently, the recovery is largely relying on the consumer and housing sectors.
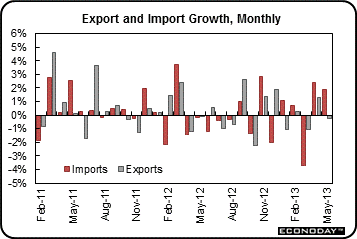
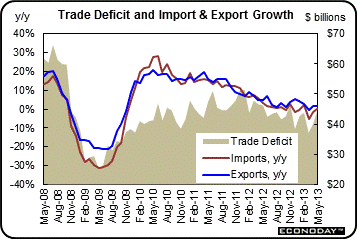 The U.S. trade balance in May widened sharply. There were two obvious divergent moves in components. Exports were down and imports were up. But the rise in imports was not just in petroleum, indicating some improvement in domestic demand even as export demand softened. The trade gap jumped to $45.0 billion from $40.1 billion in April. Exports fell 0.3 percent, following a 1.3 percent gain in April. Imports rose 1.9 percent in May after a 2.4 percent boost the month before. The U.S. trade balance in May widened sharply. There were two obvious divergent moves in components. Exports were down and imports were up. But the rise in imports was not just in petroleum, indicating some improvement in domestic demand even as export demand softened. The trade gap jumped to $45.0 billion from $40.1 billion in April. Exports fell 0.3 percent, following a 1.3 percent gain in April. Imports rose 1.9 percent in May after a 2.4 percent boost the month before.
 The worsening in the trade gap was primarily due to the nonpetroleum goods deficit which grew to $41.6 billion in May from $37.6 billion the prior month. The petroleum deficit expanded to $20.8 billion from $19.7 billion in April. The services surplus advanced to $18.4 billion from $18.3 billion. The worsening in the trade gap was primarily due to the nonpetroleum goods deficit which grew to $41.6 billion in May from $37.6 billion the prior month. The petroleum deficit expanded to $20.8 billion from $19.7 billion in April. The services surplus advanced to $18.4 billion from $18.3 billion.
The drop in exports was led by industrial supplies while the rise in imports was led a jump in imports of consumer goods excluding autos. Also gaining notably were capital goods and autos.
The bottom line is that the latest trade data will likely result in downward revisions to estimates for second quarter GDP. The good news is that for the latest month, U.S. businesses are a little more optimistic about upcoming domestic demand.
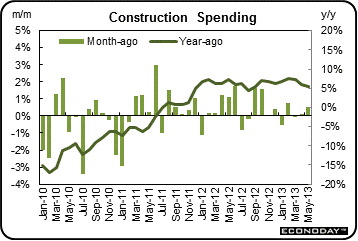 Construction spending was mixed in May with divergent movement in the private sector and the public sector up. Construction outlays advanced 0.5 percent in May after rebounding 0.1 percent in April. Construction spending was mixed in May with divergent movement in the private sector and the public sector up. Construction outlays advanced 0.5 percent in May after rebounding 0.1 percent in April.
The May boost was led by a 1.8 percent rebound in public outlays after a 0.2 percent dip the month before.
In the private sector, residential spending gained 1.2 percent, following a 0.1 percent decrease in April. Multifamily spending was up sharply, 2.5 percent on the month, but single-family was up somewhat less, 0.4 percent. Weakness was centered in nonresidential outlays which fell 1.4 percent after a 0.6 percent rise.
On a year-ago basis, construction was up 5.4 percent in May, compared to 6.0 percent the month before.
The construction sector is edging upward although component strength has been revolving. The one somewhat consistent positive has been multifamily housing. While residential investment has been a plus for economic growth, it still is coming off a low base from the past recession.
 Data are mixed on whether the second quarter improved over the modestly growing first quarter. The ISM non-manufacturing index clearly falls in the camp of soft second quarter growth. Data are mixed on whether the second quarter improved over the modestly growing first quarter. The ISM non-manufacturing index clearly falls in the camp of soft second quarter growth.
Growth slowed for the bulk of the nation's economy during June, based on the ISM non-manufacturing index which, pulled down by a sharp decline in new orders, slowed to 52.2 versus May's 53.7. Any reading over 50 indicates monthly growth, although June's reading indicates a slower rate of growth than May.
Growth in new orders came to a standstill last month with the index just barely over breakeven at 50.8 for the lowest reading of the recovery. New order growth had been very strong, averaging a recovery best 55.5 in the first five months of the year, prior strength that, at least to a limited degree, is still working itself through the supply chain.
There is a notable plus in the report and that is the employment index which jumped 3.6 points to a respectable 54.7. Other readings include a sharp slowing in business activity, a rise in inventories, and a dip in exports. Price pressures remain soft.
The consumer sector is making progress—although slow progress. Housing is still adding to the recovery although from a low base. Meanwhile, manufacturing is now somewhere between slightly negative to slightly positive, depending on the measure used.
The highlight of the week likely will be Fed minutes of the June 18-19 policy meeting as the policy statement indicated increased divergence on quantitative easing. The consumer sector has improved and key readings this week include consumer credit, JOLTS, jobless claims, and consumer sentiment.
Consumer credit outstanding continues to be a tale of two components -- revolving credit which is going nowhere and non-revolving credit which is going straight up. Total credit outstanding gained $11.1 billion in April, which is strong and in trend. But strength is not coming from revolving credit which, since 2007, has been up and down, up $0.7 billion in April and down $0.9 billion in March. Credit cards are the heart of this component. Non-revolving credit is another story. A strong increase in motor vehicle sales during April helped make for another strong increase for this component which rose $10.4 billion to make up the vast bulk of the headline increase. But also a factor behind the increase in non-revolving credit, which has been going up for the last three years, is the government's ongoing acquisition of student loans from private lenders, a factor that does not necessarily point to an ongoing increase in student borrowing.
Consumer credit Consensus Forecast for May 13: +$13.0 billion
Range: +$8.0 billion to +$16.0 billion
The NFIB Small Business Optimism Index was up for a second straight month, 2.3 points higher in the May report to 94.4 which is the second highest reading of the recovery. Eight of 10 components showed monthly gains led by economic expectations and including a gain for sales expectations. Only 1 component declined in the month but, unfortunately, it was hiring plans in a reminder that the index is still below its long-term average of 100.
NFIB Small Business Optimism Index Consensus Forecast for June 13: 94.7
Range: 93.5 to 95.5
The Labor Department’s Job Openings and Labor Turnover Survey showed that there were 3.757 million job openings on the last business day of April, little changed from a revised 3.875 million in March. In April, the number of job openings was little changed in all industries and regions. The hires rate (3.3 percent) and separations rate (3.2 percent) were also little changed. Over the 12 months ending in April 2013, hires totaled 52.0 million and separations totaled 50.2 million, yielding a net employment gain of 1.8 million. These figures include workers who may have been hired and separated more than once during the year.
JOLTS job openings Consensus Forecast for May 13: 3.800 million
Range: 3.790 million to 3.860 million
Wholesale inventories slowed in April, up 0.2 percent versus a revised 0.3 percent build in March and safely below April's 0.5 percent rise in wholesale sales. The slower rate of inventory growth brings down the sector's inventory-to-sales ratio to 1.21 versus March's 1.22 which was a recovery high for this reading.
Wholesale inventories Consensus Forecast for May 13: +0.3 percent
Range: +0.1 to +0.9 percent
The Minutes of the June 18-19 FOMC meeting are scheduled for release at 2:00 p.m. ET. The policy statement released on June 19 included an unexpected dissent from St. Louis’ James Bullard in favor additional ease while Kansas City’s Esther George continued to dissent in the other direction, worrying about the impact of quantitative easing on future inflation and the stability of financial markets. These minutes will likely add detail on these arguments.
Initial jobless claims are trending lower but only very gradually. Initial claims in the June 29 week fell 5,000 to 343,000. The 4-week average was down slightly to 345,500 which is several thousand below the month-ago trend. Continuing claims were down a sizable 54,000 in the latest available data which is for the June 22 week. The 2.933 million level is a new recovery best as is the 4-week average at 2.969 million for a small decline in the week.
Jobless Claims Consensus Forecast for 7/6/13: 337,000
Range: 325,000 to 360,000
Import prices fell 0.6 percent in May which is the third straight decline. Export prices fell 0.5 percent which is also a third straight decline. Year-on-year rates are mostly negative with non-fuel import prices down 1.1 percent which is a recovery low. Import prices excluding petroleum imports were down 0.3 percent in the latest month which points to weakness in core prices.
Import prices Consensus Forecast for June 13: +0.1 percent
Range: -0.2 to +0.8 percent
Export prices Consensus Forecast for June 13: -0.1 percent
Range: -0.5 to +0.3 percent
The U.S. Treasury monthly budget report showed in May a higher-than-expected monthly deficit of $138.7 billion. Eight months into the government's fiscal year, the deficit was down 26 percent versus this time last year. Higher tax receipts, up 20 percent so far this fiscal year for both income and corporate taxes, was the biggest factor behind the improvement. The outlays side was flat this fiscal year, up 0.8 percent and reflecting higher spending on Medicare and social security. Defense spending was down this year as are net interest payments. Looking ahead, the month of June typically shows a moderate deficit for the month. Over the past 10 years, the average deficit for the month of June has been $12.1 billion and $46.4 billion over the past 5 years. The June 2012 deficit came in at $59.7 billion.
No consensus numbers are available for this month’s report
The producer price index in May posted a 0.5 percent increase after falling 0.7 percent prior month. The core rate, which excludes both food and energy, held steady at 0.1 percent. Food price rebounded 0.6 percent after falling 0.8 percent in April. Energy increased 1.3 percent, following a decline of 2.5 percent. Gasoline made partial recovery, rising 1.5 percent after dropping 6.0 percent in April. Nearly two-thirds of the May advance for core inflation can be traced to prices for light motor trucks, which rose 0.4 percent.
PPI Consensus Forecast for June 13: +0.5 percent
Range: +0.2 to +0.9 percent
PPI ex food & energy Consensus Forecast for June 13: +0.2 percent
Range: 0.0 to +0.3 percent
The Reuter's/University of Michigan's consumer sentiment index ended June at 84.1 versus 82.7 at mid-month which points to an 85 to 86 pace the last two weeks of the month. The May final posted at 84.5. But a negative indication did come from the current conditions index which ended June at 93.8 versus May's 98.0. The expectations component showed strength at 77.8 for a 2 point gain from May.
Consumer sentiment Consensus Forecast for preliminary July 13: 84.1
Range: 77.5 to 86.0
R. Mark Rogers is the author of The Complete Idiot’s Guide to Economic Indicators, Penguin Books.
Econoday Senior Writer Mark Pender contributed to this article.
|
