|
Earlier, the Fed rattled markets with traders taking the view that quantitative easing is going to take place sooner than believed. This past week, Fed officials generally went out of their way to indicate that traders had misinterpreted the latest policy meeting. But it was not a 100 percent consensus with FedSpeak. Meanwhile, economic news was more positive than negative—especially for the housing sector.
 Equities rebounded this past week, largely on comments by some Fed officials that purchases of assets are not going to be reduced soon. But traders did swing daily on this view. The week started on the downside on continued worries about lending restrictions in China and on the possibility of Fed tapering. FedSpeak, however, limited losses. Equities rebounded this past week, largely on comments by some Fed officials that purchases of assets are not going to be reduced soon. But traders did swing daily on this view. The week started on the downside on continued worries about lending restrictions in China and on the possibility of Fed tapering. FedSpeak, however, limited losses.
 Good news was actually good news on Tuesday as a string of indicators were better than expected—including durables orders, new home sales, consumer confidence, and Case-Shiller. Curiously, (and you cannot explain it) bad news was good news on Wednesday as first quarter GDP growth was revised down significantly. This bolstered the view that the Fed will remain easy. Good news was actually good news on Tuesday as a string of indicators were better than expected—including durables orders, new home sales, consumer confidence, and Case-Shiller. Curiously, (and you cannot explain it) bad news was good news on Wednesday as first quarter GDP growth was revised down significantly. This bolstered the view that the Fed will remain easy.
Equities jumped Thursday as FedSpeak on continuing ease offset healthy economic data. Essentially, Fed officials indicated that it is too early to cut back on planned asset purchases. Sentiment swung in the other direction at week’s end on worries about Fed plans on tapering. But the downdraft largely came at the end of the day on rebalancing of Russell indexes.
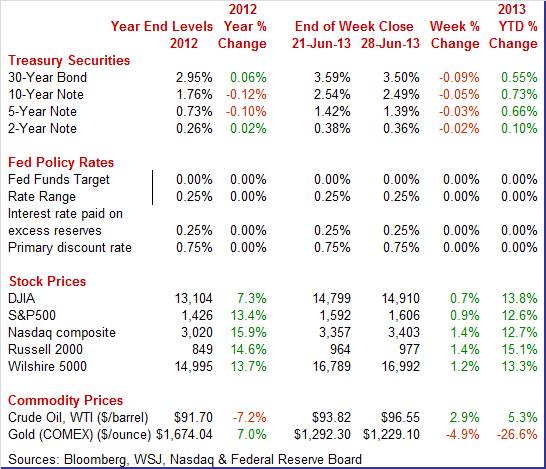
Equities were up this past week. The Dow was up 0.7 percent; the S&P 500, up 0.9 percent; the Nasdaq, up 1.4 percent; the Russell 2000, up 1.4 percent; and the Wilshire 5000, up 1.2 percent.
Equities were down in June. The Dow was down 1.4 percent; the S&P 500, down 1.5 percent; the Nasdaq, down 1.5 percent; the Russell 2000, down 0.7 percent; and the Wilshire 5000, down 1.3 percent.
 Equities were up for the second quarter. The Dow was up 2.3 percent; the S&P 500, up 2.4 percent; the Nasdaq, up 4.2 percent; the Russell 2000, up 2.7 percent; and the Wilshire 5000, up 2.4 percent. Equities were up for the second quarter. The Dow was up 2.3 percent; the S&P 500, up 2.4 percent; the Nasdaq, up 4.2 percent; the Russell 2000, up 2.7 percent; and the Wilshire 5000, up 2.4 percent.
For the year-to-date, major indexes are up as follows: the Dow, up 13.8 percent; the S&P 500, up 12.6 percent; the Nasdaq, up 12.7 percent; the Russell 2000, up 15.1 percent; and the Wilshire 5000, up 13.3 percent.
Weekly percent change column reflects percent changes for all components except interest rates. Interest rate changes are reflected in simple differences.
 Treasury yields eased this past week and it was almost all about a soothing of worry about potential early Fed tapering as Fed officials generally indicated that markets overreacted to the latest policy decision and chairman’s press conference. Treasury yields eased this past week and it was almost all about a soothing of worry about potential early Fed tapering as Fed officials generally indicated that markets overreacted to the latest policy decision and chairman’s press conference.
Rates were mixed and little changed Monday. Rates firmed Tuesday on positive economic news from several sectors—manufacturing, consumer, and housing. This led to belief of early tapering by the Fed. This belief was reversed Wednesday on a downward revision to first quarter GDP.
Rates fell again Thursday despite a strong personal income report—although the inflation numbers were soft. Rates declined due to Fed officials emphasizing that the recovery is still too fragile to remove monetary ease. Rates were mixed Friday.
For this past week Treasury rates were down as follows: 3-month T-bill, down 1 basis point; the 2-year note, down 2 basis points; the 5-year note, down 3 basis points; the 7-year note, down 2 basis points; the 10-year note, down 5 basis points; and the 30-year bond, down 9 basis points.
 The spot price of West Texas Intermediate rose moderately this past week. The only notable daily swings were gains seen Monday and Thursday. Crude rose somewhat over a dollar a barrel Monday as flooding in Canada’s main oil-producing province was seen as possibly reducing exports to the U.S. Spot WTI gained almost a buck and a half Thursday on lower initial jobless claims and on healthy income and spending numbers in the personal income report. The spot price of West Texas Intermediate rose moderately this past week. The only notable daily swings were gains seen Monday and Thursday. Crude rose somewhat over a dollar a barrel Monday as flooding in Canada’s main oil-producing province was seen as possibly reducing exports to the U.S. Spot WTI gained almost a buck and a half Thursday on lower initial jobless claims and on healthy income and spending numbers in the personal income report.
Net for the week, the spot price for West Texas Intermediate rose $2.73 per barrel to settle at $96.55.
Economic news took second place this past week to Fed officials’ commentary on pending monetary policy. However, indicator news was interpreted in terms of likely Fed reaction. Housing data were notably healthy with the consumer sector also positive.
It was quite a week for FedSpeach. Several District Bank presidents and a Fed governor spoke on the economy and specifically on the projected path of quantitative easing. Most indicated that the economy is still too fragile to reduce asset purchases in the near future. The following are commentary this past week from Fed officials.
Early in the week, Minneapolis Fed President Narayana Kocherlakota made special effort to indicate that the Fed has not become more hawkish on monetary policy. He called market belief on this as a “misperception.”
Dallas Fed President Richard Fisher toned down his earlier hawkish comments, stating that he agrees with Chairman Bernanke's announcements. He noted that he is not worried about inflation currently. He expounded on other issues, including that fiscal policy needs to be revamped. He sees the consumer as more comfortable with the economy. On tapering, he focused on data dependency. Tapering depends on when the economy strengthens and by how much. He still remains concerned about long-term inflation potential. However, he was not happy with market behavior after the FOMC decision, stating that investors behaved like “feral hogs”—not a pretty picture.
New York Fed President William Dudley indicated that markets may be “out of sync” with what the Fed is actually thinking on asset purchases. He emphasized that FOMC policy depends on ongoing economic data and that a rise in short-term rates is still likely a long way off. He sees the labor market as still soft and inflation low. This suggests a continuation of quantitative easing for the near term. However, the New York Fed chief anticipates an improvement in economic growth in 2014.
At week’s end, Fed Governor Jerome Powell stated that if the economy continues as forecast, that quantitative easing will end in the middle of 2014. This is not the same as reducing the Fed balance sheet but would have impact on bond demand and other markets. Powell currently sees data as mixed, suggesting that QE tapering is still in the undecided category.
Atlanta Fed President Dennis Lockhart took a neutral position on quantitative easing. He stated that tapering could occur if the economy improves. He indicated that policy is data dependent.
Fed Governor Jeremy Stein took special effort to clarify the Fed’s monetary policy. He indicated that policy stance has not changed and that rate policy has not changed. He noted that the Fed does not want to create undue market volatility (implicitly due to comments on guidance) but he also stated there are limits to what the Fed can do to limit volatility. He noted that if inflation remains low, rates could stay low even after the unemployment rate falls below 6.5 percent.
San Francisco Fed President John Williams added to the view that it is too early for the Fed to taper asset purchases. He stated that eventually tapering will occur but currently inflation is below expectations. Williams indicated that economic growth is moderate at best and that policy rates are likely to remain low for some time.
Richmond Fed President Jeffrey Lacker took the other side in the Fed debate on tapering. Recently, FedSpeak has been in defense of continued quantitative easing. Lacker indicated that the benefits of asset purchases are diminishing. However, he sees moderate growth but inflation resuming toward the 2 percent inflation goal next year as transitory factors diminish.
Overall, the doves still control the FOMC and some in that camp went out of their way to emphasize that tapering is not likely soon unless data consistently indicate otherwise.
 Markets liked the downward revision to first quarter GDP. It was seen as giving the Fed reason to keep easy policy. Real GDP growth for the first quarter was unexpectedly revised down significantly. Growth posted at 1.8 percent versus the second estimate of 2.4 percent. The biggest downward revision was to personal consumption. Markets liked the downward revision to first quarter GDP. It was seen as giving the Fed reason to keep easy policy. Real GDP growth for the first quarter was unexpectedly revised down significantly. Growth posted at 1.8 percent versus the second estimate of 2.4 percent. The biggest downward revision was to personal consumption.
Final sales of domestic product came in with a revised gain of 1.2 percent versus the second estimate of 1.8 percent. Final sales to domestic producers (which exclude net exports) were bumped down to 1.3 percent for the third estimate from the prior estimate of 1.9 percent.
The downward revision to the percent change in real GDP primarily reflected downward revisions to personal consumption expenditures (primarily the services subcomponent), to exports, and to nonresidential fixed investment (mostly structures) that were partly offset by a downward revision to imports.
Headline inflation for the GDP price index was nudged up to 1.2 percent from the second estimate of 1.1 percent. When excluding food and energy, inflation was revised to 1.7 percent, compared the previous estimate of 1.6 percent.
Essentially, economic growth was marginally positive in the first quarter while inflation was low. This scenario might appear favorable for continued Fed ease but the Fed is now looking at more current data which have been mixed.
 The consumer sector made a comeback in May with income and spending improving. Personal income gained 0.5 percent after a 0.1 percent rise in April. Expectations were for a 0.2 percent increase. The wages & salaries component advanced 0.3 percent, following a 0.1 percent increase. The consumer sector made a comeback in May with income and spending improving. Personal income gained 0.5 percent after a 0.1 percent rise in April. Expectations were for a 0.2 percent increase. The wages & salaries component advanced 0.3 percent, following a 0.1 percent increase.
Consumer spending rebounded 0.3 percent in May, following a 0.3 percent drop the month before. Durables led the gain with autos the key reason.
 The Fed is not having to worry about too much inflation but actually too little inflation. Headline inflation was soft with a 0.1 percent rise after declining 0.3 percent in April. The core inflation rate gained 0.1 percent in May, following no change in April. Market expectations were for a 0.1 percent rise. The Fed is not having to worry about too much inflation but actually too little inflation. Headline inflation was soft with a 0.1 percent rise after declining 0.3 percent in April. The core inflation rate gained 0.1 percent in May, following no change in April. Market expectations were for a 0.1 percent rise.
The latest inflation numbers confirm concern among some Fed officials that inflation is running too low. Year-on-year, headline prices were up only 1.0 percent in May versus 0.7 percent in April. The core was up 1.1 percent, matching the April pace. These numbers are well below the Fed’s inflation target of 2.0 percent.
The consumer sector improved in May in both income and spending but inflation remained low. The Fed will likely see this report as mixed for ongoing decisions about quantitative easing. The recovery is improving in the consumer sector but it is just one month’s data and inflation is below target.
 Apparently, consumers are forgetting many of the problems of the past recession or at least see the economy as at less risk and moving forward. According to the Conference Board, consumer confidence is at a recovery best, at 81.4 in June and up nearly 7 points from a revised 74.3 in May for the third straight strong gain. The assessment of the present situation is also up for a third straight month, at a recovery best 69.2 which hints at general strength for the slate of June indicators. But the gain here does mask a small uptick in those who say jobs are hard to get, now at 36.9 percent for a 5 tenths increase that does not point to new gains for the June employment report. Apparently, consumers are forgetting many of the problems of the past recession or at least see the economy as at less risk and moving forward. According to the Conference Board, consumer confidence is at a recovery best, at 81.4 in June and up nearly 7 points from a revised 74.3 in May for the third straight strong gain. The assessment of the present situation is also up for a third straight month, at a recovery best 69.2 which hints at general strength for the slate of June indicators. But the gain here does mask a small uptick in those who say jobs are hard to get, now at 36.9 percent for a 5 tenths increase that does not point to new gains for the June employment report.
Expectations were also at a recovery best, up nearly 9 points to 89.5 and reflecting rising confidence in the long-term outlook for the jobs market. The outlook for income is likewise climbing with more now seeing an increase ahead vs those seeing a decrease. This is an important indication that hints at gains for consumer spending including discretionary spending.
The Reuter’s/University of Michigan reading on sentiment also is on a recent uptrend. Consumer sentiment held steady and positive this month with slight weakness in the first half of the month offset by strength in the second half. The index ends June at 84.1 versus 82.7 at mid-month which points to an 85 to 86 pace the last two weeks. The index ended May at 84.5.
But a negative indication does come from the current conditions index which ended June at 93.8 versus May's 98.0. This is tangible month-to-month decline that does not point to strength for the June slate of economic indicators. The expectations component showed strength, at 77.8 for a 2 point gain from May.
Overall, the consumer is feeling less at risk from swings in the economy. However, it almost certainly remains a divided consumer sector—those with a job being more optimistic and those without a job, not.
 The housing market is without question surging. The latest report on existing home sales was very strong as is the recent release for new home sales which came in at a stronger-than-expected annual rate of 476,000 in May. Upward revisions totaling 19,000 in the prior two months underscore the strength. The housing market is without question surging. The latest report on existing home sales was very strong as is the recent release for new home sales which came in at a stronger-than-expected annual rate of 476,000 in May. Upward revisions totaling 19,000 in the prior two months underscore the strength.
A big issue holding back sales has been limited supply. But this appears to be changing somewhat. Supply is moving higher as builders pick up the pace. Supply on the market rose 4,000 in the month to 161,000 units. On a monthly sales basis, supply was at 4.1 months versus 4.0 months in April. Rising supply will help boost sales in the months ahead.
Helping to boost sales likely was fear that mortgage rates will rise in the near term. This actually has already occurred with conventionally rates on 30-year mortgages running over 4 percent.
 The rise in mortgage rates that began in May did not hold down contract signings for existing home sales—but may have lifted sales on fears that rates and prices would go up in coming months. The pending home sales index jumped 6.7 percent in the month with gains centered in the West and Midwest. The index level of 112.3 was the highest since the boom days of 2006. The year-on-year gain for the index is 12.1 percent, which is interestingly right in line with low double-digit gains for many home-price readings. The rise in mortgage rates that began in May did not hold down contract signings for existing home sales—but may have lifted sales on fears that rates and prices would go up in coming months. The pending home sales index jumped 6.7 percent in the month with gains centered in the West and Midwest. The index level of 112.3 was the highest since the boom days of 2006. The year-on-year gain for the index is 12.1 percent, which is interestingly right in line with low double-digit gains for many home-price readings.
 The housing sector continues on the mend with home prices continuing upward. The FHFA price index for April increased 0.7 percent after improving 1.5 percent in March. The housing sector continues on the mend with home prices continuing upward. The FHFA price index for April increased 0.7 percent after improving 1.5 percent in March.
The April increase was led by the Mountain region, increasing 2.2 percent. Six of nine Census regions posted gains in the latest month.
The year-on-year rate for April stood at 7.4 percent versus 7.5 percent for the month before.
 The latest Case-Shiller data were even more on the upside. Case-Shiller's adjusted month-to-month gain for its 20-city index was up 1.7 percent in April alone and followed a 1.9 percent jump in March. The year-on-year rate was notably strong, at plus 12.0 percent. Gains swept across all cities without exception with strength centered in the West where monthly gains are nearing 3 percent with year-on-year gains reaching 20 percent. The latest Case-Shiller data were even more on the upside. Case-Shiller's adjusted month-to-month gain for its 20-city index was up 1.7 percent in April alone and followed a 1.9 percent jump in March. The year-on-year rate was notably strong, at plus 12.0 percent. Gains swept across all cities without exception with strength centered in the West where monthly gains are nearing 3 percent with year-on-year gains reaching 20 percent.
Based on FHFA and Case-Shiller data, the housing sector is showing continued improvement although from a low base. The Fed’s quantitative easing program clearly is having positive impact in the housing sector. However, relatively short supply of houses on the market also is contributing to the rise in prices
 Manufacturing may be regaining some momentum based on new durables orders—and not just based on aircraft. New factory orders for durables in May jumped 3.6 percent, following a matching 3.6 percent spike the month before. Manufacturing may be regaining some momentum based on new durables orders—and not just based on aircraft. New factory orders for durables in May jumped 3.6 percent, following a matching 3.6 percent spike the month before.
The transportation component surged 10.2 percent after an 8.3 percent boost in April. Within transportation, nondefense aircraft jumped a monthly 51.0 percent; defense aircraft rose 3.7 percent; and motor vehicle orders slipped 1.2 percent.
Excluding transportation, durables orders still gained 0.7 percent after a 1.7 percent increase in April.
Outside of transportation, component strength for May was mostly broad based. All major industries showed gains except for fabricated metals which slipped after an April gain.
Nondefense capital goods orders excluding aircraft may even be picking up some steam. This series rose 1.1 percent, following a 1.2 percent rise in April. Shipments for this series rebounded 1.7 percent in May, following a 2.0 percent drop the month before.
Aircraft production is adding to manufacturing but in the latest month it appears that demand is spreading moderately to most major industries.
 Growth in business activity slowed sharply in June based on the Chicago PMI which came in at 51.6, down 7.1 points from May. Big moves are not unusual for this index but a look at the details points to solid growth with new orders coming in at a very respectable 54.6 to indicate healthy monthly growth though down from an outsized 58.1 in the prior month. Production rose solidly, but again at a slower rate, while employment picked up in the month. A big contraction in backlog orders is a negative in the report. Other details include a shortening in delivery times, consistent with slowing conditions, and a slight rise in price pressures for raw materials. Growth in business activity slowed sharply in June based on the Chicago PMI which came in at 51.6, down 7.1 points from May. Big moves are not unusual for this index but a look at the details points to solid growth with new orders coming in at a very respectable 54.6 to indicate healthy monthly growth though down from an outsized 58.1 in the prior month. Production rose solidly, but again at a slower rate, while employment picked up in the month. A big contraction in backlog orders is a negative in the report. Other details include a shortening in delivery times, consistent with slowing conditions, and a slight rise in price pressures for raw materials.
The Fed does not appear to be in a hurry to taper quantitative easing but markets are nervous nonetheless. The recovery continues with housing picking up steam.
The week’s highlight is the employment situation for June. The big question is whether employment is gaining enough momentum for the Fed to start thinking about slowing quantitative easing. Some say consistent gains of over 200,000 are needed for this. Last week’s personal income report was unexpectedly strong and the next reading on the consumer sector will be motor vehicle sales—which have been moderately healthy. Finally, manufacturing showed signs of life with the latest durables orders. More current updates post this week with Markit PMI and ISM manufacturing.
The Markit PMI manufacturing flash index for June, at 52.2, remained above 50 to indicate monthly growth in general activity but the rate of growth is moderate at the very best. The reading compares with 52.3 for final May and a 51.9 for the May flash reading. A definite positive in this report was the new order index which was up 6 tenths from final May to 53.3 which is the best reading since March.
Markit PMI manufacturing index (final) Consensus Forecast for June 13: 52.3
Range: 52.0 to 52.6
The composite index from the ISM manufacturing survey was on the negative side for May. The ISM's manufacturing sample reports the weakest level of general activity since June 2009 as the May PMI fell to 49.0 to signal monthly contraction versus April. New orders fell substantially, from 52.3 to 48.8 for the lowest reading since July last year. Backlog orders were also down, 5 points lower to 48.0 for the lowest reading since January.
ISM manufacturing composite index Consensus Forecast for June 13: 50.5
Range: 49.0 to 51.5
Construction spending in April rebounded 0.4 percent in April after dropping 0.8 percent in March. The April gain was led by private nonresidential outlays which advanced 2.2 percent after dipping 1.1 percent in March. Private residential slipped 0.1 percent after gaining 1.4 percent in March. Weakness was in non-new housing spending which fell 3.3 percent in April, following a 0.2 percent rise the month before. For new housing, one-family outlays gained 1.4 percent after a 2.2 percent boost the month before and multifamily spending rose 1.7 percent in April after a 2.1 percent boost the prior month. Public outlays fell 1.2 percent, following a drop of 2.9 percent in March.
Construction spending Consensus Forecast for May 13: +0.6 percent
Range: -0.1 to +1.2 percent
Sales of total light motor vehicles in May rose 2.6 percent to an annual rate of 15.3 million units. This followed a 2.3 percent decline in April. The May gain was split about evenly between cars and trucks and between imports and domestics. Sales of domestic-made vehicles came in at a 12.1 million rate versus April's 11.9 million.
Motor vehicle domestic sales Consensus Forecast for June 13: 12.2 million-unit rate
Range: 11.9 to 12.5 million-unit rate
Motor vehicle total sales Consensus Forecast for June 13: 15.5 million-unit rate
Range: 15.1 to 15.8 million-unit rate
Factory orders in April rebounded 1.0 percent but followed a revised 4.7 percent decline in March. When stripping out transportation, which includes the volatile aerospace component, new orders slipped 0.1 percent and underscored the flat conditions. Positives in the report included strong order gains for capital goods categories. Total unfilled orders were also a positive, up 0.3 percent but following a 0.6 percent decline in the prior month. More recently, new factory orders for durables in May jumped 3.6 percent, following a matching 3.6 percent spike the month before. The transportation component surged 10.2 percent (largely aircraft) after an 8.3 percent boost in April. Outside of transportation, component strength for durables in May was mostly broad based.
Factory orders Consensus Forecast for June 13: +2.0 percent
Range: +0.4 to +4.9 percent
ADP private payroll employment gained 135,000 in May versus a revised 113,000 in April. The BLS comparable for private employment later posted at 178,000 for May.
ADP private payrolls Consensus Forecast for June 13: 165,000
Range: 130,000 to 190,000
The U.S. international trade gap in April widened on a rise in imports—surprisingly for non-petroleum imports. The trade gap grew to $40.3 billion from $37.1 billion in March. The consensus forecast was for a deficit of $41.2 billion. Exports rose 1.2 percent after decreasing 1.0 percent in March. Imports rebounded 2.4 percent after declining 3.7 percent the month before. The worsening in the trade gap was primarily due to the nonpetroleum goods deficit which expanded to $37.8 billion in April from $33.7 billion the month before. The petroleum deficit improved to $19.7 billion from $20.5 billion in March. The services surplus was unchanged at $18.3 billion.
International trade balance Consensus Forecast for May 13: -$40.8 billion
Range: -$45.0 billion to -$35.9 billion
The composite index from the ISM non-manufacturing survey rose 6 tenths in May to 53.7. Business activity rose 1.5 points to 56.5 and—in a key plus—new orders also rose 1.5 points to 56.0 for the best reading since February. But employment, at 50.1, was dead flat and showed its weakest reading since July last year. Backlog orders were up slightly.
ISM non-manufacturing composite index Consensus Forecast for June 13: 54.5
Range: 53.5 to 55.5
U.S. Holiday: Independence Day. All Markets Closed.
Nonfarm payroll employment in May increased 175,000 after rising a revised 149,000 in April. The unemployment rate edged up to 7.6 percent from 7.5 percent in April. Expectations were for a 7.5 percent unemployment rate. Turning back to payroll data, private payrolls rose 178,000 after gaining 157,000 in April. Wages were unchanged in May after a 0.2 percent increase in April.
Nonfarm payrolls Consensus Forecast for June 13: 161,000
Range: 145,000 to 200,000
Private payrolls Consensus Forecast for June 13: 175,000
Range: 150,000 to 200,000
Unemployment rate Consensus Forecast for June 13: 7.5 percent
Range: 7.4 to 7.6 percent
Average workweek Consensus Forecast for June 13: 34.5 hours
Range: 34.4 to 34.6 hours
Average hourly earnings Consensus Forecast for June 13: +0.2 percent
Range: +0.1 to +0.3 percent
Initial jobless claims for the June 22 week fell 9,000 to 346,000. The 4-week average, at 345,750, was down 2,750 in the week and is very slightly below the month-ago comparison. Continuing claims likewise showed slight improvement, at 2.965 million for a 1,000 decline in data for the June 15 week. The 4-week average, at 2.973 million, was down 10,000.
Jobless Claims Consensus Forecast for 6/29/13: 345,000
Range: 335,000 to 355,000
R. Mark Rogers is the author of The Complete Idiot’s Guide to Economic Indicators, Penguin Books.
Econoday Senior Writer Mark Pender contributed to this article.
|
