|
This past week, equities dropped sharply during the Fed chairman’s press conference as tapering of quantitative easing is on the horizon. But there really was no new information on Fed policy—reaction was either overreaction or a correction to ignoring earlier telegraphs by the Fed. For the recovery, it continues at a modest pace.
 Equities dropped sharply this past week on worries about the potential impact of an earlier than expected Fed tapering of asset purchases for mortgage-backed securities and longer-term Treasuries. Equities dropped sharply this past week on worries about the potential impact of an earlier than expected Fed tapering of asset purchases for mortgage-backed securities and longer-term Treasuries.
But stocks initially were positive ahead of the Fed’s policy announcement on Wednesday. On Monday, stocks were bolstered by data showing that sentiment among U.S. home builders has jumped this month. On Tuesday, equities rose as investors were optimistic about the outlook for the Federal Reserve's economic stimulus policies to continue. This was despite housing starts rising less than expected.
 Wednesday was the tipping point. The Fed’s FOMC policy statement was near expectations and only minimally weighed down on equities. But 30 minutes later, traders were not happy with the Fed chairman’s press conference. Chairman Ben Bernanke stated there is the “possibility” that asset purchases could slow later this year and end next year if conditions are appropriate. He emphasized the conditional—on economic news. But stocks fell sharply on the view that his comments indicated that quantitative easing might slow sooner than later although that view is highly debatable. Nonetheless, that view sent stocks down significantly on Wednesday. Wednesday was the tipping point. The Fed’s FOMC policy statement was near expectations and only minimally weighed down on equities. But 30 minutes later, traders were not happy with the Fed chairman’s press conference. Chairman Ben Bernanke stated there is the “possibility” that asset purchases could slow later this year and end next year if conditions are appropriate. He emphasized the conditional—on economic news. But stocks fell sharply on the view that his comments indicated that quantitative easing might slow sooner than later although that view is highly debatable. Nonetheless, that view sent stocks down significantly on Wednesday.
Equities dropped even more on Thursday on further worries over Fed policy. But overseas news also came into play. Investors were unnerved by reports that Chinese banks had become reluctant to lend to one another, causing interest rates in the interbank market to spike to punishingly high levels. Disappointing Chinese flash manufacturing PMI also exerted downward pressure.
Stocks made a slight comeback on Friday, essentially on bottom fishing and no notable economic news.
Equities were down this past week. The Dow was down 1.8 percent; the S&P 500, down 2.1 percent; the Nasdaq, down 1.9 percent; the Russell 2000, down 1.8 percent; and the Wilshire 5000, down 2.2 percent.
For the year-to-date, major indexes are up as follows: the Dow, up 12.9 percent; the S&P 500, up 11.7 percent; the Nasdaq, up 11.2 percent; the Russell 2000, up 13.5 percent; and the Wilshire 5000, up 12.0 percent.
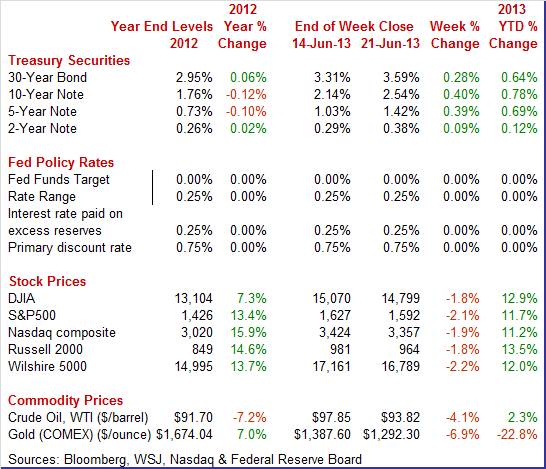
Weekly percent change column reflects percent changes for all components except interest rates. Interest rate changes are reflected in simple differences.
 Treasury yields were up this past week with mid- and longer-term yields up sharply. It was all about the market view of potential Fed tapering of asset purchases. The biggest move of the week was Wednesday after the Fed chairman’s press conference which was interpreted to indicate (rightly or wrongly) tapering of asset purchases sooner than earlier believed. This view continued to lift rates on Thursday and Friday. Little else mattered in the bond market this past week. Treasury yields were up this past week with mid- and longer-term yields up sharply. It was all about the market view of potential Fed tapering of asset purchases. The biggest move of the week was Wednesday after the Fed chairman’s press conference which was interpreted to indicate (rightly or wrongly) tapering of asset purchases sooner than earlier believed. This view continued to lift rates on Thursday and Friday. Little else mattered in the bond market this past week.
For this past week Treasury rates were up as follows: 3-month T-bill, up 1 basis point; the 2-year note, up 9 basis points; the 5-year note, up 39 basis points; the 7-year note, up 44 basis points; the 10-year note, up 40 basis points; and the 30-year bond, up 28 basis points.
 The spot price of West Texas Intermediate dropped significantly this past week—and it was only partly due to the Fed. After three relatively quiet days at the start of the week, crude fell $2-1/5 per barrel on Wednesday due to a disappointingly weak manufacturing PMI for China. Worries about Fed tapering added to crude weakness. Spot WTI rose another $1-1/2 on Friday on a rise in the dollar which was related to expectations that the Fed will cut asset purchases in the near future. The spot price of West Texas Intermediate dropped significantly this past week—and it was only partly due to the Fed. After three relatively quiet days at the start of the week, crude fell $2-1/5 per barrel on Wednesday due to a disappointingly weak manufacturing PMI for China. Worries about Fed tapering added to crude weakness. Spot WTI rose another $1-1/2 on Friday on a rise in the dollar which was related to expectations that the Fed will cut asset purchases in the near future.
Net for the week, the spot price for West Texas Intermediate dropped $4.03 per barrel to settle at $93.82.
This past week, Fed news outweighed other indicator news that was net positive for the recovery. The problem is that markets may or may not be misinterpreting Fed decisions.
 In the statement released at the conclusion of their two day meeting, the FOMC left its fed funds rate range at zero to 0.25 percent and left its guidance unchanged based on general thresholds of 6.5 percent unemployment and 2.5 percent inflation expectations. Quantitative easing continues at $85 billion per month for now. The characterization of the economy did not change—economic activity has been expanding at a “moderate pace.” The FOMC noted some improvement in the labor market even though unemployment remains elevated. However, more attention was called to inflation which is running below target. The Fed continued to emphasize that it is data driven and will take into account ongoing economic conditions when deciding to change policy. In the statement released at the conclusion of their two day meeting, the FOMC left its fed funds rate range at zero to 0.25 percent and left its guidance unchanged based on general thresholds of 6.5 percent unemployment and 2.5 percent inflation expectations. Quantitative easing continues at $85 billion per month for now. The characterization of the economy did not change—economic activity has been expanding at a “moderate pace.” The FOMC noted some improvement in the labor market even though unemployment remains elevated. However, more attention was called to inflation which is running below target. The Fed continued to emphasize that it is data driven and will take into account ongoing economic conditions when deciding to change policy.
At his press conference, Fed Chairman Bernanke reiterated many of the principles from the prior statement. He did clarify that the numerical guidance numbers for guidance were "thresholds" and not "triggers." Bernanke stated that the Fed will not sell agency MBS to normalize policy. He indicated that policy will depend on incoming economic data but that if incoming data match forecasts, tapering could occur later this year. He sees tapering as slowing in easing or taking a foot off the gas pedal and not applying the brakes. Bernanke sees any actual, significant change in policy rates as still far in the future. He noted that there was no change in policy but just clarification. The Fed sees the economy moving forward despite headwinds from fiscal drag. He stated that if the Fed overestimates growth, then it will re-adjust policy, including for QE. There is no fixed deadline for asset purchases. However, he stated that asset purchases could end in 2014 if economic conditions are supportive. Bernanke emphasized that policy is data dependent. He sees that downside risks to the economy have diminished.
However, it has not sunk in on the markets that the new dissent by James Bullard was in the opposite direction. Bullard warned that the Committee should signal more strongly its willingness to defend its inflation goal in light of recent low inflation readings. Esther George, who also dissented, cited concern that the continued high level of monetary accommodation is increasing the risks of future economic and financial imbalances and, over time, could cause an increase in long-term inflation expectations.
Overall, the latest FOMC news indicates somewhat greater inclination to continue quantitative easing based on comments on low inflation and on new dissent toward continued QE.
 The numbers have been somewhat volatile, but on average, trending upward. Housing starts in May rebounded a monthly 6.8 percent after plunging 14.8 percent in April. The May starts annualized level of 0.914 million units was up 28.6 percent on a year-ago basis. The numbers have been somewhat volatile, but on average, trending upward. Housing starts in May rebounded a monthly 6.8 percent after plunging 14.8 percent in April. The May starts annualized level of 0.914 million units was up 28.6 percent on a year-ago basis.
The gain in starts was led by a monthly 21.6 percent jump in the multifamily component after a 32.2 percent fall in April. The single-family component rose 0.3 percent, following a 4.2 percent decrease in April.
 By region, the gain in May starts was led by the South with a 17.8 percent boost and with the West Census Region improving 5.7 percent. Census Regions for the Midwest and Northeast fell 13.7 percent and 9.0 percent, respectively. By region, the gain in May starts was led by the South with a 17.8 percent boost and with the West Census Region improving 5.7 percent. Census Regions for the Midwest and Northeast fell 13.7 percent and 9.0 percent, respectively.
Permits dipped after a very strong April. Permits eased 3.1 percent in May after jumping 12.9 percent the month before. May's annualized pace of 0.974 million units was up 20.8 percent on a year-ago basis.
Overall, both single-family and multifamily components are adding-on average-to moderate growth in the housing sector. This is one sector of the economy where the Fed's quantitative easing is showing a clear and positive impact.
Manufacturing data have largely been going in the same direction, trending slowing downward. The flash PMI for June, at 52.2, remained above 50 to indicate monthly growth in general activity but the rate of growth is moderate at the very best. The reading compares with 52.3 for final May and a 51.9 for the May flash reading.
A definite positive in this report is the new order index which is up 6 tenths from final May to 53.3 which is the best reading since March. Backlogs are up slightly which is another positive, but new export orders are down, at 47.5 versis 49.8 for final May and below 50 to indicate monthly contraction. This is a reminder that global markets are weak.
Other readings include a respectable rate of output, a slight rise in inventories, but a flat rate of hiring.
 The New York Fed and Philly Fed manufacturing surveys improved in June at the headline level but Empire was soft in detail while Philly was more positive. The New York Fed and Philly Fed manufacturing surveys improved in June at the headline level but Empire was soft in detail while Philly was more positive.
The Empire State index may have, at 7.84, jumped back into the plus column but all the key sub-indexes were well in the negative camp to point to contraction underway in the region's manufacturing sector this month.
New orders, at minus 6.69, were down for a second straight month with contraction in backlog orders very deep, at minus 14.52. Shipments were at minus 11.77 with inventories at minus 11.29 in what are also deep rates of monthly contraction. These readings extend what is a very soft run for data out of the manufacturing sector.
 The headline for the Empire State report, as it is for the Philly Fed report, is not the sum of components, just a single reading from a single subjective question on general month-to-month conditions. The latest report underscores this methodological detail. The headline for the Empire State report, as it is for the Philly Fed report, is not the sum of components, just a single reading from a single subjective question on general month-to-month conditions. The latest report underscores this methodological detail.
In contrast, details from the Philly Fed are more favorable.
The Philly Fed index surged to 12.5 in June versus minus 5.2 in May. But this report, unlike Empire State, is backed up by one key detail -- new orders which surged to 16.6 from May's minus 7.9. This was a substantial gain that points to rising activity through the region's manufacturing sector in the months ahead.
 CPI inflation was essentially at expectations, showing only modest inflation pressures. Inflation numbers are letting the Fed keep monetary policy loose for now. CPI inflation was essentially at expectations, showing only modest inflation pressures. Inflation numbers are letting the Fed keep monetary policy loose for now.
The consumer price index for May made only a partial rebound at the headline level, rising 0.1 percent after falling 0.4 percent in April. The core CPI—excluding food and energy—rose 0.2 percent versus 0.1 percent in April.
 By major components outside the core, energy rose 0.4 percent after a drop of 4.3 percent in April. Gasoline was unchanged after decreasing 8.1 percent. Electricity and natural gas were responsible for the rise in energy. The food component dipped 0.1 percent in May, following a rise of 0.2 percent the month before. By major components outside the core, energy rose 0.4 percent after a drop of 4.3 percent in April. Gasoline was unchanged after decreasing 8.1 percent. Electricity and natural gas were responsible for the rise in energy. The food component dipped 0.1 percent in May, following a rise of 0.2 percent the month before.
For the core measure, shelter costs rose 0.3 percent. Advances in the indexes for airline fares, recreation, and apparel also contributed to the rise in the core. In contrast, the indexes for medical care and used cars and trucks declined in May.
Year-on-year, overall CPI inflation firmed to 1.4 percent from 1.1 percent in April (seasonally adjusted). The core rate held steady at 1.7 percent. On an unadjusted year-ago basis, the headline CPI in May was up 1.4 percent and the core was up 1.7 percent.
Once more, both the headline and core CPI inflation rates remain below the Fed's "threshold" of 2.5 percent for potential changes in monetary policy. The CPI and the later released PCE inflation index are getting more attention from the Fed as indicated by the dissent of James Bullard at the latest FOMC meeting.
 The recovery may be sluggish ahead. The index of leading economic indicators inched only 0.1 percent higher in May with strength confined entirely to the financial components: interest rates, the stock market, and credit activity. The recovery may be sluggish ahead. The index of leading economic indicators inched only 0.1 percent higher in May with strength confined entirely to the financial components: interest rates, the stock market, and credit activity.
Other readings were flat to negative with unemployment claims exerting the most drag. Factory readings were mildly negative, underscoring the uncertain outlook for the manufacturing sector, and building permits are also a negative though the outlook for the housing market, highlighted by the latest existing home sales report, was very strong.
Though May was on the soft side, the April report was very strong and was revised upward by 2 tenths to a gain of 0.8 percent. Still the latest reading is a reminder that the economic outlook is uneven.
The Fed is still tentative on quantitative easing going into tapering mode—data dependent. This is not new news—it is just that markets finally noticed. But the new and second dissent at the FOMC suggests that tapering may not be so early. The economy remains much as was with housing continuing to improve, manufacturing soft, and inflation tepid.
Two key sectors get updates this week. The consumer sector has oscillated in various measures, including jobless claims, payroll gains, and income. The personal income report on Thursday is likely the week’s highlight—indicating whether the consumer is still spending and has the income to spend. Housing has been providing lift to the recovery with existing home sales jumping last week. This week’s news on this front will include home prices from FHFA and Case-Shiller and also new home sales from Commerce.
The Chicago Fed National Activity Index in April fell to minus 0.53 versus an already weak minus 0.23 in March. In both months, manufacturing production fell, down 0.4 percent in April following a 0.3 percent decline in March (manufacturing component in the industrial production report). The consumer & housing sector has also been bumpy and was the second largest drag on national activity in April. On jobs, the better-than-expected April employment report failed to make much impact on the index as employment was neutral in the April report compared to a fractional positive in March.
Chicago Fed National Activity Index Consensus Forecast for May 13: -0.25
Range: -0.30 to -0.10
The Dallas Fed general business activity index in its Texas manufacturing survey was mixed in May as general business conditions were seen as still negative but detail in the report indicated a return to positive growth. Perceptions of broader business conditions continued to worsen in May. The general business activity index remained negative but moved up five points to minus 10.5. The company outlook index declined from minus 2.2 to minus 6.8, reaching its lowest level since July 2010. However, Texas factory activity increased sharply in May, according to the production measure. The production index rose from minus 0.5 to 11.2, indicating a notable pickup in output. The new orders index rebounded to 6.2 after falling to minus 4.9 in April.
Dallas Fed general business activity index Consensus Forecast for June 13: 0.0
Range: -5.0 to +1.5
Durable goods orders in April rebounded 3.5 percent after dropping a sharp 5.9 percent in March. The transportation component gained 8.4 percent after falling 15.0 percent in March. Strength for April was largely in aircraft as defense aircraft jumped sharply, nondefense aircraft partially rebounded, and motor vehicles advanced. Excluding transportation, durables orders rebounded 1.5 percent, following a decline of 1.6 percent the month before. Outside of transportation, component strength for April was widespread. All major industries showed gains but all major industries had declined in March. Numbers reflect revisions from the more recent total factory orders report.
New orders for durable goods Consensus Forecast for May 13: +3.3 percent
Range: +0.3 percent to +9.2 percent
New orders for durable goods, ex-trans., Consensus Forecast for May 13: -0.1 percent
Range: -1.5 percent to +0.9 percent
The FHFA purchase only house price index for March advanced 1.3 percent after improving 0.9 percent the month before. The March boost was led by the Pacific region, increasing 2.3 percent. All nine Census regions posted gains in the latest month with the softest rise being 0.5 percent in the West South Central region. House prices according to the FHFA measure have risen for eight consecutive months. The year-on-year rate for Mark improved to plus 7.2 percent versus 7.1 percent for the month before.
FHFA purchase only house price index Consensus Forecast for April 13: +1.2 percent
Range: +0.5 to +1.5 percent
The S&P/Case-Shiller 20-city home price index (SA) showed a very strong 1.1 percent monthly adjusted increase in March home prices for a fourth straight gain over 1.0 percent which is the strongest run since the boom days of 2005. The year-on-year increase of 10.9 percent was the first double-digit gain since May 2006. Unadjusted data, which are subject to strong monthly seasonal effects, showed a 1.4 percent 20-city jump versus a March gain of 0.3 percent. The year-on-year unadjusted rate, which is much less subject to seasonal effects, shows the same 10.9 percent gain as the adjusted series.
The S&P/Case-Shiller 20-city HPI (SA, m/m) Consensus Forecast for April 13: +1.5 percent
Range: +0.6 to +2.9 percent
The S&P/Case-Shiller 20-city HPI (NSA, m/m) Consensus Forecast for April 13: +1.1 percent
Range: +1.0 to +2.0 percent
The S&P/Case-Shiller 20-city HPI (NSA, y/y) Consensus Forecast for April 13: +10.9 percent
Range: +10.4 to +12.3 percent
New home sales rose 2.3 percent in April to a 454,000 annual rate. Revisions to March and February showed a very strong net gain of 45,000 from initial levels that points to much greater than expected activity in prior months. Price readings were up significantly, up 8.3 percent in April alone for the median price to a new record $271,600. The average price, at $330,800 and also at a new record, is up 15.4 percent in the month. These readings, which are not based on repeat transactions, can be volatile but the year-on-year gain, at 14.9 percent for both the median and the average, is very convincing. The latest price reading suggests that there was a significant shift in sales toward the high end market.
New home sales Consensus Forecast for May 13: 460 thousand-unit annual rate
Range: 435 thousand to 475 thousand-unit annual rate
The Conference Board's consumer confidence index jumped 7.2 points in May to a recovery best level of 76.2. Adding to the general showing of strength was a 9 tenths upward revision to April to 69.0. The assessment of the present situation posted at a recovery best of 66.7, up nearly 6 points from April. This run includes jobs as more say jobs are plentiful, 10.8 percent versus April's 9.7 percent, and fewer say jobs are hard to get, at 36.1 percent for an 8 tenth improvement from April's 36.9 percent. The assessment of expectations, at 82.4 for an 8.1 point jump, has been higher this recovery, but not by much. Fewer consumers were concerned over their income outlook and more see jobs opening up six months from now. Expectations for general business conditions showed significant improvement over April.
Consumer confidence Consensus Forecast for June 13: 75.0
Range: 72.5 to 79.5
The Richmond Fed manufacturing index in May stood at minus 2 to indicate a lower rate of activity than April when the index was at an even steeper minus 6. Negatives swept May's readings led by new orders, at minus 10, and backlog orders, at minus 11. Shipments were positive this month at 8 but may not stay positive given the weakness in orders. The employment index swung to negative 3 from plus 3 in April. Also, the workweek contracted faster at minus 6 versus minus 3 the month before.
Richmond Fed manufacturing index Consensus Forecast for June 13: 2
Range: 0 to 4
GDP growth for the first quarter was nudged down to an annualized rate of 2.4 percent compared to the initial estimate of 2.5 percent and compared to a fourth quarter rise of 0.4 percent. Expectations were for 2.5 percent. Final sales of domestic product posted a revised gain of 1.8 percent versus the initial estimate of 1.5 percent. This series advanced 1.9 percent in the fourth quarter. Final sales to domestic producers (which exclude net exports) were unrevised at 1.9 percent. This followed a 1.5 percent gain in the fourth quarter. Headline inflation for the GDP price index was a marginally softer at 1.1 percent versus the advance estimate of 1.2 percent annualized inflation rate. When excluding food and energy, inflation was revised to 1.6 percent, compared the advance estimate of 1.5 percent.
Real GDP Consensus Forecast for third estimate Q1 13: +2.4 percent annual rate
Range: +2.1 to +2.6 percent annual rate
GDP price index Consensus Forecast for third estimate Q1 13: +1.1 percent annual rate
Range: +1.1 to +1.2 percent annual rate
Initial jobless claims jumped 18,000 in the June 15 week to a 354,000 level. Because of the sharpness of the latest jump, the comparison of 4-week averages for the sample weeks is not positive, at 348,250 versus 340,500. This comparison does not point to higher payroll growth or a lower unemployment rate this month. Continuing claims were mixed in the latest data which are for the June 8 week. Continuing claims fell 40,000 to a new recovery low of 2.951 million but the 4-week average is up, rising 7,000 and off a recovery low to 2.979 million. The unemployment rate for insured workers is holding at a recovery low of 2.3 percent.
Jobless Claims Consensus Forecast for 6/22/13: 345,000
Range: 335,000 to 350,000
Personal income in April was flat after a 0.3 percent rise the month before. The important wages and salaries component was unchanged, following an increase of 0.2 percent in March. Weakness came from a decline in goods-producing industries and an essentially flat government component. Personal spending in April fell 0.2 percent after edging up 0.1 percent the month before. The dip was led by a drop in nondurables. Also, the large services component barely rose. Durables posted a modest gain. In real terms, spending was not as bad, rising 0.1 percent in April, following a 0.2 percent increase the prior month. Headline inflation was pulled down by lower gasoline prices—but core price inflation also was sluggish. The PCE price index fell 0.3 percent in April after slipping 0.1 percent the prior month. Core PCE price inflation eased to no change, following a 0.1 percent rise in March.
Personal income Consensus Forecast for May 13: +0.2 percent
Range: +0.1 to +0.4 percent
Personal consumption expenditures Consensus Forecast for May 13: +0.4 percent
Range: +0.1 to +0.5 percent
PCE price index Consensus Forecast for May 13: +0.1 percent
Range: 0.0 to +0.2 percent
Core PCE price index Consensus Forecast for May 13: +0.1 percent
Range: +0.1 to +0.2 percent
The pending home sales index rose only 0.3 percent in April, following a 1.5 percent boost the month before. According to the National Association of Realtors, home contract activity was at the highest level since the index hit 110.9 in April 2010, immediately before the deadline for the home buyer tax credit. Pending sales have been above year-ago levels for the past 24 months.
Pending home sales Consensus Forecast for May 13: +1.0 percent
Range: -0.6 to +5.0 percent
The Kansas City Fed manufacturing index in May picked up with the composite index at plus 2. Though this rate of monthly growth is modest, it's a big improvement from contractionary minus 5 readings in both April and March. Details for May showed a rise for new orders and for production. Delivery times were also higher which points to activity in the supply chain. But other readings point to weakness including another sharp contraction for backlogs and another contraction in hiring. Export orders were also weak.
Kansas City Fed manufacturing index Consensus Forecast for June 13: 4.0
Range: 0.0 to 7.0
The Chicago PMI in its May report once again showed its volatility, shooting to 58.7 versus a contractionary 49.0 in April to indicate very strong monthly growth. The May reading was the strongest since March last year while the April reading was the weakest since September 2009. Just about every reading in this report was sharply higher led by production at a whopping 62.7 versus April's 49.9, new orders at 58.1 versus 53.2, backlog orders at 53.1 versus 40.6, employment at 56.9 versus 48.7, and supplier deliveries which jumped more than 4 points to signal slowing in the supply chain.
Chicago PMI Consensus Forecast for June 13: 55.0
Range: 52.0 to 59.0
The Reuter's/University of Michigan's consumer sentiment index in June (preliminary) made a dip back to 82.7 versus May's 84.. The consumer's fundamental outlook for the economy was little changed with the expectations component actually rising nearly 1 point to 76.7 which was near a recovery high. A separate reading on the 12-month economic outlook was up 2 points to 102. But there was weakness in the report and it was in the assessment of current conditions, which was down nearly 6 points from May to 92.1.
Consumer sentiment Consensus Forecast for final June 13: 83.0
Range: 81.0 to 85.3
R. Mark Rogers is the author of The Complete Idiot’s Guide to Economic Indicators, Penguin Books.
Econoday Senior Writer Mark Pender contributed to this article.
|
