|
Economic news was mixed. More importantly, concern about potential changes in the Fed’s quantitative easing held markets’ attention.
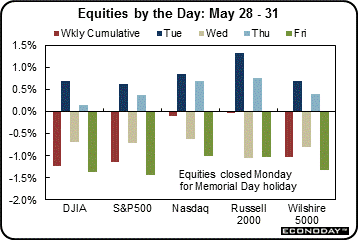 This past week the broad markets were down notably. After a Memorial Day holiday on Monday, the week got off to a good start based on favorable economic news as consumer confidence unexpectedly improved sharply while Case-Shiller home prices rose and topped expectations. Earlier in the day from overseas, the Bank of Japan and the European Central Bank reaffirmed that their accommodative policies would remain in place, helping the indices to recover from the prior week's decline. This past week the broad markets were down notably. After a Memorial Day holiday on Monday, the week got off to a good start based on favorable economic news as consumer confidence unexpectedly improved sharply while Case-Shiller home prices rose and topped expectations. Earlier in the day from overseas, the Bank of Japan and the European Central Bank reaffirmed that their accommodative policies would remain in place, helping the indices to recover from the prior week's decline.
 Equities declined significantly on Wednesday. With no new economic data, investors focused their attention on the Fed and what it might or might not do in terms of speeding up or not the time table for tapering quantitative easing. Rising Treasury yields contributed to the unease. Equities pared losses after Fed Bank of Boston President Eric Rosengren said significant accommodation is currently appropriate. Equities declined significantly on Wednesday. With no new economic data, investors focused their attention on the Fed and what it might or might not do in terms of speeding up or not the time table for tapering quantitative easing. Rising Treasury yields contributed to the unease. Equities pared losses after Fed Bank of Boston President Eric Rosengren said significant accommodation is currently appropriate.
On Thursday, it was the Fed again—but indirectly. First quarter GDP growth was revised down marginally and markets interpreted this as bad news for the Fed on the economy—meaning good news for equities as the odds were seen going up for not tapering soon. This view took hold even though the component detail in GDP actually improved modestly. A rise in jobless claims added to the belief that the Fed will continue quantitative easing as is.
At close of the week, it again was the Fed indirectly but in reverse of Thursday. Both consumer sentiment and the Chicago PMI were stronger than expected. This increased speculation that the Fed might indeed taper before year’s end. Personal income and spending were sluggish but not far from expectations. Stocks retreated moderately for most of the day. Losses accelerated late in the session on profit taking and on rebalancing of some MSCI indexes which affect some ETFs.
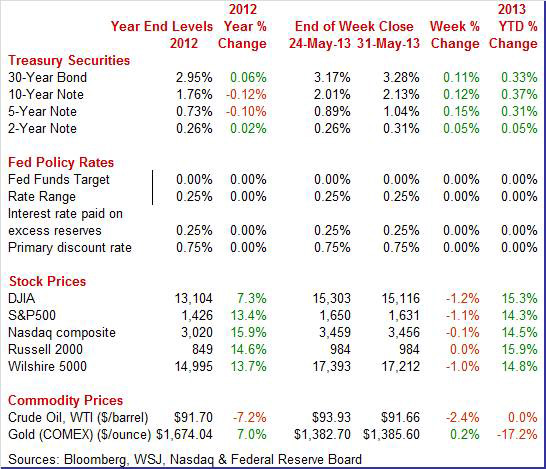
 Equities were down this past week. The Dow was down 1.2 percent; the S&P 500, down 1.1 percent; the Nasdaq, down 0.1 percent; the Russell 2000, fractionally down but rounded to 0.0 percent; and the Wilshire 5000, down 1.0 percent. Equities were down this past week. The Dow was down 1.2 percent; the S&P 500, down 1.1 percent; the Nasdaq, down 0.1 percent; the Russell 2000, fractionally down but rounded to 0.0 percent; and the Wilshire 5000, down 1.0 percent.
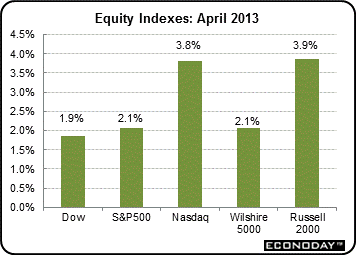
Despite ending the month on a sour note, equities were up notably in May. The Dow was up 1.9 percent; the S&P 500, up 2.1 percent; the Nasdaq, up 3.8 percent; the Russell 2000, up 3.9 percent; and the Wilshire 5000, up 2.1 percent.
For the year-to-date, major indexes are up as follows: the Dow, up 15.3 percent; the S&P 500, up 14.3 percent; the Nasdaq, up 14.5 percent; the Russell 2000, up 15.9 percent; and the Wilshire 5000, up 14.8 percent.
Weekly percent change column reflects percent changes for all components except interest rates. Interest rate changes are reflected in simple differences.
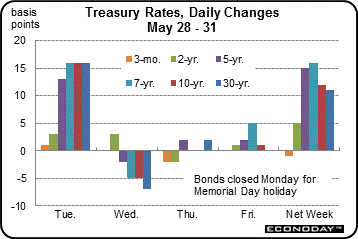 Treasury yields broke out of their recent run in a narrow range as rates rose significantly for the week. The biggest gains were Tuesday on unexpectedly healthy home prices and consumer confidence along with skittishness about early Fed tapering in quantitative easing. Yields slipped moderately Wednesday on comments by Fed Bank of Boston President Eric Rosengren that significant monetary accommodation should continue. Treasury yields broke out of their recent run in a narrow range as rates rose significantly for the week. The biggest gains were Tuesday on unexpectedly healthy home prices and consumer confidence along with skittishness about early Fed tapering in quantitative easing. Yields slipped moderately Wednesday on comments by Fed Bank of Boston President Eric Rosengren that significant monetary accommodation should continue.
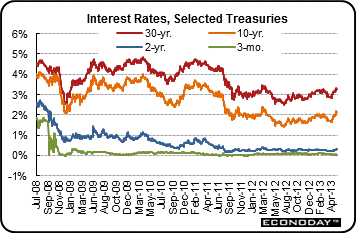 Rates were little changed Thursday. Yields gained notably Friday on strong economic data for consumer sentiment and the Chicago PMI and on a return of increased nervousness about early tapering. Rate increases were cut somewhat late in the session on flight to safety from the selloff in stocks. Rates were little changed Thursday. Yields gained notably Friday on strong economic data for consumer sentiment and the Chicago PMI and on a return of increased nervousness about early tapering. Rate increases were cut somewhat late in the session on flight to safety from the selloff in stocks.
For this past week Treasury rates were up as follows: the 2-year note, up 5 basis points; the 5-year note, up 15 basis points; the 7-year note, up 16 basis points; the 10-year note, up 12 basis points; and the 30-year bond, up 11 basis points. The 3-month T-bill slipped 1 basis point.
Worries about an early tapering of quantitative easing have lifted long-term rates.
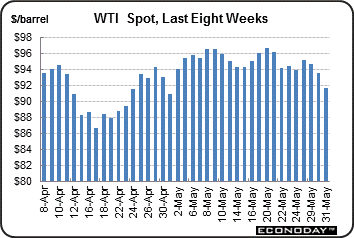 This past week, the spot price of crude was down moderately. Starting Tuesday, crude was up a little over a dollar a barrel on the day’s favorable U.S. economic news. Crude eased Wednesday on worries about Fed tapering. Also, the IMF downgraded the outlook for economic growth for China. This past week, the spot price of crude was down moderately. Starting Tuesday, crude was up a little over a dollar a barrel on the day’s favorable U.S. economic news. Crude eased Wednesday on worries about Fed tapering. Also, the IMF downgraded the outlook for economic growth for China.
Spot WTI fell a dollar a barrel Thursday on a build in oil inventories seen in the weekly petroleum status report, delayed one day due to the Monday holiday. Crude fell just over $2 a barrel at week’s close on news that OPEC was keeping its output target unchanged and following equities down.
Net for the week, the spot price for West Texas Intermediate dropped $2.27 per barrel to settle at $91.66.
The recovery continues but at a soft pace—not just for the first quarter but also for the second quarter so far on average.
 Economic growth was marginally softer in the first quarter than earlier believed. Real GDP growth for the first quarter was nudged down to an annualized rate of 2.4 percent compared to the initial estimate of 2.5 percent and compared to a fourth quarter rise of 0.4 percent. Expectations were for 2.5 percent. Economic growth was marginally softer in the first quarter than earlier believed. Real GDP growth for the first quarter was nudged down to an annualized rate of 2.4 percent compared to the initial estimate of 2.5 percent and compared to a fourth quarter rise of 0.4 percent. Expectations were for 2.5 percent.
Final sales of domestic product posted a revised gain of 1.8 percent versus the initial estimate of 1.5 percent. This series advanced 1.9 percent in the fourth quarter. Final sales to domestic producers (which exclude net exports) were unrevised at 1.9 percent. This followed a 1.5 percent gain in the fourth quarter.
The biggest downward revision was to inventory investment which rose less than earlier estimated. Modest downward revisions were seen for residential investment and government purchases. The Commerce Department made upward revisions to net exports (imports revised down more than exports revised down), PCEs, and nonresidential fixed investment.
Headline inflation for the GDP price index was a marginally softer 1.1 percent versus the advance estimate of 1.2 percent annualized inflation rate. When excluding food and energy, inflation was revised to 1.6 percent, compared the advance estimate of 1.5 percent.
Looking at not the size of revisions but actual growth rates of GDP components, the picture is much as in the advance report. Consumer spending was the bright spot, rising 3.4 percent annualized—the fastest rate of growth since the fourth quarter of 2010. However, about one-fourth of the growth came from increased utilities usage due to atypically cold weather. The latest monthly personal income report indicates slowing in spending in the second quarter.
In the business sector, spending on software and equipment lifted growth. Inventory growth was up notably from the fourth quarter, but businesses may not be stocking shelves at the first quarter pace if sales are softening.
Government purchases were the biggest drag on the first quarter due to cuts in government spending.
Overall, the headline number for GDP looks decent but the detail still shows soft demand for the first quarter. Much of the growth still came from inventory investment.
 The consumer sector may be losing some steam, according to the latest personal income report. In April both income and spending were weak. Inflation also was quite soft. Personal income in April was flat after a 0.3 percent rise the month before. The consumer sector may be losing some steam, according to the latest personal income report. In April both income and spending were weak. Inflation also was quite soft. Personal income in April was flat after a 0.3 percent rise the month before.
 The important wages and salaries component was unchanged, following an increase of 0.2 percent in March. Weakness came from a decline in goods-producing industries and an essentially flat government component. Services industries posted a moderate rise in wages and salaries but at substantially slower pace than in March. The important wages and salaries component was unchanged, following an increase of 0.2 percent in March. Weakness came from a decline in goods-producing industries and an essentially flat government component. Services industries posted a moderate rise in wages and salaries but at substantially slower pace than in March.
Consumer spending declined in April and it was not just a softening due to lower gasoline prices. Personal spending in April fell 0.2 percent after edging up 0.1 percent the month before. The dip was led by a drop in nondurables. Also, the large services component barely rose. Durables posted a modest gain.
In real terms, spending was not as bad, rising 0.1 percent in April, following a 0.2 percent increase the prior month. Still, April was sluggish in terms of spending.
Headline inflation was pulled down by lower gasoline prices—but core price inflation also was sluggish. The PCE price index fell 0.3 percent in April after slipping 0.1 percent the prior month. Analysts called for a 0.2 percent decrease. Core PCE price inflation eased to no change, following a 0.1 percent rise in March. Market expectations were for a 0.1 percent rise.

The latest inflation numbers may result in some Fed officials arguing that the risk of too low inflation has risen. Year-on-year, headline prices were up only 0.7 percent in April versus 1.0 percent in March. The core was up 1.1 percent, compared to 1.2 percent the month before. These figures are well below the Fed’s medium-term target of 2.0 percent. This certainly gives the Fed flexibility to maintain current monetary policy.
April clearly was not a good month for the consumer—other than lower gasoline prices, which have since risen somewhat. The best news out of the report is that the Fed will fell less pressure to taper quantitative easing sooner than later.
 While April numbers for income and consumer spending were not favorable, the latest readings on the consumer mood suggest that improvement could be ahead for May. While April numbers for income and consumer spending were not favorable, the latest readings on the consumer mood suggest that improvement could be ahead for May.
Rising home prices and a rising stock market are two key factors that are boosting consumer confidence. And a third factor is improvement in the jobs market—albeit not robust improvement.
The Conference Board’s consumer confidence index jumped 7.2 points in May to a recovery best level of 76.2. Adding to the general showing of strength is a 9 tenths upward revision to April to 69.0.
The assessment of the present situation is at a recovery best of 66.7, up nearly 6 points from April in a reading that hints at broad strength for May's run of economic data. This run includes jobs as more say jobs are plentiful, 10.8 percent versus April's 9.7 percent, and fewer say jobs are hard to get, at 36.1 percent for an 8 tenth improvement from April's 36.9 percent.
The assessment of expectations, at 82.4 for an 8.1 point jump, has been higher this recovery, but not by much. Fewer consumers this month were concerned over their income outlook and more see jobs opening up six months from now. Expectations for general business conditions showed significant improvement over April.
Turning to the latest reading for the Reuters/University of Michigan report on the consumer mood, the consumer sentiment index is at a recovery high, reaching 84.5 and up a very big and higher-than-expected 8.1 points from April.
A breakdown between the first half, when the index came in at 83.7, and the second half shows the strongest acceleration taking in place in the first half but extending strongly, though at a slightly slower rate, through the second half where the implied reading is 85.3.
Both components of the composite—current conditions and expectations—showed strong gains with current conditions at a recovery best of 98.0. The comparison with April's 89.9 hints at improvement in the next set of readings on the consumer in June. Expectations at 75.8, have been higher, but not by much and that was in October and November which was before the series of shocks that began to hit confidence: the year-end fiscal cliff, the first-of-the-year payroll tax hike, and the March sequester.
While the unemployment rate is still notably high, a number of factors appear to have improved the consumer mood. First, it is the passing of just these shocks (at least the initial impacts) with no resulting economic disaster that is lifting spirits. Also, stock prices and home prices have been trending upward, boosting consumer wealth and confidence. Another factor lifting spirits is a lack of inflation which gives consumers more confidence in their spending power.
Measures of consumer spirits are all moving higher, either at recovery bests or testing recovery bests. The big question is whether the improved mood will translate into stronger spending. This may depend heavily on improvement in jobs gains (which have been modest) and income growth—improved spirits or not.
 The housing sector continues to improve but it could be better. Lack of homes on the market has been keeping down sales and driving up prices, a mix that looks to continue through June based on pending home sales which rose only 0.3 percent in April, following a 1.5 percent boost the month before. The housing sector continues to improve but it could be better. Lack of homes on the market has been keeping down sales and driving up prices, a mix that looks to continue through June based on pending home sales which rose only 0.3 percent in April, following a 1.5 percent boost the month before.
According to the National Association of Realtors, home contract activity was at the highest level since the index hit 110.9 in April 2010, immediately before the deadline for the home buyer tax credit. Pending sales have been above year-ago levels for the past 24 months.
A regional look shows the effect of tight inventory which is most severe in the West and where pending home sales fell 7.6 percent. Price data from the West, in reports such as Case-Shiller, have been showing the very sharpest gains. Home-price appreciation is a very big story right now in the economy and this report points to continued upward pressure.
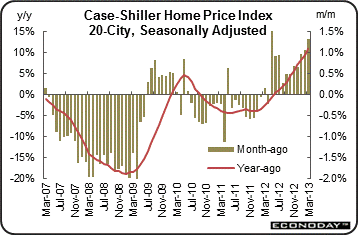 Home prices continue to recover due to moderately healthy sales and supply shortages. Home prices were accelerating strongly going into what proved to be a very strong March start to the spring housing season. Case-Shiller 20-city data showed a very strong 1.1 percent monthly adjusted increase in March home prices for a fourth straight gain over 1.0 percent which is the strongest run since the boom days of 2005. The year-on-year increase of 10.9 percent is the first double-digit gain since May 2006. Home prices continue to recover due to moderately healthy sales and supply shortages. Home prices were accelerating strongly going into what proved to be a very strong March start to the spring housing season. Case-Shiller 20-city data showed a very strong 1.1 percent monthly adjusted increase in March home prices for a fourth straight gain over 1.0 percent which is the strongest run since the boom days of 2005. The year-on-year increase of 10.9 percent is the first double-digit gain since May 2006.
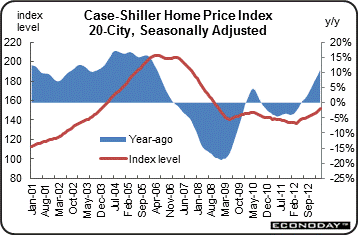 Unadjusted data, which are subject to strong monthly seasonal effects, showed a 1.4 percent 20-city jump versus a March gain of 0.3 percent. Note that housing activity picks up sharply as weather warms up, reflected here in the unadjusted March to April comparison. The year-on-year unadjusted rate, which is much less subject to seasonal effects, shows the same 10.9 percent gain as the adjusted series. Unadjusted data, which are subject to strong monthly seasonal effects, showed a 1.4 percent 20-city jump versus a March gain of 0.3 percent. Note that housing activity picks up sharply as weather warms up, reflected here in the unadjusted March to April comparison. The year-on-year unadjusted rate, which is much less subject to seasonal effects, shows the same 10.9 percent gain as the adjusted series.
Appreciation for home prices is increasingly living up to its advanced billing for 2013, emerging as a major plus for homeowner equity and a major plus for consumer confidence and hopefully consumer spending. However, home prices still have not returned to pre-recession levels. The March index (SA) was still 26.6 percent below the pre-recession peak in April 2006.
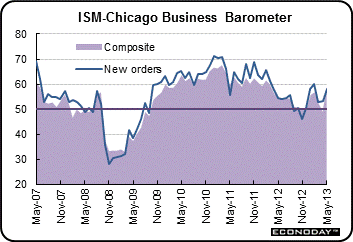 It has been hard to tell just what the status is of the Chicago area economy. The Chicago PMI is once again showing its volatility, shooting to 58.7 this month versus a contractionary 49.0 in April to indicate very strong monthly growth. The May reading is the strongest since March last year while the April reading was the weakest since September 2009. It has been hard to tell just what the status is of the Chicago area economy. The Chicago PMI is once again showing its volatility, shooting to 58.7 this month versus a contractionary 49.0 in April to indicate very strong monthly growth. The May reading is the strongest since March last year while the April reading was the weakest since September 2009.
Just about every reading in this report is sharply higher led by production at a whopping 62.7 vs April's 49.9, new orders at 58.1 vs 53.2, backlog orders at 53.1 vs 40.6, employment at 56.9 vs 48.7, and supplier deliveries which jumped more than 4 points to signal slowing in the supply chain.
This report, which covers all areas of the Chicago economy, not just manufacturing, may be suffering from a low sample size this month, which may or may not explain May’s great surge. Prior to the 9.7 point jump in May, the Chicago PMI fell 4.4 points in March and declined 3.4 points in April.
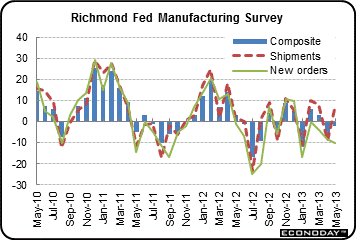 Contraction continued to hit the Richmond manufacturing district in May where the index was at minus 2 to indicate a lower rate of activity than April when the index was at an even steeper minus 6. Contraction continued to hit the Richmond manufacturing district in May where the index was at minus 2 to indicate a lower rate of activity than April when the index was at an even steeper minus 6.
Negatives swept May's readings led by new orders, at minus 10, and backlog orders, at minus 11. Shipments were positive this month at 8 but may not stay positive given the weakness in orders.
The employment index swung to negative 3 from plus 3 in April. Also, the workweek contracted faster at minus 6 versus minus 3 the month before
 The Dallas Fed manufacturing report was mixed in May as general business conditions were seen as still negative but detail in the report indicated a return to positive growth. The Dallas Fed manufacturing report was mixed in May as general business conditions were seen as still negative but detail in the report indicated a return to positive growth.
Perceptions of broader business conditions continued to worsen in May. The general business activity index remained negative but moved up five points to minus 10.5. The company outlook index declined from minus 2.2 to minus 6.8, reaching its lowest level since July 2010.
However, Texas factory activity increased sharply in May, according to the production measure. The production index-a key measure of state manufacturing conditions-rose from minus 0.5 to 11.2, indicating a notable pickup in output.
Stronger manufacturing activity was reflected in other survey measures as well. The new orders index rebounded to 6.2 after falling to minus 4.9 in April. Similarly, the shipments index bounced back to 3.1 after dipping to minus 0.4. The capacity utilization index came in at 6.4, up from 2.7 last month.
Labor market indicators reflected weaker labor demand. The employment index fell to minus 6.3 in May, registering its first negative reading this year and reaching its lowest level since November 2009. The hours worked index came in at minus 2.3, suggesting the workweek shrunk further.
The latest two regional reports—Richmond Fed and Dallas Fed—still show manufacturing somewhat sluggish—either still a little negative or a little positive.
Economic momentum from the first quarter was sluggish. Since then, the latest monthly numbers are mixed. Notably, the consumer sector poses a quandary to some degree with confidence up but spending flat—though for differing months. Housing is improving although from low levels of activity. Meanwhile, manufacturing has turned soft with few signs of immediate improvement. So far, the second quarter on average is sluggish, although still modestly positive. This coming week’s employment report may be key for affecting sentiment—not just for the Fed but for the consumer and for business.
Market attention will be on Friday’s jobs report for May—especially since recent labor market news has been mixed. Initial jobless claims have leveled off while consumer confidence has improved. Consumer spending stalled in April, so motor vehicle sales will garner extra attention. Manufacturing has softened and we get the first national reading on this sector with ISM manufacturing. Also, the Fed’s Beige Book is out and traders will look for any signs for the Fed to continue quantitative easing as is or to begin tapering soon.
The Markit PMI manufacturing flash index for May slipped fractionally to 51.9 versus a final April reading of 52.1 and the mid-month April flash reading of 52.0. These levels are virtually identical, all just a bit over 50 to indicate modest monthly growth. A plus for the May flash report was improvement in the new orders index which was up 1.3 points to 52.8 which points to a rising rate of monthly growth. However, the latest reading still indicates modest forward momentum for this sector. Other readings are mixed with backlog orders steady, inventories moving lower, price pressures rising slightly, and hiring slowing.
Markit PMI manufacturing index (final) Consensus Forecast for May 13: 52.1
Range: 51.5 to 52.2
The composite index from the ISM manufacturing survey for April slowed to 50.7 from 51.3 the month before. But details were more favorable. Positives in the report were acceleration for new orders, up 9 tenths to 52.3, and a back-to-back build in backlogs at 53.0. A drop in inventories, perhaps tied to concern over future demand, was a standout negative which weighed heavily on the composite headline index. Another negative was stalling in employment growth, but otherwise production increased and export orders were strong.
ISM manufacturing composite index Consensus Forecast for May 13: 51.0
Range: 49.0 to 52.5
Construction spending for March unexpectedly dropped with a 1.7 percent decline after rebounding 1.5 percent in February. Weakness was led by public outlays which plunged 4.1 percent after a 1.5 rebound in February. Private nonresidential spending decreased 1.5 percent, following a 0.8 percent boost the month before. On the positive side, private residential construction rose 0.4 percent after jumping 2.3 percent the month before.
Construction spending Consensus Forecast for April 13: +1.0 percent
Range: -5.1 to +1.7 percent
Sales of total light motor vehicles slowed slightly in April. Total sales came in at an annual rate of 14.9 million, down 2.2 percent from 15.3 million in March for the lowest rate since October. The rate for vehicles made in North America fell 1.7 percent in the month to an 11.9 million rate. The rate for imports fell 3.0 percent to a 3.1 million rate.
Motor vehicle domestic sales Consensus Forecast for May 13: 12.0 million-unit rate
Range: 11.8 to 12.2 million-unit rate
Motor vehicle total sales Consensus Forecast for May 13: 15.2 million-unit rate
Range: 15.0 to 15.5 million-unit rate
The U.S. international trade gap in March narrowed on weaker imports. The trade gap shrank to $38.8 billion from $43.6 billion in February. Exports slipped 0.9 percent after increasing 0.9 percent in February. Imports dropped 2.8 percent after rising 0.3 percent the month before. The improvement in the trade gap was primarily due to the nonpetroleum goods deficit which shrank to $34.8 billion in March from $38.6 billion the month before. The petroleum deficit improved to $21.1 billion versus $21.5 billion in February. The services surplus grew to $17.3 billion from $17.1 billion.
International trade balance Consensus Forecast for April 13: -$41.2 billion
Range: -$43.5 billion to -$37.0 billion
ADP private payroll employment rose only 119,000 in April, following a revised increase of 131,000 for March. The comparable BLS payroll numbers posted at 176,000 for April and 154,000 for March.
ADP private payrolls Consensus Forecast for May 13: 171,000
Range: 145,000 to 200,000
Nonfarm business productivity in the first quarter rebounded an annualized 0.7 percent, following a decline of 1.7 percent in the fourth quarter. Unit labor costs rose 0.5 percent, following a 4.4 percent jump in the fourth quarter. Looking at component detail, output improved to 2.5 percent versus 0.7 percent in the fourth quarter. Growth in hours worked slowed to an annualized 1.8 percent, following 2.4 percent the prior period. Growth in compensation also decelerated-to 1.2 percent from 2.7 percent in the fourth quarter. Based on the fact that first quarter GDP was revised only marginally (to 2.4 percent from 2.5 percent), there will likely be only small revisions to first quarter productivity and unit labor costs.
Nonfarm Business Productivity Consensus Forecast for revised Q1 13: +0.7 percent annual rate
Range: +0.2 to +1.0 percent annual rate
Unit Labor Costs Consensus Forecast for revised Q1 13: +0.5 percent annual rate
Range: -4.0 to +0.9 percent annual rate
Factory orders fell a very sizable 4.0 percent in March reflecting a swing lower for aircraft orders, which are always a very volatile factor, but also weakness across many categories. In another sign of weakness, February was revised down to a 1.9 percent gain from an initial 3.0 percent gain. New orders for durable goods fell 5.8 percent in the month, revised 1 tenth lower from the advance durable goods report. Orders for nondurable goods fell 2.4 percent for the latest month. The decline in non-durables reflected declines for energy products. More recently, durables orders for April rebounded 3.3 percent after dropping a sharp 5.9 percent in March.
Factory orders Consensus Forecast for April 13: +1.4 percent
Range: +0.5 to +3.9 percent
The composite index from the ISM non-manufacturing survey showed slowing conditions in April with the composite index at 53.1 versus March's 54.4. The new orders index showed moderate growth, posting at 54.5, compared to 54.6 in March. Monthly employment growth, at 52.0 versus 53.3 in March slowed in April. The business activity index, largely reflecting production, was somewhat steady, slipping to 55.0 from 56.5 in March.
ISM non-manufacturing composite index Consensus Forecast for May 13: 53.8
Range: 52.5 to 55.0
Wednesday's Beige Book was prepared for the June 18-19 FOMC meeting. Focus will be on the status of the labor market which initial tapering of quantitative easing hinges on.
Initial jobless claims were back up in the May 25 week, rising 10,000 to a 354,000 level. The trend for initial claims, after having improved from late March, now looks flat over the last two months. The 4-week average was up 6,750 to a 347,250 level that is the highest since late April.
Continuing claims, in the latest data available which is the May 18 week, also rose, up 63,000 to 2.986 million. But the gain follows a big 101,000 decline in the prior week with the 4-week average actually down again, 11,000 lower to a recovery best 2.987 million.
Jobless Claims Consensus Forecast for 6/1/13: 345,000
Range: 335,000 to 350,000
Nonfarm payroll employment in April increased a somewhat improved 165,000 after rising a revised 138,000 in March. Market expectations were for a 153,000 gain for April. The net revisions for February and March were up 114,000. The unemployment rate slipped to 7.5 percent from 7.6 percent in March. Turning back to payroll data, private payrolls gained 176,000 after rising 154,000 in March. Wages improved after a lousy March. Average hourly earnings rose 0.2 percent, following no change in March. On the negative side, the average workweek edged down to 34.4 hours in April from 34.6 hours the month before.
Nonfarm payrolls Consensus Forecast for May 13: 167,000
Range: 147,000 to 210,000
Private payrolls Consensus Forecast for May 13: 178,000
Range: 154,000 to 220,000
Unemployment rate Consensus Forecast for May 13: 7.5 percent
Range: 7.4 to 7.5 percent
Average workweek Consensus Forecast for May 13: 34.5 hours
Range: 34.3 to 34.5 hours
Average hourly earnings Consensus Forecast for May 13: +0.2 percent
Range: +0.1 to +0.2 percent
Consumer credit outstanding in March gained $8.0 billion. But the headline masked another month of weakness for revolving credit which fell $1.7 billion. As usual, non-revolving credit, up $9.7 billion, drove the total headline higher. Gains for non-revolving credit are a mix of strength for car sales, which is a positive indication on the consumer, but also gains for student loans, gains that are tied to government acquisition of private student loans and that do not necessarily point to an increase in ongoing student borrowing.
Consumer credit Consensus Forecast for April 13: +$14.0 billion
Range: +$10.0 billion to +$17.5 billion
R. Mark Rogers is the author of The Complete Idiot’s Guide to Economic Indicators, Penguin Books.
Econoday Senior Writer Mark Pender contributed to this article.
|
