|
The big story of the week is what is the Fed thinking—to maintain the current pace of asset purchases or to taper sometime soon.
 Stocks ended the week down moderately on Fed worries. Equities started the week little changed as there were no major economic indicators and traders preferred to stay on the sidelines ahead of Fed Chairman Bernanke’s Congressional testimony and FOMC minutes, both out Wednesday. FedSpeak was moderately positive on Tuesday as Federal Reserve Bank of St. Louis President James Bullard stated the Fed should continue its bond buying pace to boost the currently soft recovery. Stocks ended the week down moderately on Fed worries. Equities started the week little changed as there were no major economic indicators and traders preferred to stay on the sidelines ahead of Fed Chairman Bernanke’s Congressional testimony and FOMC minutes, both out Wednesday. FedSpeak was moderately positive on Tuesday as Federal Reserve Bank of St. Louis President James Bullard stated the Fed should continue its bond buying pace to boost the currently soft recovery.
 The big move in stocks was on Wednesday as Fed news bumped equities down notably. Early in the morning, Ben Bernanke gave his views on the economic outlook and little had changed. He also indicated that the Fed has flexibility on increasing or decreasing asset earnings. He noted that the Fed could taper within the next few FOMC meeting if there was sufficient improvement in the economy. These comments set up the downdraft in stocks after the afternoon release of Fed minutes. The minutes showed more argument by participants for an early tapering of asset purchases—even though the doves kept the earlier pace of purchases of mortgage-backed securities and Treasuries in place. The increased dissent was seen as increasing the probability of an earlier tapering and sent equities down notably for the day despite strong existing home sales data. The big move in stocks was on Wednesday as Fed news bumped equities down notably. Early in the morning, Ben Bernanke gave his views on the economic outlook and little had changed. He also indicated that the Fed has flexibility on increasing or decreasing asset earnings. He noted that the Fed could taper within the next few FOMC meeting if there was sufficient improvement in the economy. These comments set up the downdraft in stocks after the afternoon release of Fed minutes. The minutes showed more argument by participants for an early tapering of asset purchases—even though the doves kept the earlier pace of purchases of mortgage-backed securities and Treasuries in place. The increased dissent was seen as increasing the probability of an earlier tapering and sent equities down notably for the day despite strong existing home sales data.
Stocks were mostly down slightly on Thursday despite unexpected improvement in initial jobless claims and healthy numbers for FHFA home prices and new home sales. Earlier offset came before the open in the U.S. on news from China of contraction in that country’s manufacturing sector. Lingering worries about FOMC minutes also tugged down on stocks.
Stocks were little changed on Friday in quiet trading ahead of the Memorial Day weekend.
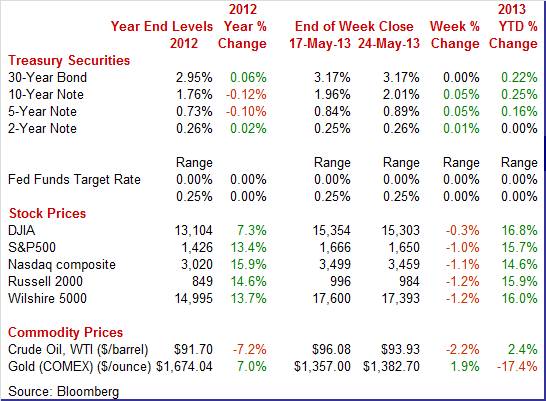
Equities were down this past week. The Dow was down 0.3 percent; the S&P 500, down 1.0 percent; the Nasdaq, down 1.1 percent; the Russell 2000, down 1.2 percent; and the Wilshire 5000, down 1.2 percent.
For the year-to-date, major indexes are up as follows: the Dow, up 16.8 percent; the S&P 500, up 15.7 percent; the Nasdaq, up 14.6 percent; the Russell 2000, up 15.9 percent; and the Wilshire 5000, up 16.0 percent.
Weekly percent change column reflects percent changes for all components except interest rates. Interest rate changes are reflected in simple differences.
 This past week, there were only two notable daily swings in rates—Tuesday and Wednesday. This past week, there were only two notable daily swings in rates—Tuesday and Wednesday.
Treasury rates fell Tuesday after remarks by St. Louis President James Bullard that the Fed should keep its current bond buying programs in place. He noted these programs are the best available policy option to boost growth. New York Fed President William C. Dudley also spoke Tuesday but took a neutral position, saying he had not decided on whether the next move for the Fed should be an increase or decrease in asset purchases.
Yields gained moderately at mid-week on Fed Chairman Ben Bernanke’s comment that there is the option for the Fed to taper asset purchases and on FOMC minutes that indicated there is increased dissent about maintaining QE3 and QE4 at the current pace of purchases. That is, more participants appear to be arguing for early tapering.
For this past week Treasury rates mostly were up slightly as follows: the 2-year note, up 1 basis point; the 5-year note, up 5 basis points; the 7-year note, up 6 basis points; and the 10-year note, up 5 basis points. The 3-month T-bill and 30-year bond were unchanged.
Over the past months, Treasury rates have traded in a narrow range.
 The spot price of West Texas Intermediate declined somewhat this past week. The only notable daily swing was on Wednesday with spot WTI declining just under $2 per barrel. The weekly petroleum reported showed an unexpected gain in gasoline stocks, indicating a lower need for crude for processing. Refiners have been cutting back on utilization rates. The report also showed a lower than expected decline in crude stockpiles. The spot price of West Texas Intermediate declined somewhat this past week. The only notable daily swing was on Wednesday with spot WTI declining just under $2 per barrel. The weekly petroleum reported showed an unexpected gain in gasoline stocks, indicating a lower need for crude for processing. Refiners have been cutting back on utilization rates. The report also showed a lower than expected decline in crude stockpiles.
Net for the week, the spot price for West Texas Intermediate declined $2.15 per barrel to settle at $93.93.
This past week’s news largely focused on what the Fed is thinking about its asset purchase programs—QE3 (mortgage-backed securities) and QE4 (Treasuries). News on economic sectors was mixed with manufacturing still soft and housing improving.
Financial markets reacted nervously to Fed Chairman Ben Bernanke’s testimony before Congress this past week. A key question likely is “why'” Did Bernanke really say anything new'
In questions and answers, Bernanke said tapering is a possibility, but only that. Should the labor market improve, while at the same time inflation pressures remain low, Bernanke told lawmakers that the Fed would "of course" end its asset-purchase program, perhaps within the next few FOMC meetings. But he carefully stressed that even if the Fed begins to step down the pace of asset purchases (currently at $85 billion per month), the move would not automatically point to the complete wind down of the program. He said a winding down would be subject to changes in jobs and inflation. If the recovery were to falter, he said the winding down would be delayed.
Markets negatively reacted to the Fed chair indicating the possibility of tapering asset purchases.
But for quite some time, FOMC statements have stated flexibility in the timing and amount of asset purchases, based on economic data. The FOMC statement at the end of the April 30-May 1 meeting specifically added language of the possibility of changes in the amount of asset purchases in either direction.
“The Committee is prepared to increase or reduce the pace of its purchases to maintain appropriate policy accommodation as the outlook for the labor market or inflation changes. In determining the size, pace, and composition of its asset purchases, the Committee will continue to take appropriate account of the likely efficacy and costs of such purchases as well as the extent of progress toward its economic objectives.”
On the flexibility of asset purchase programs, what the Fed chief stated was not new news but equities declined anyway—notably after FOMC minutes were released later Wednesday afternoon.
There are divisions within the Fed on how soon to taper asset purchases, but Chairman Bernanke indicated his position. He stated that a tapering down of stimulus in the near term would not be a plus for the economy.
Citing the long-term need to promote sustainably higher interest rates, the Chairman says: "A premature tightening of monetary policy could lead interest rates to rise temporarily but would also carry a substantial risk of slowing or ending the economic recovery and causing inflation to fall further."
Separately, Bernanke described fiscal policy as very restrictive and cited risks from financial instability in Europe. Bernanke described the US jobs market as improving but still "weak overall".
Bernanke's comments followed recent talk from Federal Reserve hawks who are saying a tapering could begin within a few months and wind down by the end of the year.
Concerned about upside risks to inflation, a number of hawks at the FOMC meeting earlier this month were willing to begin tapering down asset purchases as early as June with one hawk calling for an immediate tapering.
But the hawks were outnumbered as the doves called for more progress on the economy before slowing the pace of asset purchases. The doves argued that the nation's recovery, which started strong, was beginning to slow, with one dove arguing that more accommodation, not less, was needed. Most members at the meeting were willing to make adjustments to purchases, whether up or down, based on the jobs market and inflation.
Pointing to rising issuance of lower quality bonds, hawks voiced concern that U.S. financial markets were becoming too buoyant. Comments were also heard that the Fed, as part of its quantitative easing effort, should begin moving to Treasury purchases and away from purchases of mortgage-backed securities.
There has been increased volume in debate within the Fed about its quantitative easing. But debate is what the Fed does at potential turning points in monetary policy. With inflation low and unemployment still high, the doves are maintaining control, suggesting no tapering of asset purchases in the near term. But as the recovery eventually returns to long-term growth rates, Fed asset purchases will slow and later unwind. Almost certainly, quantitative easing will end but it is a question of timing. The debate will continue.
 Topping market expectations generally is good. But it may not be enough to change the general trend by much. Durables orders for April came in better than expected. However, for the core they came in on average, this means that manufacturing merely is less sluggish than believed last month. Topping market expectations generally is good. But it may not be enough to change the general trend by much. Durables orders for April came in better than expected. However, for the core they came in on average, this means that manufacturing merely is less sluggish than believed last month.
New factory orders for durables in April rebounded 3.3 percent after dropping a sharp 5.9 percent in March. Analysts expected a 1.1 percent increase.
The transportation component gained 8.1 percent after falling 14.7 percent in March. Strength for April was largely in aircraft as defense aircraft jumped a monthly 53.3 percent, nondefense aircraft partially rebounded 18.1 percent, and motor vehicles gained 1.9 percent.
Excluding transportation, durables orders rebounded 1.3 percent, following a decline of 1.7 percent the month before. The consensus called for a 0.4 percent increase in orders excluding transportation.
Outside of transportation, component strength for April was widespread. All major industries showed gains but all major industries had declined in March.
 Nondefense capital goods orders excluding aircraft is in partial recovery mode. This series gained 1.2 percent in April, following a 0.9 percent rise in March and 4.8 percent drop in February. Shipments for this series fell 1.5 percent in April, following a 0.5 percent gain the month before. The shipment data go into the Commerce Department’s estimate for business equipment investment in GDP. This month’s number suggests a soft equipment component in second quarter GDP. Nondefense capital goods orders excluding aircraft is in partial recovery mode. This series gained 1.2 percent in April, following a 0.9 percent rise in March and 4.8 percent drop in February. Shipments for this series fell 1.5 percent in April, following a 0.5 percent gain the month before. The shipment data go into the Commerce Department’s estimate for business equipment investment in GDP. This month’s number suggests a soft equipment component in second quarter GDP.
The strong point in manufacturing is aircraft—after discounting monthly volatility. The motor vehicles subcomponent is providing some forward momentum. Core manufacturing on average is still soft, just not quite as sluggish as earlier believed.
The latest PMI flash manufacturing index indicates that manufacturing currently is barely growing. However, there are signs that it could improve in the future. Growth in general activity was steady and modest for May for the nation's manufacturing sector based on the PMI flash which slipped fractionally to 51.9 versus a final April reading of 52.1 and the mid-month April flash reading of 52.0. These levels are virtually identical, all just a bit over 50 to indicate modest monthly growth.
A plus for the May flash report was improvement in the new orders index which was up 1.3 points to 52.8 which points to a rising rate of monthly growth. However, the latest reading still indicates modest forward momentum for this sector. Other readings are mixed with backlog orders steady, inventories moving lower, price pressures rising slightly, and hiring slowing.
One clear negative is contraction in export orders which fell 2.4 points to a sub-50 level of 49.4. This reading evokes this month's flash PMI for China which is under 50 at 49.6 and is a reminder that overseas markets may not be expanding.
The U.S. manufacturing sector has been slowing and, based on the manufacturing component of the industrial production report, was in contraction in March and April.
 While manufacturing has been slowing, the housing sector has gained momentum. Existing home sales in April gained 0.6 percent, following slippage of 0.2 percent the prior month. The April sales pace at an annual rate of 4.97 million is the highest for the recovery and the highest since November 2009. Sales of single-family homes, the most important component in the report, rose 1.2 percent in the month. While manufacturing has been slowing, the housing sector has gained momentum. Existing home sales in April gained 0.6 percent, following slippage of 0.2 percent the prior month. The April sales pace at an annual rate of 4.97 million is the highest for the recovery and the highest since November 2009. Sales of single-family homes, the most important component in the report, rose 1.2 percent in the month.
Supply, which had been very tight, poured into the market during April with 230,000 units added to lift the months’ supply to 5.2 from 4.7 months in March. The median time for a house on the market fell dramatically, to 46 days versus 62 days in March.
Prices continue to improve. After jumping 6.2 percent in March, the median price rose another 4.8 percent in April to $192,800 which is the highest level of the recovery. Note that price data in this report, which are not based on repeat transactions, are often volatile. Still, a double digit year-on-year median gain at 11.0 percent is convincing.
Low mortgage rates—due heavily to Fed purchases of mortgage-backed securities—are supporting demand. Conventional mortgage rates slipped to 3.45 percent in April from 3.57 percent the prior month. Worries that rates might rise in coming months due to Fed possibly reducing asset purchases could spur hurry-up home purchases. Rates have risen somewhat in May.
 Sales are rising in the new home market despite limited supply, a mix that's driving prices sharply higher. New home sales rose 2.3 percent in April to a 454,000 annual rate. Revisions to March and February showed a very strong net gain of 45,000 from initial levels that points to much greater than expected activity in prior months. Sales are rising in the new home market despite limited supply, a mix that's driving prices sharply higher. New home sales rose 2.3 percent in April to a 454,000 annual rate. Revisions to March and February showed a very strong net gain of 45,000 from initial levels that points to much greater than expected activity in prior months.
Price readings were up significantly, up 8.3 percent in April alone for the median price to a new record $271,600. The average price, at $330,800 and also at a new record, is up 15.4 percent in the month. These readings, which are not based on repeat transactions, can be volatile but the year-on-year gain, at 14.9 percent for both the median and the average, is very convincing and mirrors gains in Wednesday's existing home sales report. The latest price reading suggests that there was a significant shift in sales toward the high end market.
Supply is pouring into the existing home sales market but not into the new home market where credit availability for builders remains limited and where supply chain constraints may be holding back new construction. New homes on the market rose only 5,000 in the month to 156,000 to keep supply at the current sales rate unchanged at 4.1 months. This shortage will continue to put upward pressure on prices.
 The Fed's quantitative easing continues to help asset prices rise in the housing market-although supply shortages remain a key factor. Improved housing demand also is helping as the labor market continues to mend. The FHFA price index for March advanced 1.3 percent after improving 0.9 percent the month before. The latest number came in above the consensus forecast for 0.9 percent. The Fed's quantitative easing continues to help asset prices rise in the housing market-although supply shortages remain a key factor. Improved housing demand also is helping as the labor market continues to mend. The FHFA price index for March advanced 1.3 percent after improving 0.9 percent the month before. The latest number came in above the consensus forecast for 0.9 percent.
The March boost was led by the Pacific region, increasing 2.3 percent. All nine Census regions posted gains in the latest month with the softest rise being 0.5 percent in the West South Central region.
House prices according to the FHFA measure have risen for 14 consecutive months.
The year-on-year rate for March improved to plus 7.2 percent versus 7.1 percent for the month before.
Overall, the sustained rise in prices is boosting consumer confidence and bringing more houses on to the market. The housing sector probably is providing the most forward momentum to the recovery currently.
The Fed is remaining flexible about the timing and amount of its current asset purchase programs. Almost certainly, changes will be gradual but eventually coming—and heavily telegraphed. Meanwhile, the recovery continues with mixed momentum from this past week’s news as manufacturing is soft and housing improving.
The focus is on the consumer and housing sectors. The week’s highlight is likely the personal income report as the consumer sector in recent months has been key in keeping the recovery going. But the most recent readings on income and spending slowed and traders will look for improvement. In contrast, the consumer mood has improved in the latest numbers and this week’s reading is for consumer confidence. Housing has been on an uptrend and with manufacturing sluggish, this trend needs to continue. Updates will be posted for Case-Shiller and pending home sales. Also, the second estimate for first quarter GDP is released.
U.S. Holiday: Memorial Day. Bond, Equity Markets Closed
The S&P/Case-Shiller 20-city home price index (SA) gained 1.2 percent for February which followed a 1.0 percent boost in the prior month. The year-on-year rate, at an adjusted plus 9.4 percent, was the highest since May 2006. Another significant monthly increase is expected for March, especially given last week’s FHFA increase for March of 1.3 percent.
The S&P/Case-Shiller 20-city HPI (SA, m/m) Consensus Forecast for March 13: +1.0 percent
Range: +0.6 to +1.5 percent
The S&P/Case-Shiller 20-city HPI (NSA, m/m) Consensus Forecast for March 13: +0.7 percent
Range: +0.3 to +1.2 percent
The S&P/Case-Shiller 20-city HPI (NSA, y/y) Consensus Forecast for March 13: +10.2 percent
Range: +9.5 to +10.6 percent
The Conference Board's consumer confidence index improved in April, up 6.2 points to 68.1. The gain was due to recovery in expectations which swung lower in March during the sequestration saga and then swung back up, to 73.3 compared to 63.7 in March. The reading on current conditions was flat, at 60.4 versus March's 59.2.
Consumer confidence Consensus Forecast for May 13: 71.5
Range: 69.0 to 74.0
The Richmond Fed manufacturing index for April fell into negative territory to minus 6 from March's plus 3. Details were weak, including a second month of contraction for new orders, now at minus 8, compared to minus 4 in March. Backlogs worsened dramatically, falling to minus 21 in April from minus 14 the prior month. Shipments were down in the region in the latest report. Employment growth remained positive but inventory accumulation slowed.
Richmond Fed manufacturing index Consensus Forecast for May 13: -3.0
Range: -8.0 to 8.0
The Dallas Fed general business activity index worsened sharply in April, plummeting from 7.4 to minus 15.6, reaching its lowest level since July 2012. The company outlook index turned negative as well, declining from 9.6 to minus 2.2. The production index fell from 9.9 to minus 0.5. The near-zero reading indicates output was little changed from March levels. The new orders index fell nearly 14 points to minus 4.9, posting its first negative reading this year.
Dallas Fed general business activity index Consensus Forecast for May 13: -8.0
Range: -10.0 to 0.0
GDP in the advance estimate for the first quarter grew 2.5 percent after a modest 0.4 gain in the fourth quarter. Demand growth was very sluggish with the weakest component being government purchases while the bright spot was consumer spending. Final sales of domestic product increased 1.5 percent after rising 1.9 percent in the fourth quarter. Final sales to domestic producers (which exclude net exports) improved to a 1.9 percent boost, after a 1.5 percent gain in the fourth quarter. Headline inflation for the GDP price index showed mild acceleration to an annualized 1.2 percent in the first quarter from 1.0 percent the prior quarter. When excluding food and energy, inflation pressure posted at 1.5 percent versus 1.3 percent the prior quarter.
Real GDP Consensus Forecast for second estimate Q1 13: +2.5 percent annual rate
Range: +2.2 to +2.9 percent annual rate
GDP price index Consensus Forecast for second estimate Q1 13: +1.2 percent annual rate
Range: +1.2 to +1.3 percent annual rate
Initial jobless claims for the May 18 week fell 23,000 to a 340,000 level. A monthly comparison tied to the survey period for payroll employment shows a 15,000 decline from the April 13 week. Also favorable is the trend for continuing claims which were down a very sizable 112,000 in the latest available data which is for the May 11 week. The level for continuing claims, at 2.912 million, is a new recovery low as is the 4-week average at 2.995 million which is down 24,000 in the week.
Jobless Claims Consensus Forecast for 5/25/13: 340,000
Range: 335,000 to 350,000
The pending home sales index rose 1.5 percent in March to 105.7 which is the highest level for this index this year. This followed a drop of 1.0 percent in February. Housing data tend to be volatile during winter months up to the start of spring due to large seasonal factors. The latest gain in this index points to subsequent improvement for existing home sales as deals are closed, though the collapse of deals has been a problem in recent months due to tight lending standards.
Pending home sales Consensus Forecast for April 13: +1.4 percent
Range: +0.4 to +5.5 percent
Personal income for March came in a little softer than expected while spending posted marginally higher. Personal income rose 0.2 percent after a 1.1 percent boost the month before. The important wages and salaries component advanced 0.2 percent, following a 0.7 percent gain in February. Large monthly swings in income growth continued in March from fiscal cliff effects. March likely ended those related swings, although we may see some impact on government wages from sequestration, starting for May or June. Personal spending rose 0.2 percent for March after a 0.7 percent jump in February. Lower gasoline prices notably weakened nondurables. Turning to inflation, the PCE price index declined 0.1 percent, following a 0.4 percent jump in February. The core PCE price index was unchanged after a 0.1 percent rise in February.
Looking ahead, the payroll survey suggests sluggishness in the private wages & salaries component of personal income as private aggregate weekly earnings slipped 0.2 percent in April. Headline PCEs are likely to be soft due to declines in motor vehicle sales and gasoline prices. New motor vehicle sales for April decreased 2.3 percent while the gasoline stations component of retail sales dropped 4.7 percent. However, outside of these sectors, PCEs are likely to be healthy as core retail sales (excluding autos and gasoline) gained 0.6 percent in April. PCE inflation is likely to be favorable as the headline CPI fell 0.4 percent in April while the core CPI rose only 0.1 percent.
Personal income Consensus Forecast for April 13: +0.1 percent
Range: -0.2 to +0.3 percent
Personal consumption expenditures Consensus Forecast for April 13: 0.0 percent
Range: -0.3 to +0.6 percent
PCE price index Consensus Forecast for April 13: -0.2 percent
Range: -0.3 to +0.1 percent
Core PCE price index Consensus Forecast for April 13: +0.1 percent
Range: -0.1 to +0.1 percent
The Chicago PMI for April fell a sizable 3.4 points to 49.0. This was the first reading below 50 since September 2009. A sub-50 reading indicates outright contraction in month-to-month business activity. Employment contracted in the month as did production and backlogs.
But there's one factor that's positive in the report—new orders were up 2 tenths to 53.2, indicating steady growth in new business.
Chicago PMI Consensus Forecast for May 13: 50.0
Range: 47.5 to 53.0
The Reuters/University of Michigan's consumer sentiment index improved notably in the first reading on May. The consumer sentiment index jumped to 83.7 for the mid-month reading versus 76.4 for the final April reading and versus April's mid-month reading of 72.3. Both the current conditions and the expectations components showed solid gains with current conditions jumping 7.6 points to 97.5.
Consumer sentiment index Consensus Forecast for final May 13: 83.7
Range: 82.0 to 84.5
R. Mark Rogers is the author of The Complete Idiot’s Guide to Economic Indicators, Penguin Books.
Econoday Senior Writer Mark Pender contributed to this article.
|
