|
This past week’s indicator news showed lots of divergent directions. The consumer sector appears to be picking up, manufacturing has softened, and housing is giving mixed signals.
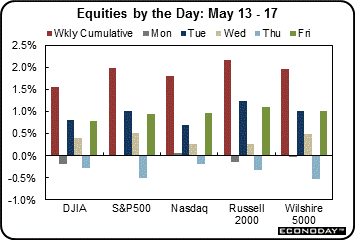 Equities posted notable gains this past week despite net negative economic news. However, the week started on a mixed note with major indexes slightly on both sides of the breakeven line. Retail sales beat expectations but traders were concerned about some Fed officials talking up the need to slow quantitative easing. Stocks rebounded Tuesday on increased business optimism according to the National Federation of Independent Business’s optimism index. Also, there was a switch on FedSpeak. Comments by Philadelphia Fed President Charles Plosser on the need to think about less quantitative easing were seen as a positive on the economy. Equities posted notable gains this past week despite net negative economic news. However, the week started on a mixed note with major indexes slightly on both sides of the breakeven line. Retail sales beat expectations but traders were concerned about some Fed officials talking up the need to slow quantitative easing. Stocks rebounded Tuesday on increased business optimism according to the National Federation of Independent Business’s optimism index. Also, there was a switch on FedSpeak. Comments by Philadelphia Fed President Charles Plosser on the need to think about less quantitative easing were seen as a positive on the economy.
But the mood about the Fed swung again on Wednesday as industrial production was weaker than expected and Empire State fell below expectations. Traders saw the data as indicating continuing Fed ease. Traders clearly are changing their minds on a regular basis about the economy and Fed reaction.
Stocks fell moderately on Thursday on a rise in initial jobless claims and weak factory orders. Also, housing starts fell (but permits rose). At week’s end indicator news was positive, lifting stocks. Leading indicators and consumer sentiment both improved.
For the week, indicator news was more negative than positive for the near term, but belief in continued Fed ease kept stocks on the uptrend.
Equities were up this past week. The Dow was up 1.6 percent; the S&P 500, up 2.0 percent; the Nasdaq, up 1.8 percent; the Russell 2000, up 2.2 percent; and the Wilshire 5000, up 2.0 percent.
For the year-to-date, major indexes are up as follows: the Dow, up 17.2 percent; the S&P 500, up 16.8 percent; the Nasdaq, up 15.9 percent; the Russell 2000, up 17.3 percent; and the Wilshire 5000, up 17.4 percent.

Weekly percent change column reflects percent changes for all components except interest rates. Interest rate changes are reflected in simple differences.
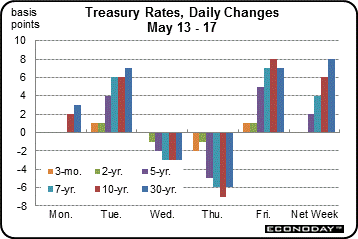 Middle and long-term rates rose moderately this past week. Key events were Tuesday, Thursday, and Friday. Middle and long-term rates rose moderately this past week. Key events were Tuesday, Thursday, and Friday.
Rates rose Tuesday on comments by Federal Bank of Philadelphia President Charles Plosser that the Fed should consider tapering quantitative easing soon. Also, business optimism picked up.
Treasury yields dipped Thursday on the unexpected jump in initial jobless claims. Rates rose Friday on improved consumer sentiment and leading indicators.
For this past week Treasury rates were up as follows: the 5-year note, up 2 basis points; the 7-year note, up 4 basis points; the 10-year note, up 6 basis points; and the 30-year bond, up 8 basis points.
The 3-month T-bill and the 2-year note were unchanged.
 The spot price of West Texas Intermediate essential was unchanged this past week. Early in the week, spot WTI slipped on soft economic news—not just from the U.S. but also from slowing growth in China. Supply also is seen as increasing in general. The spot price of West Texas Intermediate essential was unchanged this past week. Early in the week, spot WTI slipped on soft economic news—not just from the U.S. but also from slowing growth in China. Supply also is seen as increasing in general.
The Fed came into play Thursday as a rise in initial jobless claims was seen as a reason for continued quantitative easing. But crude bumped up Friday on favorable economic news in the U.S.
Throughout the week, a rising dollar weighed on oil prices.
Net for the week, the spot price for West Texas Intermediate nudged up 20 cents per barrel to settle at $96.08.
News was mostly down this week except for the consumer sector.
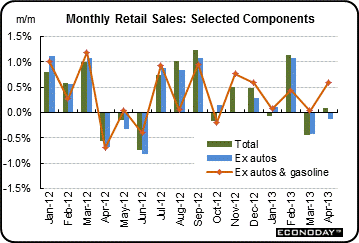 Once again, it is the details that matter. Headline retail sales edged up despite a decline in gasoline prices. Core sales actually were somewhat healthy. Retail sales increased 0.1 percent, following a drop of 0.5 percent in March. Once again, it is the details that matter. Headline retail sales edged up despite a decline in gasoline prices. Core sales actually were somewhat healthy. Retail sales increased 0.1 percent, following a drop of 0.5 percent in March.
Motor vehicles were unexpectedly up 1.0 percent after a 0.6 percent dip in March. Unit new motor vehicle sales slipped in April but from high levels, according to manufacturers’ data dropping 2.3 percent in the earlier report. On a technical note, the Bureau of Economic Analysis has a different sample from the full manufacturers—and there can be price effects.
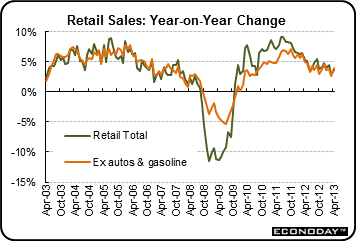 Ex-auto sales in April slipped 0.1 percent after decreasing 0.4 percent in March. Gasoline sales fell on lower prices. Excluding both autos and gasoline components, sales gained a strong 0.6 percent, following no change in March. Ex-auto sales in April slipped 0.1 percent after decreasing 0.4 percent in March. Gasoline sales fell on lower prices. Excluding both autos and gasoline components, sales gained a strong 0.6 percent, following no change in March.
Core strength was in building materials & garden equipment; clothing; nonstore retailers; general merchandise; and food services & drinking places. There may be some seasonality issues but discretionary spending appears to be picking up. While there are signs of soft spots in the recovery (specifically manufacturing), the consumer sector may be gaining some momentum.
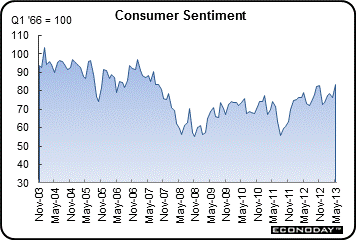 Consumer spirits improved notably in April. The consumer sentiment index jumped to 83.7 for the mid-month reading versus 76.4 for the final April reading and versus April's mid-month reading of 72.3. The latest monthly final reading is the highest since July 2007. Consumer spirits improved notably in April. The consumer sentiment index jumped to 83.7 for the mid-month reading versus 76.4 for the final April reading and versus April's mid-month reading of 72.3. The latest monthly final reading is the highest since July 2007.
Both the current conditions and the expectations components show solid gains with current conditions jumping 7.6 points to 97.5. This gain, which takes this reading to a new recovery high, offers an upbeat indication for May's consumer data, hinting at significant gains for jobs and consumer spending data in May's comparison with April.
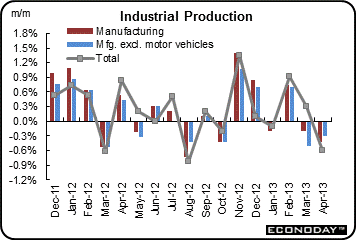 In contrast to the consumer sector improving, the manufacturing sector weakened in April. Overall industrial production declined 0.5 percent after gaining 0.3 percent in March. And the report highlighted that March’s strength was utilities, not manufacturing. In contrast to the consumer sector improving, the manufacturing sector weakened in April. Overall industrial production declined 0.5 percent after gaining 0.3 percent in March. And the report highlighted that March’s strength was utilities, not manufacturing.
The April manufacturing component fell 0.4 percent after a 0.3 percent dip in March. Excluding motor vehicles, manufacturing declined 0.3 percent in April after a 0.5 percent drop the prior month.
Within manufacturing, durable goods moved down 0.6 percent in April. Output decreased for all major categories of durable goods except computer and electronic products.
 The production of nondurable goods decreased 0.1 percent in April after having fallen 0.3 percent in March. Among the major components of nondurables, the indexes for apparel and leather and for petroleum and coal products each dropped about 1 1/2 percent in April. The production of nondurable goods decreased 0.1 percent in April after having fallen 0.3 percent in March. Among the major components of nondurables, the indexes for apparel and leather and for petroleum and coal products each dropped about 1 1/2 percent in April.
The output of utilities dropped 3.7 percent after jumping a monthly 5.3 percent in March. Production at mines rebounded 0.9 percent after slipping 0.2 percent in March.
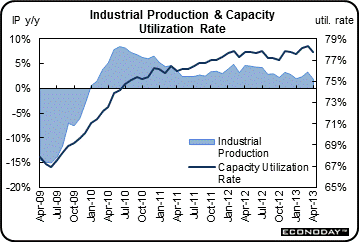
Capacity utilization for total industry declined to 77.8 percent in April from 78.3 percent the prior month. Expectations were for 78.3 percent.
The manufacturing sector has lost some steam, likely due to recession in Europe and slowing in Asia. The latest numbers point to slower growth in the second quarter. Softness in regional surveys for May adds to this argument. The second quarter is looking like a soft spot—at least for manufacturing.
 Conditions remain flat in the New York manufacturing sector which is not showing much life. The Empire State index fell more than 4 points in the May report to minus 1.43 for the first negative reading since January. A negative reading indicates month-to-month contraction though, in this case which is just barely below zero, only marginal contraction compared to last month. Conditions remain flat in the New York manufacturing sector which is not showing much life. The Empire State index fell more than 4 points in the May report to minus 1.43 for the first negative reading since January. A negative reading indicates month-to-month contraction though, in this case which is just barely below zero, only marginal contraction compared to last month.
The new orders index is a key detail in these reports and, like the headline index, has turned negative for Empire State but only slightly, at minus 1.17 versus plus 2.20 in April.
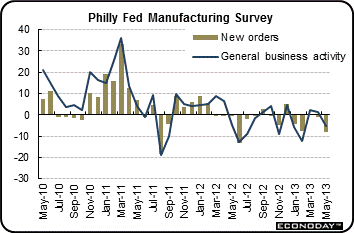 Showing sizable contraction was the Philly Fed's manufacturing index, after two months in the positive zone, fell back to minus 5.2 this month. Showing sizable contraction was the Philly Fed's manufacturing index, after two months in the positive zone, fell back to minus 5.2 this month.
New orders were not strength for Mid-Atlantic manufacturers, at minus 7.9 to indicate deepening monthly contraction from April's minus 1.0 reading.
Though the Philly Fed report, and to a lesser degree the Empire State report, have been showing consistently weaker conditions than reports on the national manufacturing sector, these reports nevertheless are warning signals for May. The manufacturing is apparently in a soft spot, though expectations in the sector point to improvement through the year.
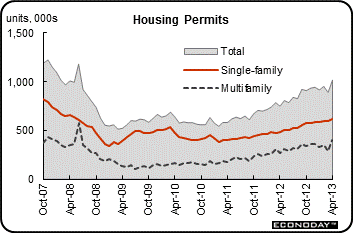
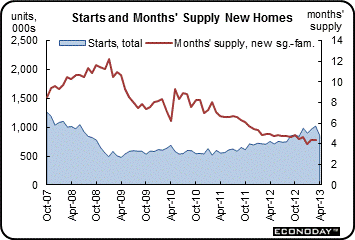 Housing is giving mixed signals but the positive may be outweighing the negative. For April, housing starts notably disappointed but housing permits were unexpectedly optimistic. In April, housing starts plunged a monthly 16.5 percent after rising 5.4 percent in March. The April starts annualized level of 0.853 million units fell short of analysts’ forecast for 0.969 million units and was up 13.1 percent on a year-ago basis. Housing is giving mixed signals but the positive may be outweighing the negative. For April, housing starts notably disappointed but housing permits were unexpectedly optimistic. In April, housing starts plunged a monthly 16.5 percent after rising 5.4 percent in March. The April starts annualized level of 0.853 million units fell short of analysts’ forecast for 0.969 million units and was up 13.1 percent on a year-ago basis.
 The decrease in starts was led by a monthly 38.9 percent drop in the multifamily component after a 25.6 percent gain in March. The single-family component slipped 2.1 percent in April after declining 4.4 percent the month before. The decrease in starts was led by a monthly 38.9 percent drop in the multifamily component after a 25.6 percent gain in March. The single-family component slipped 2.1 percent in April after declining 4.4 percent the month before.
On the positive side, permits were unexpectedly strong—suggesting forward momentum for the housing sector. Permits jumped 14.3 percent after a 6.5 percent decrease in March. April’s annualized pace of 1.017 million units was up 35.8 percent on a year-ago basis. Market expectations were for 0.945 million units for April permits.
Overall, housing may still be coming out of winter month volatility—due to large seasonal factors for winter months. But permits point to gradual improvement for the housing sector.
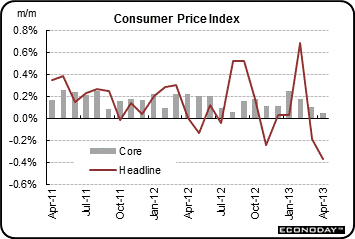 Oil prices have been volatile in recent months and have continued to show up in headline CPI numbers. Recently, headline inflation continues downward has been on a lesser downward trend and both below the Fed’s target rate. Oil prices have been volatile in recent months and have continued to show up in headline CPI numbers. Recently, headline inflation continues downward has been on a lesser downward trend and both below the Fed’s target rate.
The consumer price index for April fell 0.4 percent after declining 0.2 percent in March. The core CPI—excluding food and energy was soft, matching the March rate of 0.1 percent.
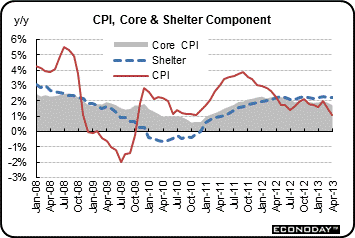 By major components outside the core, energy fell 4.3 percent, following a drop of 2.6 percent in March. Gasoline decreased 8.1 percent, following a decline of 4.4 percent. The food component rose 0.2 percent after no change in March. By major components outside the core, energy fell 4.3 percent, following a drop of 2.6 percent in March. Gasoline decreased 8.1 percent, following a decline of 4.4 percent. The food component rose 0.2 percent after no change in March.
For the core measure, the indexes for shelter, used cars and trucks, new vehicles, and tobacco all increased in April. These increases were partially offset by declines in the indexes for apparel, airline fares, and recreation.
Year-on-year, overall CPI inflation decelerated to 1.1 percent from 1.5 percent in March (seasonally adjusted). The core rate slowed to 1.7 percent in April from 1.9 percent the month before. On an unadjusted year-ago basis, the headline CPI in April was up 1.1 percent and the core was up 1.7 percent.
Again, both the headline and core CPI inflation rates remain below the Fed’s “trigger” of 2.5 percent for potential changes in policy. The April report will let the Fed stay loose—or at least take longer to debate when to cut back on quantitative easing. And lower gasoline prices will be good for consumer confidence.
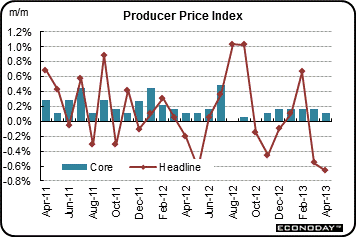 Headline PPI fell in line with expectations due to a drop in gasoline and also food prices. The core rate actually softened. The April producer price index fell 0.7 percent after a 0.6 percent decrease the month before. Headline PPI fell in line with expectations due to a drop in gasoline and also food prices. The core rate actually softened. The April producer price index fell 0.7 percent after a 0.6 percent decrease the month before.
The core rate, which excludes both food and energy, increased 0.1 percent after rising 0.2 percent in March. Expectations were for a 0.2 percent increase.
Food price fell 0.8 percent in April after rebounding 0.8 percent in March. Energy fell 2.5 percent in April after dropping 3.4 percent the month before. Gasoline decreased 6.0 percent, following a fall of 6.8 percent in March.
Within the core rate, leading the April rise, prices for pharmaceutical preparations climbed 0.6 percent. Tugging down were passenger cars, down 0.2 percent after a 0.2 percent rise in March; light trucks, down 0.1 percent, following no change; and computers, down 0.9 percent after a decrease of 0.4 percent.
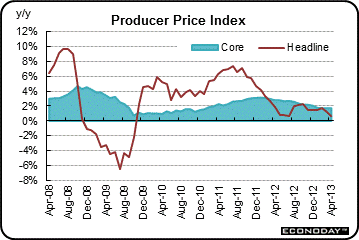
For the overall PPI, the year-ago rate slowed to 0.7 percent in April from 1.1 percent the month before (seasonally adjusted). The core rate held steady at 1.7 percent. On a not seasonally adjusted basis for February, the year-ago headline PPI was up 0.6 percent, while the core was up 1.7 percent.
Overall, there is little inflation at the producer level. This is a positive argument for continued Fed quantitative ease.
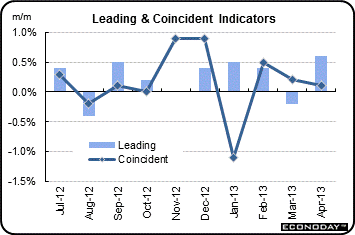 The index of leading indicators for April suggests an improvement in economic growth. The questions are when and for what sectors. It appears coming strength is for the consumer and housing sectors, although not as much as in past recoveries. The index of leading indicators for April suggests an improvement in economic growth. The questions are when and for what sectors. It appears coming strength is for the consumer and housing sectors, although not as much as in past recoveries.
Boosted by strength in housing permits, the index of leading economic indicators surged 0.6 percent in April after a 0.2 percent decline the month before.
Also showing strength were financial measures, including credit activity, as well as jobless claims and the stock market. On the negative side were manufacturing measures, which reflect this sector's ongoing bumpy ride, as well as consumer expectations. This latter factor, however, is very likely to turn positive in May judging by the more recent big jump in the consumer sentiment report.
Another reading in April’s report included an incremental 0.1 percent gain in the coincident index which points to a slow start for the second quarter.
On the economic indicator front, there has been good news and bad news this past week but with more bad news recently—with bad news largely defined as less than expected instead of outright negative. The consumer is improving moderately, housing is mixed but likely still positive, and manufacturing is close to flat in the near term. But momentum for all point to improvement in the second half and timing is a question mark. The big question for traders appears to be how will the Fed interpret the cross currents in the near term and somewhat further out.
Housing and manufacturing are the focus this week. National manufacturing declined in April with early regional numbers on the negative side. Anther regional reports posts this week from the Kansas City Fed with Markit PMI also being released. But durables orders will be a key update. The housing starts report for April was mixed with starts down and permits up. The April data for existing and new home sales will get extra attention. Also, FHFA home prices for March may suggest whether more homeowners are coming out of being below water and bringing more supply onto market. Finally, Fed minutes for the April 30-May 1 meeting will be released. Debate has heated up on how much and when to adjust quantitative easing. There likely will be more detail on this issue.
The Chicago Fed National Activity Index in March fell to minus 0.23 from February's upwardly revised plus 0.76. The biggest change in March was in production indicators which still contributed to growth, at plus 0.01, but well down from February's plus 0.47. Helping to pull the index into negative ground during March was employment, at minus 0.06 versus February's plus 0.31. Sales/orders/inventories fell to minus 0.02 from plus 0.13. Consumption & housing pulled down the index down the most, at minus 0.14 for a second straight month.
Consensus numbers not available this week
Existing home sales for March came in at a 4.92 million rate, down 0.6 percent from February. The March decline followed gains in January and February of 0.8 percent and 0.2 percent. The latest reading left sales 10.3 percent above year-ago levels. Total supply at the March sales rate was 4.7 months which is up, but only slightly, from 4.6 months in February. Supply in March 2012 was 6.2 months. Only 30,000 units were added to inventory in the month versus an average March increase of 100,000 units. A reduction in distressed properties may be a factor limiting supply.
Existing home sales Consensus Forecast for April 13: 5.00 million-unit rate
Range: 4.91 to 5.10 million-unit rate
The Minutes of the April 30-May1 FOMC meeting are scheduled for release at 2:00 p.m. ET. There has been increased FedSpeak of slowing quantitative easing later this year—cutting back on the size of additions to the Fed’s balance sheet. Traders will be sensitive to Fed discussion on when and how much to slow earlier announced QE3 and QE4.
Initial jobless claims spiked higher in the May 11 week, up 32,000 to a 360,000 level that is the highest since late March. There were no special factors to explain away the gain that lifted the 4-week average by 1,250 to 339,250 which, despite the increase, wass still more than 20,000 below the month-ago trend to hint at improvement for the May employment report.
Jobless Claims Consensus Forecast for 5/18/13: 345,000
Range: 340,000 to 360,000
The Markit PMI manufacturing index (final) for April posted at 52.1, nearly unchanged from the mid-month flash reading of 52.0. Order growth slowed significantly in the month as did employment. As orders slowed, manufacturers worked down backlogs which contracted in the month. On the plus side, inventories were not signaling any trouble and price pressures are easing.
Markit PMI manufacturing flash index Consensus Forecast for May 13: 50.8
Range: 50.1 to 53.0
The FHFA purchase only house price index for February improved 0.7 percent, following a gain of 0.6 percent the prior month. The year-on-year rate for February posted at plus 7.1 percent versus 6.6 percent for the month before. While there has been improvement for a number of months, the U.S. index is 13.6 percent below its April 2007 peak and is roughly the same as the October 2004 index level.
FHFA purchase only house price index Consensus Forecast for March 13: +0.9 percent
Range: +0.3 to +1.2 percent
New home sales rose 1.5 percent in March in an easy comparison with an unusually weak month in February. February fell 7.6 percent but followed a 14.1 percent surge in January. Low supply, the result of tight credit and supply chain constraints in the residential construction sector, continues to hold down sales. The number of homes on the market did rise but only by a slight 3,000 to 153,000, and the gain was not enough to improve the month's supply which was unchanged at 4.4 months.
New home sales Consensus Forecast for April 13: 425 thousand-unit annual rate
Range: 406 thousand to 440 thousand-unit annual rate
The Kansas City Fed manufacturing index was minus 5 in April, equal to minus 5 in March but up from minus 10 in February. The composite index is an average of the production, new orders, employment, supplier delivery time, and raw materials inventory indexes. The production index edged higher from minus 1 to plus 1, and the shipments index also increased, with both indexes moving into positive territory for the first time in 8 months. The new orders and new orders for exports indexes were basically unchanged.
Kansas City Fed manufacturing index Consensus Forecast for May 13: -2
Range: -10 to 0
Durable goods orders in March declined 5.8 percent, following a 4.3 percent surge the month before. The transportation component declined 15.1 percent after a sharp 20.3 percent jump in February. Excluding transportation, durables orders decreased 0.1 percent after a rise of 0.9 percent in February. Numbers reflect revisions from the more recent total factory orders report.
New orders for durable goods Consensus Forecast for April 13: +1.1 percent
Range: -2.2 percent to +4.2 percent
New orders for durable goods, ex-trans., Consensus Forecast for April 13: +0.4 percent
Range: -0.7 percent to +1.8 percent
SIFMA Recommended Early Close 2:00 ET
R. Mark Rogers is the author of The Complete Idiot’s Guide to Economic Indicators, Penguin Books.
Econoday Senior Writer Mark Pender contributed to this article.
|
