|
Although there was little economic indicator news in the U.S., key equity indexes closed the week at historic highs.
 Both the Dow and S&P 500 closed the week at record highs. Most indexes rose Monday on continued momentum from the Friday’s jobs report topping expectations. However, somewhat offsetting were weak PMI readings for Europe and also China. Both the Dow and S&P 500 closed the week at record highs. Most indexes rose Monday on continued momentum from the Friday’s jobs report topping expectations. However, somewhat offsetting were weak PMI readings for Europe and also China.
Tuesday, the Dow topped 15,000 on mostly favorable earnings reports and on news that Reserve Bank of Australia cut its benchmark interest rate. Stocks advanced Wednesday on a combination of better than expected data from China and Germany and positive earnings reports. China’s April export growth beat expectations. In Germany, March industrial production gained more than forecast.
 Even though initial jobless claims were better than expected, FedSpeak had the final say for the day. Stocks turned negative in late trading on Thursday after remarks by Philadelphia Fed President Charles Plosser indicated he believed Fed asset purchases should be reduced later this year. But the week ended with a bounce upward on Friday as traders and investors simply went with perceived market momentum—no notable news on the economy nor earnings. Even though initial jobless claims were better than expected, FedSpeak had the final say for the day. Stocks turned negative in late trading on Thursday after remarks by Philadelphia Fed President Charles Plosser indicated he believed Fed asset purchases should be reduced later this year. But the week ended with a bounce upward on Friday as traders and investors simply went with perceived market momentum—no notable news on the economy nor earnings.
Equities were up this past week. The Dow was up 1.0 percent; the S&P 500, up 1.2 percent; the Nasdaq, up 1.7 percent; the Russell 2000, up 2.2 percent; and the Wilshire 5000, up 1.3 percent.
For the year-to-date, major indexes are up as follows: the Dow, up 15.4 percent; the S&P 500, up 14.5 percent; the Nasdaq, up 13.8 percent; the Russell 2000, up 14.8 percent; and the Wilshire 5000, up 15.1 percent.
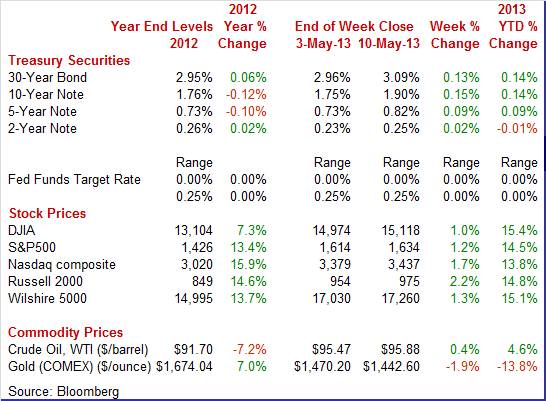
Weekly percent change column reflects percent changes for all components except interest rates. Interest rate changes are reflected in simple differences.
 The Treasury market saw little movement this past week except for Friday. Rates were essentially little changed through Thursday, although ticking up. Yields gained moderately the last day of the week as funds flowed from bonds to equities. Some analysts indicated that rates firmed Friday in part due to comments that day by Pimco's Bill Gross that the 30-year bull market for bonds “likely ended” on April 29. The Treasury market saw little movement this past week except for Friday. Rates were essentially little changed through Thursday, although ticking up. Yields gained moderately the last day of the week as funds flowed from bonds to equities. Some analysts indicated that rates firmed Friday in part due to comments that day by Pimco's Bill Gross that the 30-year bull market for bonds “likely ended” on April 29.
For this past week Treasury rates were up as follows: the 2-year note, up 2 basis points; the 5-year note, up 9 basis points; the 7-year note, up 10 basis points; the 10-year note, up 15 basis points; and the 30-year bond, up 13 basis points. The 3-month T-bill slipped 1 basis point.
 It also was a relatively quiet week for the crude oil market. The only notable daily moves were modest swings Wednesday and Friday. The spot price of West Texas Intermediate rose a little over a dollar a barrel at mid-week on a drop in supplies at Cushing, Oklahoma—the storage hub for most oil from the continental U.S. The price of crude declined somewhat under a dollar a barrel on Friday on a rise in the currency value of the dollar. In international markets, crude generally is priced in U.S. dollars. It also was a relatively quiet week for the crude oil market. The only notable daily moves were modest swings Wednesday and Friday. The spot price of West Texas Intermediate rose a little over a dollar a barrel at mid-week on a drop in supplies at Cushing, Oklahoma—the storage hub for most oil from the continental U.S. The price of crude declined somewhat under a dollar a barrel on Friday on a rise in the currency value of the dollar. In international markets, crude generally is priced in U.S. dollars.
Net for the week, the spot price for West Texas Intermediate nudged up 41 cents per barrel to settle at $95.88.
There was limited economic indicator news in the U.S. this past week. However, consumer credit posted and disappointed. And Econoday added the BLS JOLT’s report to the web calendar.
 The Fed has switched its guidance section of the FOMC statement to being indicator based. The Fed specifically points to a 6.5 percent trigger on the unemployment rate for cutting back on loose monetary policy while counterbalancing any changes in inflation expectations above 2.5 percent on a year-ago basis. Yet the Fed has clarified that no one number will determine its view of the labor market and that many factors will be considered. The JOLTS report, although it has been under the radar, is likely one report the Fed is tracking. The Fed has switched its guidance section of the FOMC statement to being indicator based. The Fed specifically points to a 6.5 percent trigger on the unemployment rate for cutting back on loose monetary policy while counterbalancing any changes in inflation expectations above 2.5 percent on a year-ago basis. Yet the Fed has clarified that no one number will determine its view of the labor market and that many factors will be considered. The JOLTS report, although it has been under the radar, is likely one report the Fed is tracking.
The JOLTS report is the Labor Department’s Job Openings and Labor Turnover Survey. The headline number is job openings.
Although lagging the release timing of the employment situation report by a month, JOLTS provides additional information on the labor market. The payroll survey in the employment situation report provides numbers on net job changes. JOLTS breaks down labor market data into pre-net changes—such as job openings, hires, and separations.
 There were 3.844 million job openings on the last business day of March, little changed from 3.899 million in February. In March, the number of job openings was little changed in all industries and regions. The hires rate (3.2 percent) and separations rate (3.1 percent) were little changed. There were 3.844 million job openings on the last business day of March, little changed from 3.899 million in February. In March, the number of job openings was little changed in all industries and regions. The hires rate (3.2 percent) and separations rate (3.1 percent) were little changed.
The number of job openings in March (not seasonally adjusted) was little changed over the year for total nonfarm, total private, and government. Job openings decreased over the year for nondurable goods manufacturing and federal government; openings increased over the year for accommodation and food services. Job openings were little changed over the year for all regions.
Overall, the latest JOLTS report still points to a soft labor market.
 There is another sign that the first quarter ended on a soft note, possibly headed into a sluggish second quarter. The consumer credit report is always difficult to read, but March's $8.0 billion gain masked another month of weakness for revolving credit which fell $1.7 billion. There is another sign that the first quarter ended on a soft note, possibly headed into a sluggish second quarter. The consumer credit report is always difficult to read, but March's $8.0 billion gain masked another month of weakness for revolving credit which fell $1.7 billion.
Soft readings for revolving credit point to limited credit-card use among consumers and in turn point to consumer caution. As usual, non-revolving credit, up $9.7 billion, drove the total headline higher. Gains for non-revolving credit are a mix of strength for car sales, which is a positive indication on the consumer, but also gains for student loans, gains that are tied to government acquisition of private student loans and that do not necessarily point to an increase in ongoing student borrowing. The bottom line is that this report indicates that the consumer sector is still soft.
Limited news on the consumer sector suggests that the recovery may be headed into a slightly softer second quarter.
With mixed news on the consumer sector (higher confidence and lower initial jobless claims but lower credit card spending), the April retail sales report will get heightened market attention. Manufacturing has been sputtering and updates will come from Empire State, Philly Fed (both for May), and national industrial production for April. Housing has been a moderate bright spot although winter weather has created its usual volatility for those months. We should get a firm reading on housing this week with data for April housing starts and permits.
Retail sales in March declined 0.4 percent, following a surge of 1.0 percent in February. Ex-auto sales in March declined 0.4 percent after a jump of 1.0 percent in February. Gasoline sales were down significantly on lower prices. Excluding both autos and gasoline components, sales slipped 0.1 percent after increasing 0.3 percent in February. Motor vehicle sales decreased 0.6 percent, following a 1.3 percent rise in February. Core subcomponent weakness was broad based. Looking ahead, the auto component likely will be pulling down on the headline number as unit new motor vehicle sales (according to manufacturers) fell 2.3 percent in April.
Retail sales Consensus Forecast for April 13: -0.3 percent
Range: -0.7 to +0.7 percent
Retail sales excluding motor vehicles Consensus Forecast for April 13: -0.1 percent
Range: -0.5 to +0.5 percent
Less motor vehicles & gasoline Consensus Forecast for April 13: +0.4 percent
Range: 0.0 to +0.6 percent
Business inventories rose only 0.1 percent in February which was well below a 1.2 percent rise in business sales. The much higher rate of sales growth drove down the stock-to-sales ratio to 1.28, compared to an already lean 1.29 in January. More recently, factory orders were unchanged in March while wholesale inventories gained 0.4 percent for the same month.
Business inventories Consensus Forecast for March 13: +0.3 percent
Range: 0.0 to +0.4 percent
The NFIB Small Business Optimism Index declined 1.3 points in March to an 89.5 level that is 1.2 points below the recovery average. Labor market indicators were down as were inventory investment plans and sales expectations.
NFIB Small Business Optimism Index Consensus Forecast for April 13: 90.5
Range: 88.5 to 93.0
Import prices fell 0.5 percent in March with the year-on-year rate at minus 2.7 percent. Swings in petroleum prices, down 1.9 percent in March, weighed on the monthly headline number, but when excluding petroleum the trend was still dead flat: minus 0.1 percent in March, no change in February, and plus 0.1 percent in both January and December. The year-on-year ex-petroleum reading was minus 0.2 percent.
Import prices Consensus Forecast for April 13: -0.5 percent
Range: -1.0 to +0.3 percent
Export prices Consensus Forecast for April 13: -0.1 percent
Range: -0.5 to +0.2 percent
The producer price index in March fell back 0.6 percent after a strong 0.7 percent boost in February. The core rate, which excludes both food and energy, increased 0.2 percent after rising 0.2 percent in February. Analysts expected a 0.2 percent increase. Food prices rebounded 0.8 percent after falling 0.5 in February. Energy costs in March dropped 3.4 percent, following a 3.0 percent boost the month before. Gasoline fell 6.8 percent after spiking 7.2 percent in February. Within the core, almost one-quarter of the March advance was due to prices for civilian aircraft, which rose 0.7 percent. Also, pharmaceuticals increased 0.4 percent. Key players in the core, passenger car prices gained 0.2 percent while light trucks were flat.
PPI Consensus Forecast for April 13: -0.7 percent
Range: -0.9 to +0.1 percent
PPI ex food & energy Consensus Forecast for April 13: +0.2 percent
Range: -0.2 to +0.2 percent
The Empire State manufacturing index slowed in April, declining more than 6 points to plus 3.05. A positive reading indicates monthly growth in general conditions but the current reading, down from 9.24 in March and 10.04 in February, indicates a slowing in monthly growth. The slowing unfortunately included new orders which are still growing, at 2.20, but just barely and down from monthly growth rates of 8.18 and 13.31 in the prior two months.
Empire State Manufacturing Survey Consensus Forecast for May 13: 3.75
Range: 0.00 to 8.50
Industrial production was up more than expected in March but it was due to utilities output, not manufacturing, which declined. Overall industrial production gained 0.4 percent after a 1.1 percent spike in February. Unusually cold weather drove up utilities output. The manufacturing component slipped 0.1 percent after rebounding 0.9 percent in February. Excluding motor vehicles, manufacturing decreased 0.3 percent in March after a 0.8 percent increase the prior month. Capacity utilization for total industry firmed to 78.5 percent from 78.3 percent in February. Looking ahead, production worker hours in manufacturing decreased 0.2 percent for the month, suggesting a weak manufacturing component for April industrial production.
Industrial production Consensus Forecast for April 13: -0.2 percent
Range: -0.5 to +0.3 percent
Manufacturing production component Consensus Forecast for April 13: +0.1 percent
Range: -0.2 to +0.4 percent
Capacity utilization Consensus Forecast for April 13: 78.3 percent
Range: 77.9 to 78.6 percent
NAHB housing market index for April fell 2 points to a much lower-than-expected 42. This is the lowest reading since October. The National Home Builders Association, which publishes today's report, continues to warn that low supply is holding back new home sales. They cite still restrictive lending practices and now they cite rising construction costs as obstacles to new building. Buyer traffic fell, down 4 points to 30 for the lowest reading since September. Current sales were down 2 points to 45 but future sales were up 3 points to 53.
NAHB housing market index Consensus Forecast for May 13: 44
Range: 40 to 45
The consumer price index for March declined 0.2 percent after jumping 0.7 in February. The core CPI—excluding food and energy—slowed to a 0.1 percent pace, following a 0.2 percent rise the month before. By major components outside the core, energy decreased 2.6 percent, following a jump of 5.4 percent in February. Gasoline dropped 4.4 percent after surging 9.1 percent. The food component was unchanged after a 0.1 percent rise in February. For the core measure, the indexes for shelter, used cars and trucks, medical care, personal care, and airline fares all rose in March. These increases more than offset declines in the indexes for apparel, household furnishings and operations, and tobacco.
CPI Consensus Forecast for April 13 -0.3 percent
Range: -0.4 to +0.1 percent
CPI ex food & energy Consensus Forecast for April 13: +0.2 percent
Range: -0.1 to +0.2 percent
Housing starts were unexpectedly strong in March but it was all in the multifamily family component. And overall permits slipped, indicating that the housing recovery may be softening despite the strong headline number for starts. In March, housing starts jumped 7.0 percent after a 7.3 percent gain the month before. The March starts annualized level of 1.036 million was up 46.7 percent on a year-ago basis. The increase in starts was led by a monthly 31.1 percent increase in the multifamily component after an 11.2 percent boost in February. The single-family component decreased 4.8 percent after rising 5.5 percent in February. Permits fell back, declining 3.9 percent to an annual pace of 0.902 million units.
Housing starts Consensus Forecast for April 13: 0.969 million-unit rate
Range: 0.930 million to 1.000 million-unit rate
Housing permits Consensus Forecast for April 13: 0.945 million-unit rate
Range: 0.916 million to 0.980 million-unit rate
Initial jobless claims declined 4,000 in the May 4 week to a new recovery low of 323,000. Initial claims have been on a recent down trend as for the two prior weeks, initial claims fell a combined 28,000 which is a very significant drop. The four-week average was also down for a third straight week and is also at a recovery low, at 336,750 for a 6,250 decline.
Jobless Claims Consensus Forecast for 5/11/13: 330,000
Range: 329,000 to 341,000
The general business conditions index of the Philadelphia Fed's Business Outlook Survey was flat in April. The Philly Fed's composite index came in marginally above zero, at plus 1.3 to show minimal monthly growth. The reading was little changed from March's plus 2.0. But outside of the shipments component, which was moderately positive at plus 9.1, there was little strength in the report. New orders were essentially flat at minus 1.0 versus March's plus 0.5, and employment turned down with a reading of minus 6.8, compared to plus 2.7 last month.
Philadelphia Fed survey Consensus Forecast for May 13: 2.2
Range: -3.0 to 6.6
The Reuter's/University of Michigan's consumer sentiment index slipped in April overall, down to 76.4 from March's 78.6. But momentum was building during the latter half of the month based on the mid-month reading which was a surprisingly soft 72.3. The comparison points to an 80s reading for the last couple of weeks which is a good omen for May. The current conditions index rose more than 5 points from mid-month but at 89.9 was a little bit shy of March's 90.7. At 67.8, the expectations index also rose from mid-month but likewise was shy of the March reading, at 70.8.
Consumer sentiment Consensus Forecast for preliminary May 13: 78.0
Range: 74.0 to 82.5
The Conference Board's index of leading indicators posted at minus 0.1 percent in March, following a gain of 0.5 percent the month before. The March figure was kept from being more negative by financial components. Outside of the report's financial measures, subcomponents were widely negative. The March report also included a dip of minus 0.1 percent for the coincident index which reflects ongoing sluggishness in the economy.
Leading indicators Consensus Forecast for April 13: +0.3 percent
Range: 0.0 to +0.6 percent
R. Mark Rogers is the author of The Complete Idiot’s Guide to Economic Indicators, Penguin Books.
Econoday Senior Writer Mark Pender contributed to this article.
|
