|
For the week, it all boiled down to the Friday report on the employment situation. The numbers were below par but beat expectations—and that was enough to lift equities.
 Equities started the week on an up note based on news from overseas and the U.S. Shares advanced Monday after Italy formed a government two months after its national election which reduced some geopolitical uncertainty. Traders were looking ahead to the Thursday policy decision by the European Central Bank, increasingly expecting rate cuts. Also, pending home sales rose more than expected. Equities started the week on an up note based on news from overseas and the U.S. Shares advanced Monday after Italy formed a government two months after its national election which reduced some geopolitical uncertainty. Traders were looking ahead to the Thursday policy decision by the European Central Bank, increasingly expecting rate cuts. Also, pending home sales rose more than expected.
 Stocks gained somewhat on Tuesday on favorable Case-Shiller home prices and on a rise in consumer confidence. But on Wednesday stocks dropped on a soft and below forecast rise in ADP private employment. The Fed’s policy statement was seen as little changed. Stocks gained somewhat on Tuesday on favorable Case-Shiller home prices and on a rise in consumer confidence. But on Wednesday stocks dropped on a soft and below forecast rise in ADP private employment. The Fed’s policy statement was seen as little changed.
Thursday saw a notable rebound on an unexpected drop in initial jobless claims and after the European Central Bank cut its key interest rate. Stocks were buoyed Friday by better-than-expected payroll job gains for April. The Dow topped 15,000 in intra-day trading but closed the week somewhat below that mark. The S&P 500 closed above 1,600.
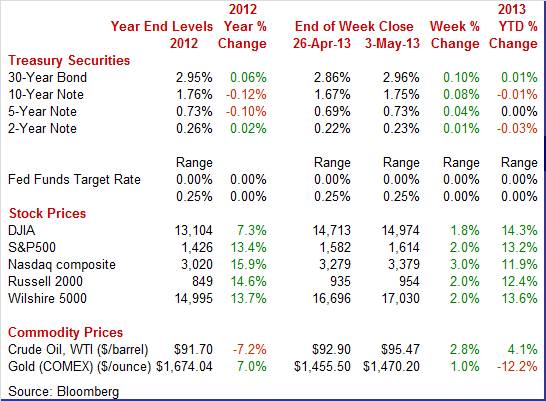
Equities were up this past week. The Dow was up 1.8 percent; the S&P 500, up 2.0 percent; the Nasdaq, up 3.0 percent; the Russell 2000, up 2.0 percent; and the Wilshire 5000, up 2.0 percent.
 Equities mostly were up for the month of April. The Dow was up 1.8 percent; the S&P 500, up 1.8 percent; the Nasdaq, up 1.9 percent; and the Wilshire 5000, up 1.6 percent. The Russell 2000 slipped 0.4 percent on the month. Equities mostly were up for the month of April. The Dow was up 1.8 percent; the S&P 500, up 1.8 percent; the Nasdaq, up 1.9 percent; and the Wilshire 5000, up 1.6 percent. The Russell 2000 slipped 0.4 percent on the month.
For the year-to-date, major indexes are up as follows: the Dow, up 14.3 percent; the S&P 500, up 13.2 percent; the Nasdaq, up 11.9 percent; the Russell 2000, up 12.4 percent; and the Wilshire 5000, up 13.6 percent.
Weekly percent change column reflects percent changes for all components except interest rates. Interest rate changes are reflected in simple differences.
 This past week, Treasury yields rose moderately for mid- and longer-term maturities. Rates were essentially little changed daily except on Wednesday and Friday. This past week, Treasury yields rose moderately for mid- and longer-term maturities. Rates were essentially little changed daily except on Wednesday and Friday.
Rates eased Wednesday on a disappointing ADP private employment report and on belief by some that added language in the Fed’s FOMC statement might lead to increased quantitative easing.
On Friday, a better-than-expected April jobs report led rates up as funds flowed into equities.
For this past week Treasury rates were up as follows: the 2-year note, up 1 basis point; the 5-year note, up 4 basis points; the 7-year note, up 7 basis points; the 10-year note, up 8 basis points; and the 30-year bond, up 10 basis points. The 3-month T-bill was unchanged.
 There was quite a bit of daily volatility this past week but spot WTI ended the week up moderately. The spot price for West Texas Intermediate gained over a dollar barrel on expectations of a rate cut by the ECB and on positive news from Italy. Crude dropped more than a buck on traders positioning for a projected increase in stockpiles as expected in the weekly EIA report. At mid-week, WTI fell more than two dollars on news of weaker-than-expected ADP employment and then later on a jump in reported oil inventories which hit an 82-year high. The boost in inventories was seen as related to a slowing in growth in China and the U.S. There was quite a bit of daily volatility this past week but spot WTI ended the week up moderately. The spot price for West Texas Intermediate gained over a dollar barrel on expectations of a rate cut by the ECB and on positive news from Italy. Crude dropped more than a buck on traders positioning for a projected increase in stockpiles as expected in the weekly EIA report. At mid-week, WTI fell more than two dollars on news of weaker-than-expected ADP employment and then later on a jump in reported oil inventories which hit an 82-year high. The boost in inventories was seen as related to a slowing in growth in China and the U.S.
But on Thursday, a drop in initial jobless claims and the rate cut by the ECB led to a three dollar a barrel rebound. The employment report on Friday topping estimates boosted crude by $1-1/2.
Net for the week, the spot price for West Texas Intermediate rose $2.57 per barrel to settle at $95.47. This is the highest level since early April.
Most economic news was on the positive side, though barely and some indicators turned slightly negative. While data were mixed, sluggish described more indicators than not. Housing was the exception on the upside.
 The Federal Reserve left its key monetary policy rates unchanged. The Fed funds target rate remained at a range of zero to 0.25 percent where it has been since December 2008. The FOMC also left its quantitative easing plan unchanged with planned mortgage backed securities purchases of $40 billion per month and $45 billion in Treasuries. There was no change in guidance—namely keeping rates exceptionally low with emphasis on the unemployment rate and inflation expectations. The Fed reiterated that it will look at a wide range of indicators on the labor market and inflation. The FOMC statement said that economic growth was continuing "at a moderate pace." Inflation is subdued relative to the Fed's long-term 2 percent inflation goal. Notably, the Fed did make a point of stating that fiscal policy is a drag on the economy. The Federal Reserve left its key monetary policy rates unchanged. The Fed funds target rate remained at a range of zero to 0.25 percent where it has been since December 2008. The FOMC also left its quantitative easing plan unchanged with planned mortgage backed securities purchases of $40 billion per month and $45 billion in Treasuries. There was no change in guidance—namely keeping rates exceptionally low with emphasis on the unemployment rate and inflation expectations. The Fed reiterated that it will look at a wide range of indicators on the labor market and inflation. The FOMC statement said that economic growth was continuing "at a moderate pace." Inflation is subdued relative to the Fed's long-term 2 percent inflation goal. Notably, the Fed did make a point of stating that fiscal policy is a drag on the economy.
The statement was almost identical to its March 20th statement. The only slightly notable change in the statement was the addition of a specific comment that the Fed has flexibility about the amount, timing and composition of asset purchases. The Fed has noted this in the past but just not as explicitly.
“The Committee is prepared to increase or reduce the pace of its purchases to maintain appropriate policy accommodation as the outlook for the labor market or inflation changes. In determining the size, pace, and composition of its asset purchases, the Committee will continue to take appropriate account of the likely efficacy and costs of such purchases as well as the extent of progress toward its economic objectives.”
Some analysts interpreted this to mean that the Fed was giving itself leeway to expand QE while others suggested it was merely preparation for markets of when the Fed will slow purchases. And FedSpeak earlier has noted this flexibility—so it was not a change in policy but merely increasing guidance on that issue.
The vote for the statement was 11 to 1 with Kansas City President Esther George dissenting. She was concerned that the continued high level of monetary accommodation increased the risks of future economic and financial imbalances and, over time, could cause an increase in long-term inflation expectations.
 The numbers were still soft but April employment beat expectations and there were upward revisions. Total payroll jobs in April increased a somewhat improved 165,000 after rising a revised 138,000 in March (originally up 88,000). Market expectations were for a 153,000 gain for April. The net revisions for February and March were up 114,000. The unemployment rate slipped to 7.5 percent from 7.6 percent in March. The numbers were still soft but April employment beat expectations and there were upward revisions. Total payroll jobs in April increased a somewhat improved 165,000 after rising a revised 138,000 in March (originally up 88,000). Market expectations were for a 153,000 gain for April. The net revisions for February and March were up 114,000. The unemployment rate slipped to 7.5 percent from 7.6 percent in March.
Turning back to payroll data, private payrolls gained 176,000 after rising 154,000 in March (originally 95,000). Expectations were for a 175,000 boost.
 In the private sector, relative strength again was in the private service-providing sector. Service-providing jobs increased 185,000 after a 139,000 rise in March. Goods-producing jobs were disappointing, declining 9,000 (rounded) after a 15,000 rise in March. Construction decreased 6,000 in the latest month with mining dipping 4,000. Manufacturing employment was unchanged. In the private sector, relative strength again was in the private service-providing sector. Service-providing jobs increased 185,000 after a 139,000 rise in March. Goods-producing jobs were disappointing, declining 9,000 (rounded) after a 15,000 rise in March. Construction decreased 6,000 in the latest month with mining dipping 4,000. Manufacturing employment was unchanged.
Government jobs declined 11,000 in April, following a decrease of 16,000 the prior month.
Wages improved after a lousy March. Average hourly earnings rose 0.2 percent, following no change in March. The median forecast was for a 0.2 percent advance. On the negative side, the average workweek edged down to 34.4 hours in April from 34.6 hours the month before. The market consensus was for 34.6 hours.
Turning to detail for the household survey, household employment in April rebounded 296,000 after a 260,000 drop the month before. The labor force increased 210,000, following a 496,000 drop in March.
Looking ahead, the payroll survey suggests sluggishness in the personal income report and in industrial production. Private aggregate weekly earnings slipped 0.2 percent in April, pointing to a modest decline in private wages & salaries. Production worker hours in manufacturing decreased 0.2 percent for the month, suggesting a weak manufacturing component for April industrial production.
Overall, the bottom line is that the labor market is not as scary as reported in March. However, it is still soft but a little better than forecast. This report likely will not change Fed thinking on quantitative easing as unemployment is still high and job growth is still below par.
 Personal income for March came in a little softer than expected while spending posted marginally higher. Personal income rose 0.2 percent after a 1.1 percent boost the month before. Analysts projected a 0.4 percent increase. The important wages and salaries component advanced 0.2 percent, following a 0.7 percent gain in February. Large monthly swings in income growth continued in March from fiscal cliff effects-though March likely ends those related swings. Personal income for March came in a little softer than expected while spending posted marginally higher. Personal income rose 0.2 percent after a 1.1 percent boost the month before. Analysts projected a 0.4 percent increase. The important wages and salaries component advanced 0.2 percent, following a 0.7 percent gain in February. Large monthly swings in income growth continued in March from fiscal cliff effects-though March likely ends those related swings.
 Personal spending rose 0.2 percent for the latest month after a 0.7 percent jump in February. The gain was led by services with durables and nondurables down. Expectations were for an overall 0.1 percent rise. In more detail, durables slipped 0.2 percent after a 0.2 percent rise. Nondurables, on lower gasoline prices, fell 1.1 percent, following a 1.6 percent jump in February. Services, on higher utilities usage from atypically cold weather, jumped 0.7 percent, following a 0.5 percent gain the month before. Personal spending rose 0.2 percent for the latest month after a 0.7 percent jump in February. The gain was led by services with durables and nondurables down. Expectations were for an overall 0.1 percent rise. In more detail, durables slipped 0.2 percent after a 0.2 percent rise. Nondurables, on lower gasoline prices, fell 1.1 percent, following a 1.6 percent jump in February. Services, on higher utilities usage from atypically cold weather, jumped 0.7 percent, following a 0.5 percent gain the month before.
Turning to inflation, the PCE price index declined 0.1 percent, following a 0.4 percent jump in February. Expectations were for a 0.1 percent increase. The core PCE price index was unchanged after a 0.1 percent rise in February. The median forecast was for a 0.1 percent rise.
Year-on-year, headline prices were up 1.0 percent in March versus 1.3 percent in February. The core was up 1.1 percent, compared to 1.3 percent the month before. Clearly, the PCE inflation numbers give the Fed leeway for continued quantitative ease for some time. Year-ago rates have been trending further below the Fed’s goal of 2 percent inflation.
Overall, March was a sluggish month for consumer income and spending. The good news is that inflation was soft-keeping the Fed's loose monetary policy in play.
 Vehicle sales slowed slightly in April to indicate monthly weakness for the motor vehicle component of April's retail sales report. Total sales came in at an annual rate of 14.9 million, down 2.2 percent from 15.3 million in March for the lowest rate since October. The rate for vehicles made in North America fell 1.7 percent in the month to an 11.9 million rate. The rate for imports fell 3.0 percent to a 3.1 million rate. Vehicle sales have been a little flat so far this year but contributed strongly to last year's consumer spending data. Vehicle sales slowed slightly in April to indicate monthly weakness for the motor vehicle component of April's retail sales report. Total sales came in at an annual rate of 14.9 million, down 2.2 percent from 15.3 million in March for the lowest rate since October. The rate for vehicles made in North America fell 1.7 percent in the month to an 11.9 million rate. The rate for imports fell 3.0 percent to a 3.1 million rate. Vehicle sales have been a little flat so far this year but contributed strongly to last year's consumer spending data.
 Consumer confidence still has a long way to go to return to pre-recession levels, but in April, it headed in the right direction. Consumer confidence still has a long way to go to return to pre-recession levels, but in April, it headed in the right direction.
Consumer confidence improved in April but not the assessment of current conditions which points to a little weakness compared to March. The headline index jumped 6.2 points to 68.1 versus a revised 61.9 in March. But the gain was due to recovery in expectations, which swung lower in March during the sequestration saga and have now swung back up, to 73.3 compared to 63.7 in March and 72.4 in February.
The bad news is that the reading on current conditions was flat, at 60.4 versus March's 59.2. Though April showed a small gain, a very closely watched sub-index showed deterioration in the consumer's assessment of the current jobs market with 37.1 percent saying jobs are hard to get versus 35.4 percent in March. This is the worst reading since November.
 Existing home sales have been flat but are likely to begin moving higher based on the pending home sales index. The number of contracts signed to purchase an existing home rose 1.5 percent in March to 105.7 which is the highest level for this index this year. This followed a drop of 1.0 percent in February. Housing data tend to be volatile during winter months up to the start of spring due to large seasonal factors. Existing home sales have been flat but are likely to begin moving higher based on the pending home sales index. The number of contracts signed to purchase an existing home rose 1.5 percent in March to 105.7 which is the highest level for this index this year. This followed a drop of 1.0 percent in February. Housing data tend to be volatile during winter months up to the start of spring due to large seasonal factors.
Strength was led by the largest housing region which is the South where contracts signed were up 2.7 percent for low double-digit year-on-year growth of 10.4 percent. The Midwest, at 13.7 percent, shows the strongest year-on-year rate together with a small monthly gain. The West also shows a small monthly gain with the Northeast, the smallest region in the data, showing no change.
The latest gain in this index points to subsequent improvement for existing home sales as deals are closed, though collapse of deals, however, has been a problem in recent months due to tight lending standards.
 Home prices are posting sizeable gains, up 1.2 percent in Case-Shiller 20-city data for February which is up from a 1.0 percent gain in the prior month. The year-on-year rate, at an adjusted plus 9.4 percent, is the highest since May 2006. Home prices are posting sizeable gains, up 1.2 percent in Case-Shiller 20-city data for February which is up from a 1.0 percent gain in the prior month. The year-on-year rate, at an adjusted plus 9.4 percent, is the highest since May 2006.
All 20 cities showed gains, led by the West with Las Vegas up 2.0 percent in the month followed by Phoenix, LA, and San Francisco with 1.8 percent gains. Half of the 20 city sample shows double-digit year-on-year gains.
Unadjusted data, which are followed in this report, showed a smaller 0.3 percent gain for February which, due to the ice and snow, is a slow time for the housing market. The year-on-year rate, where seasonal effects are minimalized, is at an unadjusted plus 9.3 percent.
This report underscores the healthy gains in the prior week's FHFA price report and confirms a continued uptrend for home prices. The price improvement should bring more supply into market and add to consumer confidence.
 Construction outlays unexpectedly dropped with a 1.7 percent decline in March after rebounding 1.5 percent in February. Construction outlays unexpectedly dropped with a 1.7 percent decline in March after rebounding 1.5 percent in February.
Weakness was led by public outlays which plunged 4.1 percent after a 1.5 rebound in February. Private nonresidential spending decreased 1.5 percent, following a 0.8 percent boost the month before.
On the positive side, private residential construction rose 0.4 percent after jumping 2.3 percent the month before. In March, the new one-family component gained 1.6 percent, following a 5.4 percent boost in February. The new multifamily component rebounded 0.3 percent after falling back 1.4 percent in February.
On a year-ago basis, overall construction was up 4.8 percent in March versus 6.2 percent in February.
Overall, construction appears to be slowing except for the housing sector. This trend is seen in the slowing of year-ago growth which recently peaked at 11.0 percent for November 2012.
 The U.S. trade balance in March narrowed on weaker imports. The trade gap shrank to $38.8 billion from $43.6 billion in February. Exports slipped 0.9 percent after increasing 0.9 percent in February. Imports dropped 2.8 percent after rising 0.3 percent the month before. The U.S. trade balance in March narrowed on weaker imports. The trade gap shrank to $38.8 billion from $43.6 billion in February. Exports slipped 0.9 percent after increasing 0.9 percent in February. Imports dropped 2.8 percent after rising 0.3 percent the month before.
The improvement in the trade gap was primarily due to the nonpetroleum goods deficit which shrank to $34.8 billion in March from $38.6 billion the month before. The petroleum deficit improved to $21.1 billion versus $21.5 billion in February. The services surplus grew to $17.3 billion from $17.1 billion.
 The decline in imports appears to be related to reduced imports from China and lower oil prices. Also, U.S. businesses may have been concerned about softening growth in demand. The decline in imports appears to be related to reduced imports from China and lower oil prices. Also, U.S. businesses may have been concerned about softening growth in demand.
The latest trade deficit number may result in upward revisions to estimates for first quarter GDP. However, there still is the issue of whether imports softened due to U.S. businesses worrying about slippage in demand growth.
The manufacturing sector continues to sputter a bit with the latest indication coming from the PMI manufacturing index which, at 52.1, was nearly unchanged from the mid-month flash reading of 52.0. Order growth slowed significantly in the month as did employment. As orders slowed, manufacturers worked down backlogs which contracted in the month. On the plus side, inventories are not signaling any trouble and price pressures are easing.
 Strength in details masks what was a headline slowdown for the ISM index to 50.7 from 51.3. Positives in the report were acceleration for new orders, up 9 tenths to 52.3, and a back-to-back build in backlogs at 53.0. A drop in inventories, perhaps tied to concern over future demand, is a standout negative which weighed heavily on the composite headline index. Another negative was stalling in employment growth, but otherwise production increased and export orders were strong. Price pressures eased which is another positive. Most early indications on the April manufacturing are soft but the ISM report, given the strength in orders, points to a bit of strength. Strength in details masks what was a headline slowdown for the ISM index to 50.7 from 51.3. Positives in the report were acceleration for new orders, up 9 tenths to 52.3, and a back-to-back build in backlogs at 53.0. A drop in inventories, perhaps tied to concern over future demand, is a standout negative which weighed heavily on the composite headline index. Another negative was stalling in employment growth, but otherwise production increased and export orders were strong. Price pressures eased which is another positive. Most early indications on the April manufacturing are soft but the ISM report, given the strength in orders, points to a bit of strength.
Weakness in regional manufacturing reports for April continued with the latest report from the Dallas Fed.
Texas factory activity was flat in April, according to output. The production index fell from 9.9 to minus 0.5. The near-zero reading indicates output was little changed from March levels.
Ebbing growth in manufacturing activity was reflected in other survey measures as well. The capacity utilization index came in at 2.7, down from 5.5, and the shipments index fell to zero after rising to 10.6 in March. The new orders index fell nearly 14 points to minus 4.9, posting its first negative reading this year.
Perceptions of broader business conditions worsened sharply in April. The general business activity index plummeted from 7.4 to minus 15.6, reaching its lowest level since July 2012. The company outlook index turned negative as well, declining from 9.6 to minus 2.2.
 Labor market indicators remained mixed. The employment index has been in positive territory so far in 2013 and moved up to 6.3 in April. Twenty percent of firms reported hiring new workers compared with 14 percent reporting layoffs. The hours worked index pushed further negative, from minus 2.4 to minus 6.5. Labor market indicators remained mixed. The employment index has been in positive territory so far in 2013 and moved up to 6.3 in April. Twenty percent of firms reported hiring new workers compared with 14 percent reporting layoffs. The hours worked index pushed further negative, from minus 2.4 to minus 6.5.
Price pressures abated in April. Expectations regarding future business conditions fell markedly in April. The index of future general business activity fell 22 points to minus 6.7, its first negative reading in five months. The index of future company outlook also plunged, dropping from 21.6 to 6. Indexes for future manufacturing activity fell slightly this month.
 The ISM's non-manufacturing sample reported positive but slowing conditions in April with the composite index at 53.1 versus March's 54.4. The new orders index showed moderate growth, posting at 54.5, compared to 54.6 in March. The ISM's non-manufacturing sample reported positive but slowing conditions in April with the composite index at 53.1 versus March's 54.4. The new orders index showed moderate growth, posting at 54.5, compared to 54.6 in March.
Monthly employment growth, at 52.0 versus 53.3 in March, did slow in April but in contrast to the employment situation report which may suggest that the result from ISM's sample is an outlier.
The business activity index, largely reflecting production, was somewhat steady, slipping to 55.0 from 56.5 in March. This report points to moderate but continuing growth for the non-manufacturing sector.
Employment growth modestly improved in April—in contrast to the initial March numbers which suggested a stall in growth. Still, the labor market is sluggish—though positive. Manufacturing is barely positive while housing is posting moderate growth. Early data point to some deceleration in the second quarter—slower growth but not decline.
With limited news, the highlight for the U.S. is likely Thursday’s jobless claims report. After last week’s unexpected decline in initial claims and the somewhat better-than-expected employment situation report, traders will be watching to see if improvement continues. Consumer credit posts and a key issue is whether consumers are willing to pull out the plastic to spend. The revolving credit portion of credit outstanding recently has been weak. It could be a landmark day for bond traders when April’s Treasury budget report hits the wires. Some are anticipating that the federal government is going to make a payment to actually lower the debt and the April numbers could make the difference.
Consumer credit outstanding is surging but outside of student loans, it looks flat. Consumer credit jumped $18.1 billion in February for the largest increase in nearly 13 years and following a revised $12.7 billion in January. But gains continued to be confined almost entirely to non-revolving credit, in part reflecting strong vehicle sales but largely reflecting a continuing surge in student loans. Non-revolving credit rose $17.6 billion in February versus $11.1 billion in January and December's near record $18.3 billion. The February gain for revolving credit, the category that includes credit cards, was very thin, at $0.5 billion in February following a $1.7 billion gain in January.
Consumer credit Consensus Forecast for March 13: +$15.0 billion
Range: +$10.0 billion to +$20.0 billion
Initial jobless claims fell 18,000 in the April 27 week following a 13,000 decline in the prior week. The 324,000 level in the latest week was a new recovery low. The 4-week average was down a very big 16,000 to 342,250 which was the lowest rate since mid-March. Continuing claims rose 12,000 in data for the April 20 week but the 4-week average continued to move lower, down 18,000 to a new recovery low of 3.056 million.
Jobless Claims Consensus Forecast for 5/4/13: 335,000
Range: 326,000 to 341,000
Wholesale inventories fell 0.3 percent in February on a burst of sales. February's draw was concentrated in non-durable goods including food products, drugs, and farm products, all products where price swings often affect levels. Wholesale inventories for durable goods edged higher in the month but were outpaced by a slightly higher rate of sales. Total wholesale sales surged 1.7 percent, one of the strongest rates in two years but against an easy comparison with January when sales were soft. The draw in inventory together with the rise in sales pulled the stock-to-sales ratio in the wholesale sector down to 1.19 from January's slightly bloated 1.21.
Wholesale inventories Consensus Forecast for March 13: +0.4 percent
Range: -0.1 to +1.0 percent
The U.S. Treasury monthly budget report showed a March deficit that came in at $106.5 billion. Fiscal 2013 is so far a year of improvement for the government's deficit which, at a still enormous $600.5 billion, is nevertheless down 23 percent six months into the year. Tax receipts are up both from individuals and from corporations. Defense spending is down as are government credits for commerce and housing. Looking ahead, the month of April typically shows a surplus for the month. Over the past 10 years, the average surplus for the month of April has been $49.7 billion and $14.5 billion over the past 5 years. The April 2012 surplus came in at $59.1 billion.
Treasury Statement Consensus Forecast for April 13: +$107.5 billion
Range: +$106.0 billion to +$110.0 billion.
R. Mark Rogers is the author of The Complete Idiot’s Guide to Economic Indicators, Penguin Books.
Econoday Senior Writer Mark Pender contributed to this article.
|
