|
Equities ended the week with healthy gains despite mostly disappointing economic news. Bolstering stocks were generally better-than-expected earnings.
 At the start of the week, equities were led up by favorable reports, including from Halliburton, Hasbro and Caterpillar. But gains were held back by a sluggish report on existing home sales. Stocks advanced Tuesday despite a mid-day plunge triggered by a fake Twitter alert from Associated Press. The wild swing came after a tweet from the Associated Press's Twitter account claimed that there were two explosions in the White House and that President Barrack Obama had been injured. AP said on its corporate website that its account had been hacked. The day’s significant gains were led by earnings and favorable reports on new home sales and FHFA house prices. At the start of the week, equities were led up by favorable reports, including from Halliburton, Hasbro and Caterpillar. But gains were held back by a sluggish report on existing home sales. Stocks advanced Tuesday despite a mid-day plunge triggered by a fake Twitter alert from Associated Press. The wild swing came after a tweet from the Associated Press's Twitter account claimed that there were two explosions in the White House and that President Barrack Obama had been injured. AP said on its corporate website that its account had been hacked. The day’s significant gains were led by earnings and favorable reports on new home sales and FHFA house prices.
 At mid-week, equities were mixed, weighed down by a surprisingly negative report on durables orders. Upbeat earnings news from companies such as Ford and Boeing pushed back against the durables news. Better-than-expected initial jobless claims helped stocks to post moderate gains on Thursday. Favorable earnings from Cliffs Natural Resources lifted materials while Verizon boosted telecommunications. On Friday, a below expectations number for first quarter GDP bumped most stocks down although belief that the report will keep the Fed loose helped to offset the disappointment. At mid-week, equities were mixed, weighed down by a surprisingly negative report on durables orders. Upbeat earnings news from companies such as Ford and Boeing pushed back against the durables news. Better-than-expected initial jobless claims helped stocks to post moderate gains on Thursday. Favorable earnings from Cliffs Natural Resources lifted materials while Verizon boosted telecommunications. On Friday, a below expectations number for first quarter GDP bumped most stocks down although belief that the report will keep the Fed loose helped to offset the disappointment.
Equities were up this past week. The Dow was up 1.1 percent; the S&P 500, up 1.7 percent; the Nasdaq, up 2.3 percent; the Russell 2000, up 2.5 percent; and the Wilshire 5000, up 1.8 percent.
For the year-to-date, major indexes are up as follows: the Dow, up 12.3 percent; the S&P 500, up 10.9 percent; the Nasdaq, up 8.6 percent; the Russell 2000, up 10.1 percent; and the Wilshire 5000, up 11.3 percent.
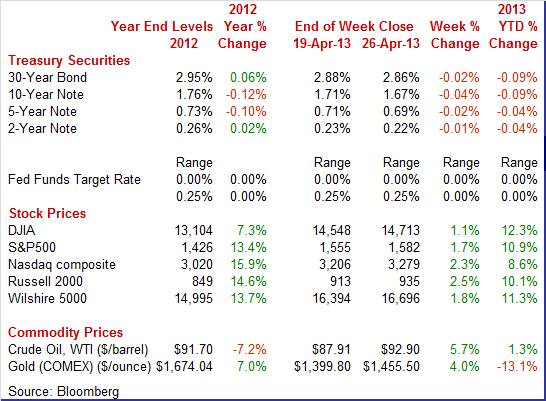
Weekly percent change column reflects percent changes for all components except interest rates. Interest rate changes are reflected in simple differences.
 Treasury yields ended the week down slightly. Rates nudged up or down daily, depending on whether the economic news beat or fell short of expectations. The most notable movement was Friday’s dip in rates on disappointing GDP. Overall, rates oscillated down modestly on the view that the economy is not as strong as earlier hoped. Treasury yields ended the week down slightly. Rates nudged up or down daily, depending on whether the economic news beat or fell short of expectations. The most notable movement was Friday’s dip in rates on disappointing GDP. Overall, rates oscillated down modestly on the view that the economy is not as strong as earlier hoped.
For this past week Treasury rates were down as follows: the 2-year note, down 1 basis point; the 5-year note, down 2 basis points; the 7-year note, down 2 basis points; the 10-year note, down 4 basis points; and the 30-year bond, down 2 basis points. The 3-month bill was unchanged for the week.
 Longer-term maturities continue to be under downward pressure from the Fed’s third round of quantitative easing which began in latter 2012 and from QE4 that began at the start of this year. Long rates have softened recently over flight to safety over European sovereign credit worries and slower economic growth. Recent assurances by key Fed officials that quantitative easing will continue until there is substantial improvement in unemployment also tugged down on rates in recent weeks. Longer-term maturities continue to be under downward pressure from the Fed’s third round of quantitative easing which began in latter 2012 and from QE4 that began at the start of this year. Long rates have softened recently over flight to safety over European sovereign credit worries and slower economic growth. Recent assurances by key Fed officials that quantitative easing will continue until there is substantial improvement in unemployment also tugged down on rates in recent weeks.
 The spot price for West Texas Intermediate rose sharply this past week on a variety of factors. On Monday, crude rose under a dollar after the Group of 20 meeting in Washington endorsed Japan's aggressive monetary easing program. Tuesday saw only a modest rise in WTI as favorable housing news in the U.S. was offset by disappointing April flash PMIs from China, the Eurozone, Germany, France and the US—signaling slower global growth. The spot price for West Texas Intermediate rose sharply this past week on a variety of factors. On Monday, crude rose under a dollar after the Group of 20 meeting in Washington endorsed Japan's aggressive monetary easing program. Tuesday saw only a modest rise in WTI as favorable housing news in the U.S. was offset by disappointing April flash PMIs from China, the Eurozone, Germany, France and the US—signaling slower global growth.
The big daily move for the week was Wednesday with WTI up more than $2 per barrel. The gain was spurred by a drop in gasoline supplies and a smaller-than-expected rise in crude stocks. WTI gained almost $2 per barrel Thursday on lower initial jobless claims. At week’s close, WTI edged down on below-expectations growth in first quarter GDP.
Net for the week, the spot price for West Texas Intermediate jumped $4.99 per barrel to settle at $92.90.
The recovery improved in the first quarter but details suggest softening ahead. Currently, the consumer and housing are providing most of the lift while manufacturing is struggling.
 The economy had some bounce in the first quarter as GDP growth showed some acceleration. But the details are not as encouraging as the headline. The first quarter grew 2.5 percent after a modest 0.4 gain in the fourth quarter. Analysts forecast a 3.1 percent boost in the first quarter. The economy had some bounce in the first quarter as GDP growth showed some acceleration. But the details are not as encouraging as the headline. The first quarter grew 2.5 percent after a modest 0.4 gain in the fourth quarter. Analysts forecast a 3.1 percent boost in the first quarter.
Demand growth was very sluggish with the weakest component being government purchases while the bright spot was consumer spending. Final sales of domestic product increased 1.5 percent after rising 1.9 percent in the fourth quarter. Final sales to domestic producers (which exclude net exports) improved to a 1.9 percent boost, after a 1.5 percent gain in the fourth quarter.
By components, inventory investment jumped to $50.3 billion from $13.3 billion. The big question is whether the second quarter boost was planned or unplanned. Personal consumption accelerated to 3.2 percent from an annualized 1.8 percent in the fourth quarter. Two notable subcomponent gains for PCEs included motor vehicle sales and utilities (the latter reflecting the impact of atypically cold weather). Also on the positive side, residential investment gained 12.6 percent, though at a slower pace than 17.6 percent the quarter before. Nonresidential fixed investment advanced but also at a softer rate, 2.1 percent versus the fourth quarter’s 13.2 percent.
On the downside, government purchases fell 4.1 percent, but not as much as the 7.0 percent annualized drop the quarter before. Slowing global growth is showing up as the net export gap worsened to $400.8 billion from $384.7 billion.
Headline inflation for the GDP price index showed mild acceleration to an annualized 1.2 percent in the first quarter from 1.0 percent the prior quarter. When excluding food and energy, inflation pressure posted at 1.5 percent, compared 1.3 percent the prior quarter.
While the headline disappointed, it did show improvement. However, the component detail suggests less forward momentum than the overall number. Looking ahead, the momentum for the consumer sector is mixed as some surveys show improvement in the consumer mood but spending growth likely will not show substantial growth without stronger hiring—and that currently is not the case. Inventories are up and a notable portion could be due to weaker-than-expected demand—meaning slower inventory orders ahead as suggested by manufacturing data. Business investment was positive but slowing. Housing is up and that may continue. Government spending was down and sequestration guarantees that trend will continue. Net exports weakened and recession in Europe suggests little improvement in coming quarters. Overall, the current numbers point to a slower second quarter.
 For the entire month, April was not quite as healthy as March was for consumer sentiment which was down to 76.4 from March's 78.6. But momentum was building during the latter half of the month based on the mid-month reading which was a surprisingly soft 72.3. The comparison points to an 80s reading for the last couple of weeks which is a good omen for May. For the entire month, April was not quite as healthy as March was for consumer sentiment which was down to 76.4 from March's 78.6. But momentum was building during the latter half of the month based on the mid-month reading which was a surprisingly soft 72.3. The comparison points to an 80s reading for the last couple of weeks which is a good omen for May.
 The current conditions index rose more than 5 points from mid-month but at 89.9 was a little bit shy of March's 90.7. This month-to-month comparison hints at a lack of strength this month for consumer-related indicators including retail sales and perhaps even jobs. The current conditions index rose more than 5 points from mid-month but at 89.9 was a little bit shy of March's 90.7. This month-to-month comparison hints at a lack of strength this month for consumer-related indicators including retail sales and perhaps even jobs.
At 67.8, the expectations index also rose from mid-month but likewise was shy of the March reading, at 70.8. But a separate reading on the 12-month economic outlook does point to at least a little bit of a gain, to 86 from 85.
Inflation expectations are stable and flat, at 3.1 percent for the 1-year outlook, down 1 tenth from March, and at 2.9 percent for the 5-year outlook for a 1 tenth increase.
 Supply of existing homes on the market is still low, which is a negative for sales but a big plus for prices. Sales for March came in at a 4.92 million rate, down 0.6 percent from February. The March decline followed gains in January and February of 0.8 percent and 0.2 percent. The latest reading left sales 10.3 percent above year-ago levels. Supply of existing homes on the market is still low, which is a negative for sales but a big plus for prices. Sales for March came in at a 4.92 million rate, down 0.6 percent from February. The March decline followed gains in January and February of 0.8 percent and 0.2 percent. The latest reading left sales 10.3 percent above year-ago levels.
Distressed homes—foreclosures and short sales–accounted for 21 percent of March sales, down from 25 percent in February and 29 percent in March 2012. Thirteen percent of March sales were foreclosures, and 8 percent were short sales.
Total supply at the March sales rate was 4.7 months which is up, but only slightly, from 4.6 months in February. Supply in March 2012 was 6.2 months. Only 30,000 units were added to inventory in the month versus an average March increase of 100,000 units. A reduction in distressed properties may be a factor limiting supply.
Price data in this report are strong, especially for the median which was up 6.2 percent from February to $184,300. The year-on-year rate was at plus 11.8 percent for the strongest rate since the boom days of 2005. The average price showed less strength, at plus 1.8 percent in the month, which is still strong, for a year-on-year rate of plus 9.9 percent. Note that price data in this report are not based on repeat transactions which add to their volatility.
Rising prices should eventually bring more homes into the market which would be a plus for sales. And April historically is a big month for homes coming into the market, from a range of 200,000 to 300,000 in a gain that would lift supply to the 5.0 month area. But for March at least, supply was tight and sales were soft.
 New home sales have been notably volatile over recent months—but at least they are averaging upward. New home sales rose 1.5 percent in March in an easy comparison with an unusually weak month in February. February fell 7.6 percent but followed a 14.1 percent surge in January. New home sales have been notably volatile over recent months—but at least they are averaging upward. New home sales rose 1.5 percent in March in an easy comparison with an unusually weak month in February. February fell 7.6 percent but followed a 14.1 percent surge in January.
Low supply, the result of tight credit and supply chain constraints in the residential construction sector, continues to hold down sales. The number of homes on the market did rise but only by a slight 3,000 to 153,000, and the gain was not enough to improve the month's supply which was unchanged at 4.4 months. This level of supply is consistent with a strong housing market such as the big bubble days of 2005, not with a slow market like today.
Curiously, price data in this report fell sharply in the month, down 6.8 percent for the median to $247,000. The year-on-year gain was only 3.0 percent, well down from the mid-teens through the second half of last year. The weak price readings likely reflect the composition of sales, specifically higher sales of lower priced homes. In any case, these readings conflict with wide signals of price strength as would be expected with a shortage of supply.
 Shortages of supply for housing markets continue to place upward pressure on prices. The FHFA price index for February improved 0.7 percent, following a gain of 0.6 percent the prior month. Shortages of supply for housing markets continue to place upward pressure on prices. The FHFA price index for February improved 0.7 percent, following a gain of 0.6 percent the prior month.
The year-on-year rate for February posted at plus 7.1 percent versus 6.6 percent for the month before.
While there has been improvement for a number of months, the U.S. index is 13.6 percent below its April 2007 peak and is roughly the same as the October 2004 index level. Still, improving prices will help add supply to the housing market.
 The latest durables orders report is one of the latest to point to a slowing in manufacturing. Durables orders dropped back to earth after soaring in February-and it was not just aircraft related. But the core rate unexpectedly fell. Both measures disappointed. The latest durables orders report is one of the latest to point to a slowing in manufacturing. Durables orders dropped back to earth after soaring in February-and it was not just aircraft related. But the core rate unexpectedly fell. Both measures disappointed.
New factory orders for durables declined 5.7 percent in March, following a 4.3 percent surge the month before. The transportation component declined 15.0 percent after a sharp 20.0 percent jump in February. Excluding transportation, durables orders decreased 1.4 percent after a drop of 1.7 percent in February.
 Within transportation, nondefense aircraft orders fell 48.2 percent, following a monthly spike of 86.4 percent in February. Defense aircraft declined 11.4 percent after falling 7.1 percent the prior month. However, the bright spot was a 0.2 percent rise in motor vehicle orders, following a 4.7 percent jump in February. Within transportation, nondefense aircraft orders fell 48.2 percent, following a monthly spike of 86.4 percent in February. Defense aircraft declined 11.4 percent after falling 7.1 percent the prior month. However, the bright spot was a 0.2 percent rise in motor vehicle orders, following a 4.7 percent jump in February.
Outside of transportation, component weakness was seen in all major industries.
Nondefense capital goods orders excluding aircraft partially rebounded, rising 0.2 percent in March after falling 4.8 percent February and jumping 6.7 percent in January. Shipments for this series rose 0.2 percent in March, following a gain of 1.2 percent the prior month.
Overall, new orders for durables were unexpectedly weak March and softness was widespread. While durables orders are volatile, the latest report adds to the argument that manufacturing is decelerating.
The news out of the manufacturing sector has been mixed at the very best with the April flash PMI pointing squarely to slowing growth at the beginning of the second quarter. The PMI slowed a sizable 2.6 points from the final March reading to 52.0 versus 54.6 and was down 2.9 points from last month's flash of 54.9.
New orders showed growth in the initial reading, but at 51.8 growth at a much slower rate than March's final reading of 55.4. With slower gains in new orders, manufacturers in the sample are working down their backlogs which, at a sub-50 reading of 48.8, contracted in the month.
 Both the Richmond Fed and Kansas City Fed showed declines in manufacturing activity in April. The Richmond Fed’s composite index fell into negative territory to minus 6 from March's plus 3. Both the Richmond Fed and Kansas City Fed showed declines in manufacturing activity in April. The Richmond Fed’s composite index fell into negative territory to minus 6 from March's plus 3.
Details were weak, including a second month of contraction for new orders, now at minus 8, compared to minus 4 in March. Backlogs worsened dramatically, falling to minus 21 in April from minus 14 the prior month.
Shipments were down in the region in the latest report. Employment growth remained positive but slowed did inventory accumulation.
 Manufacturing activity in the Kansas City Fed District continued to fall modestly in April at a pace similar to last month. Manufacturing activity in the Kansas City Fed District continued to fall modestly in April at a pace similar to last month.
The month-over-month composite index was minus 5 in April, equal to minus 5 in March but up from minus 10 in February. The composite index is an average of the production, new orders, employment, supplier delivery time, and raw materials inventory indexes.
The production index edged higher from minus 1 to plus 1, and the shipments index also increased, with both indexes moving into positive territory for the first time in 8 months. The employment index rebounded from minus 15 to minus 3, and the order backlog index also rose. The new orders and new orders for exports indexes were basically unchanged. Both inventory indexes fell further into negative territory after increasing last month.
Monetary policy is getting complicated with quantitative easing. It was largely under the radar, but it got more complicated sooner than expected with a downgrade this past week of the Bank of England by credit rater Fitch.
The Fitch press release explained its downgrade.
“Fitch Ratings has downgraded the Bank of England's (BoE) Long-term Issuer Default Rating (IDR) to 'AA+' from 'AAA' following the downgrade of the UK sovereign rating on 19 April 2012. The senior unsecured Short-term rating has been affirmed at 'F1+'. The Outlook is Stable.”
“BoE's Long-Term IDR is directly aligned with that of the UK government. The BoE is the monetary arm of the UK sovereign and as such its credit profile is aligned with that of the sovereign government. While central banks have unlimited capacity to create base money, in practice the net present value of seigniorage, the profit from money creation, is limited and typically channelled to the government. This reinforces the close link between the central bank and the sovereign ratings. The monetary financing flexibility and the international reserve currency status of the sterling are already reflected in the UK's sovereign ratings.”
For the U.S., the Fed has independent monetary authority (although Congress has final say on independence). While the Fed may not have much risk of an adverse credit downgrade, the Fed likely will have a reduction in operational profits as quantitative easing unwinds. Potentially, the fall in Fed contributions to the U.S. Treasury could have some effect on the U.S. government credit rating—though likely only minor. However, the issue of operational profits in a QE environment has been raised further by Fitch. This likely will increase debate within the Fed on how to unwind—emphasis on “how,” not “when.” Odds probably just went up that unwinding will focus more on maturation of assets rather than sales of Fed assets. And interest paid on excess reserves probably will become a key policy tool. Given the relative strength of the U.S. economy to other regions, the Fed’s operational profits is right now a modest issue that is going to gain attention.
The economy improved in the first quarter—although not as much as expected. Monthly numbers for March and April mostly were soft—pointing to a slowing in growth in the second quarter.
This week’s focus is on the consumer sector—notably Friday’s employment situation. After the unexpectedly weak rise in payrolls in March, the key market mover is likely the change in payroll employment. Momentum for the recovery recently has hinged on consumer spending and key updates will be the personal income report and motor vehicle sales from manufacturers. And the Fed posts its FOMC statement at midweek and traders will be parsing it for whether the economy is slowing or improving and whether there are any hints of changes in quantitative easing.
Personal income rebounded 1.1 percent in February after a drop of 3.7 percent in January and a 2.6 percent jump in December. The wages & salaries component gained 0.6 percent after declining 0.6 percent in January. Despite the increase in payroll taxes, consumer spending is holding up as personal spending jumped 0.7 percent after rising 0.4 percent in January. Turning to inflation, the overall PCE price index jumped 0.4 percent, following no change in January. However, the core rate in February rose a modest 0.1 percent, following a rise of 0.2 percent in the month before. Looking ahead from the March employment report, aggregate weekly earnings in the private sector improved a notable 0.5 percent in March, pointing to a healthy gain in the private wages & salaries component in personal income. Consumer spending may be soft in March as unit new vehicle sales were flat while retail sales excluding autos fell 0.4 percent. PCE inflation should be favorable as the headline CPI fell 0.2 percent in March while the core CPI edged up 0.1 percent.
Personal income Consensus Forecast for March 13: + 0.4 percent
Range: +0.2 to +0.5 percent
Personal consumption expenditures Consensus Forecast for March 13: +0.1 percent
Range: -0.1 to +0.3 percent
PCE price index Consensus Forecast for March 13: -0.1 percent
Range: -0.2 to +0.1 percent
Core PCE price index Consensus Forecast for March 13: +0.1 percent
Range: 0.0 to +0.2 percent
The pending home sales index in February slipped 0.4 percent to an index level of 104.8. The prior month was revised down slightly to a gain of 3.8 percent. Nonetheless, the pending home sales index for February posted at the second highest level in nearly three years.
Pending home sales Consensus Forecast for March 13: +0.7 percent
Range: -1.5 to +2.0 percent
The Dallas Fed general business activity index in March rose from 2.2 to 7.4, reaching its highest level in a year. The company outlook index moved up from 6.3 to 9.6. The production index rose from 6.2 in February to 9.9, indicating a slightly faster pace of output growth. Other survey measures also suggested a pickup in manufacturing activity, with the new orders and shipments indexes moving up strongly in March after dipping in February. The new orders index came in at 8.7, up from 2.8, and the shipments index rose 8 points to 10.6.
Dallas Fed general business activity index Consensus Forecast for April 13: 5.0
Range: 3.0 to 8.0
The employment cost index for the fourth quarter was up 0.5 percent, marginally higher than the 0.4 percent rate in the third quarter, but details are favorable. The increase in wages & salaries was steady and mild at 0.3 percent, which is the same rate as the third quarter, while growth in benefit costs actually slowed, to 0.6 percent from the third quarter's 0.8 percent. Year-on-year rates are also favorable with total compensation up 1.9 percent versus plus 2.0 percent in the third quarter with wages & salaries unchanged at a plus 1.7 percent rate and benefits slowing one tenth to plus 2.5 percent.
Employment cost index Consensus Forecast for Q1 13: +0.5 percent
Range: +0.4 to +1.6 percent
The S&P/Case-Shiller 20-city home price index (SA) posted a 1.0 percent advance in January. This was on top of gains of 0.9 percent and 0.6 percent in the prior two months. All 20 cities, for the second straight month, showed gains and in the month before that, 19 cities showed gains. The year-on-year rate showed an adjusted 20-city rise of 8.1 percent.
The S&P/Case-Shiller 20-city HPI (SA, m/m) Consensus Forecast for February 13: +1.0 percent
Range: +0.5 to +1.3 percent
The S&P/Case-Shiller 20-city HPI (NSA, m/m) Consensus Forecast for February 13: +0.3 percent
Range: +0.1 to +2.0 percent
The S&P/Case-Shiller 20-city HPI (NSA, y/y) Consensus Forecast for February 13: +9.0 percent
Range: +8.3 to +9.2 percent
The Chicago PMI in March was down 4.4 points to a 52.4 level that is still above 50 to indicate monthly expansion but at a lower rate of expansion than the 56.8 and 55.6 readings in the prior two months. New orders were still above 50 at 53.0 though the growth rate looked soft compared to February's unusually strong 60.2.
Chicago PMI Consensus Forecast for April 13: 52.4
Range: 51.0 to 54.2
The Conference Board's consumer confidence index in March fell more than eight points to 59.7, to nearly fully reverse February's gain from January. Higher payroll taxes, high gas prices and perhaps uncertainty over sequestration were negative factors. The assessment of future job conditions was down with more seeing fewer jobs opening up six months from now and fewer seeing more jobs. But the current assessment has a positive tone with those saying jobs-are-hard-to-get down seven tenths to 36.2 percent. More recent readings from other indexes have been mixed. Michigan’s consumer sentiment index dipped in April while the latest weekly number for Bloomberg’s consumer comfort index improved.
Consumer confidence Consensus Forecast for April 13: 62.0
Range: 57.0 to 66.0
Sales of total light motor vehicles for March came in at a strong 15.3 million annual rate but showed no significant difference from 15.4 million in February. The sales pace has been above 15 million units for the last five months. Domestic sales came in unchanged at 12.1 million.
Motor vehicle domestic sales Consensus Forecast for April 13: 12.0 million-unit rate
Range: 11.9 to 12.2 million-unit rate
Motor vehicle total sales Consensus Forecast for April 13: 15.3 million-unit rate
Range: 15.2 to 15.5 million-unit rate
ADP private payroll employment rose only 158,000 in March which was far below ADP's 237,000 count for February (revised). The Labor Department’s figure for private payrolls for March came in with a soft gain of 95,000.
ADP private payrolls Consensus Forecast for April 13: 155,000
Range: 110,000 to 180,000
The Markit PMI manufacturing flash index for April slowed a sizable 2.6 points from the final March reading to 52.0 versus 54.6 and was down 2.9 points from last month's flash of 54.9. New orders showed growth but, at 51.8, a much slower rate of growth than March's final reading of 55.4. With fewer new orders, manufacturers in the sample are working down their backlogs which, at a sub-50 reading of 48.8, contracted in the month.
Markit PMI manufacturing index (final) Consensus Forecast for April 13: 52.0
Range: 52.0 to 54.0
The composite index from the ISM manufacturing survey for March slowed to 51.3 for a sizable decline from 54.2 and 53.1 in the prior two months. New orders fell to 51.4 for a 6.4 point decline from February and compared with 53.3 in January. New orders have been moving up and down with four sub-50 readings since June last year.
ISM manufacturing composite index Consensus Forecast for April 13: 51.0
Range: 49.5 to 53.0
Construction spending rebounded 1.2 percent in February after dropping 2.1 percent in January. Private residential construction jumped 2.2 percent after slipping 0.1 percent the month before. For the latest month, the new one-family component was particularly strong, gaining 4.3 percent, following a 3.6 percent boost in January. The new multifamily component fell back 2.2 percent but followed a robust 6.1 percent jump the prior month. Public construction gained 0.9 percent, following a 0.2 percent rise in January.
Construction spending Consensus Forecast for March 13: +0.6 percent
Range: -0.3 to +1.1 percent
The FOMC announcement at 2:00 p.m. ET for the April 30-May 1 FOMC policy meeting is expected to leave the fed funds target rate unchanged at a range of zero to 0.25 percent. For some time, the focus will be on guidance language and comments on the status of the labor market. Debate on changes in quantitative easing is of key interest to markets but that detail likely will not show up until later FedSpeak and the FOMC minutes.
FOMC Consensus Forecast for 5/1/13 policy vote on fed funds target range: unchanged at a range of zero to 0.25 percent
The U.S. international trade gap in February unexpectedly narrowed somewhat. The trade gap improved to $43.0 billion from $44.5 billion in January. Exports rose 0.8 percent after declining 1.2 percent in January. Imports were unchanged after rebounding 1.8 percent. The shrinking in the trade gap was primarily due to the petroleum deficit which posted at $21.2 billion versus $24.3 billion in January. The nonpetroleum goods deficit expanded to $38.3 billion in February from $37.0 the month before. The services surplus grew to $17.3 billion from $17.2 billion.
International trade balance Consensus Forecast for March 13: -$42.4 billion
Range: -$45.0 billion to -$38.5 billion
Initial jobless claims declined 16,000 in the April 20 week to a 339,000 level. The 339,000 level is the lowest since early March with the 4-week average, at 357,500, the lowest since late March. There were no special factors. Continuing claims were down a very sizable 93,000 in the latest data to 3.000 million for a new recovery low. The 4-week average at 3.072 million is also a recovery low.
Jobless Claims Consensus Forecast for 4/27/13: 345,000
Range: 338,000 to 353,000
Nonfarm business productivity for the fourth quarter fell a revised annualized 1.9 percent, following a gain of 3.1 percent in the third quarter. Unit labor costs growth jumped an annualized 4.6 percent, following a 1.9 percent drop in the third quarter. Year-on-year, productivity was up 0.5 percent in the fourth quarter, down from 1.6 percent the quarter before. Year-ago unit labor costs were up 2.1 percent, compared to 0.1 in the third quarter. Hourly compensation was up 2.6 percent versus 1.7 percent in the third quarter.
Nonfarm Business Productivity Consensus Forecast for initial Q1 13: +1.3 percent annual rate
Range: +0.2 to +2.8 percent annual rate
Unit Labor Costs Consensus Forecast for initial Q1 13: +0.1 percent annual rate
Range: -1.0 to +2.4 percent annual rate
Nonfarm payroll employment in March rose a meager 88,000 after gaining 268,000 in February. Analysts forecast a 193,000 rise for March. Private payrolls increased 95,000 after rising 254,000 in February. Expectations were for a 200,000 gain. The unemployment rate edged down to 7.6 percent in March from 7.7 percent the prior month. The decline was due to a drop in the labor force. Average hourly earnings were flat in March, following a modest improvement of 0.1 percent for February. However, the average workweek edged up to 34.6 hours in March from 34.5 hours the prior month.
Nonfarm payrolls Consensus Forecast for April 13: 153,000
Range: 100,000 to 200,000
Private payrolls Consensus Forecast for April 13: 175,000
Range: 140,000 to 220,000
Unemployment rate Consensus Forecast for April 13: 7.6 percent
Range: 7.5 to 7.7 percent
Average workweek Consensus Forecast for April 13: 34.6 hours
Range: 34.4 to 34.7 hours
Average hourly earnings Consensus Forecast for April 13: +0.2 percent
Range: +0.1 to +0.3 percent
Factory orders in February saw a 3.0 percent rise with, in a special positive, January revised 1 full percentage point higher to minus 1.0 percent. Durable orders jumped 5.6 percent, revised 1 tenth lower from the advance report, with nondurable orders, benefiting from strong energy and food prices, up a strong 0.8 percent following a 1.4 percent gain in the prior month. More recently, new factory orders for durables declined 5.7 percent in March, following a 4.3 percent surge the month before.
Factory orders Consensus Forecast for March 13: -2.8 percent
Range: -4.5 to +0.4 percent
The composite index from the ISM non-manufacturing survey in March fell 1.6 points to a 54.4 level that indicates the slowest rate of monthly growth since July last year. Nonetheless, the latest reading was above 50, reflecting growth—but softer growth. New orders also slowed, down 3.6 points to 54.6. But backlog orders, unchanged at 54.5, continue to build in what is an especially good reading for this index.
ISM non-manufacturing composite index Consensus Forecast for April 13: 54.0
Range: 52.9 to 55.1
R. Mark Rogers is the author of The Complete Idiot’s Guide to Economic Indicators, Penguin Books. Econoday Senior Writer Mark Pender contributed to this article.
|
