|
While economic data in the U.S. have been somewhat volatile and recently on the soft side, central bank easing has kept equities up. And it has not just been the Fed—Bank of Japan easing and views on the People’s Bank of China came into play this past week.
 Equities were up this past week despite some disappointing news on the economic indicator front. The key reason—continued easy monetary policy in the U.S. and overseas. With little economic news, stocks rebounded Monday largely as a comeback from disappointing losses the prior week. Stocks climbed Tuesday with the Dow Jones industrials reaching a new record intraday high. The strength was partly due to benign Chinese inflation data, which eased concerns that the People's Bank of China might be forced to tighten monetary policy. Equities were up this past week despite some disappointing news on the economic indicator front. The key reason—continued easy monetary policy in the U.S. and overseas. With little economic news, stocks rebounded Monday largely as a comeback from disappointing losses the prior week. Stocks climbed Tuesday with the Dow Jones industrials reaching a new record intraday high. The strength was partly due to benign Chinese inflation data, which eased concerns that the People's Bank of China might be forced to tighten monetary policy.
Throughout the week, there was continued positive momentum in Asia that carried over to U.S. and other markets from the Bank of Japan's massive monetary stimulus announced last week
At mid-week, equities surged after an early release of Fed FOMC minutes indicated that the central bank, despite increased internal debate, would continue quantitative easing. The Dow and S&P500 hit record highs. Thursday, stocks gained further on a sharp drop in initial unemployment claims. Again, the Dow and S&P500 hit record highs.
But on Friday, there was some pullback as retail sales for March unexpectedly declined and early April consumer sentiment dropped sharply.
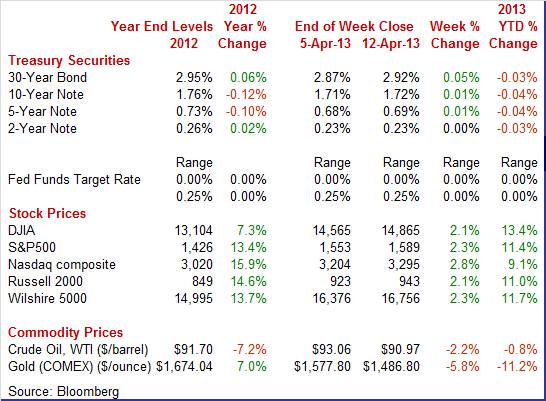
Equities were up this past week. The Dow was up 2.1 percent; the S&P 500, up 2.3 percent; the Nasdaq, up 2.8 percent; the Russell 2000, up 2.1 percent; and the Wilshire 5000, up 2.3 percent.
For the year-to-date, major indexes are up as follows: the Dow, up 13.4 percent; the S&P 500, up 11.4 percent; the Nasdaq, up 9.1 percent; the Russell 2000, up 11.0 percent; and the Wilshire 5000, up 11.7 percent.
Weekly percent change column reflects percent changes for all components except interest rates. Interest rate changes are reflected in simple differences.
 Treasury yields generally were little changed net for the week although there were some modest daily swings. On Monday, rates firmed on movement of funds into equities—related to Chinese data. After essentially no change Tuesday, rates firmed again on Wednesday. Bond traders took a different view of the Fed’s FOMC minutes, seeing increased leaning (although minority view) toward cutting back on quantitative easing as weighing less on rates. Treasury yields generally were little changed net for the week although there were some modest daily swings. On Monday, rates firmed on movement of funds into equities—related to Chinese data. After essentially no change Tuesday, rates firmed again on Wednesday. Bond traders took a different view of the Fed’s FOMC minutes, seeing increased leaning (although minority view) toward cutting back on quantitative easing as weighing less on rates.
After little change Thursday, rates declined moderately but notably on Friday after a disappointing retail sales report and drop in consumer sentiment.
For this past week Treasury rates were flat or mostly little changed as follows: 3-month T-bill, unchanged; the 2-year note, unchanged; the 5-year note, up 1 basis point; the 7-year note, unchanged; the 10-year note, up 1 basis point; and the 30-year bond, up 5 basis points.
 The price of crude fell moderately this past week. Two days are what counted. After marginal increases Monday through Wednesday, the spot price of West Texas Intermediate declined a dollar a barrel on Thursday despite a drop in jobless claims as the International Energy Agency trimmed forecasts for global oil demand. The reason for the downgrade is expected weak demand for fuel in Europe. The price of crude fell moderately this past week. Two days are what counted. After marginal increases Monday through Wednesday, the spot price of West Texas Intermediate declined a dollar a barrel on Thursday despite a drop in jobless claims as the International Energy Agency trimmed forecasts for global oil demand. The reason for the downgrade is expected weak demand for fuel in Europe.
On Friday, spot WTI fell $2-1/2 per barrel on the decline in retail sales and lower consumer sentiment.
Net for the week, the spot price for West Texas Intermediate dropped $2.09 per barrel to settle at $90.97.
The consumer sector just got a downgrade, inflation is subdued, and the Fed is holding steady on policy despite increased debate.
 The consumer sector may be losing some steam—although special factors are making it an uncertain call. Retail sales in March came in below expectation and weakness was broad based. Retail sales declined 0.4 percent, following a surge of 1.0 percent in February Market expectations were for no change. The consumer sector may be losing some steam—although special factors are making it an uncertain call. Retail sales in March came in below expectation and weakness was broad based. Retail sales declined 0.4 percent, following a surge of 1.0 percent in February Market expectations were for no change.
Ex-auto sales in March declined 0.4 percent after a jump of 1.0 percent in February (originally up 1.0 percent). The consensus projected a 0.1 percent advance for March. Gasoline sales were down significantly on lower prices. Excluding both autos and gasoline components, sales slipped 0.1 percent after increasing 0.3 percent in February (originally up 0.4 percent). Analysts forecast a 0.3 percent gain.
 Motor vehicle sales decreased 0.6 percent, following a 1.3 percent rise in February. The auto dip was in line with earlier numbers on unit auto sales but the level was still moderately strong. On lower prices, gasoline sales fell 2.2 percent after spiking 5.4 percent in February. Motor vehicle sales decreased 0.6 percent, following a 1.3 percent rise in February. The auto dip was in line with earlier numbers on unit auto sales but the level was still moderately strong. On lower prices, gasoline sales fell 2.2 percent after spiking 5.4 percent in February.
Core subcomponent weakness was broad based with decreases seen in electronics & appliances; food & beverage stores; health & personal care; sporting goods, hobby, book & music stores; and general merchandise.
Gains were seen in furniture & furnishings; building materials & garden equipment; clothing & accessories; miscellaneous store retailers; nonstore retailers; and food services & drinking places.
Higher payroll taxes appear to be finally kicking in—cutting into consumer spending. However, atypically cold weather in March likely dampened sales in a number of subcomponents—including clothing & accessories; building materials & garden equipment; and general merchandise. We are likely to see improvement in these components as weather returns to more seasonal patterns. However, the latest retail sales data are probably nudging down forecasts for first quarter GDP and perhaps outlying quarters.
 It appears that the consumer is uncertain—the consumer just cannot decide what to think about the economy. Volatility is sweeping the consumer sentiment report—a big drop following a big surge following a big drop. Consumer sentiment is down very steeply so far in early April, at 72.3 versus a scorching mid-80s pace in the last two weeks of March and versus a soft low 70s pace in the first two weeks of March. Final March came in near a recovery high at 78.6. It appears that the consumer is uncertain—the consumer just cannot decide what to think about the economy. Volatility is sweeping the consumer sentiment report—a big drop following a big surge following a big drop. Consumer sentiment is down very steeply so far in early April, at 72.3 versus a scorching mid-80s pace in the last two weeks of March and versus a soft low 70s pace in the first two weeks of March. Final March came in near a recovery high at 78.6.
The current conditions component of this report offered early news on April and the news was not good with the index down nearly 6 points to 84.8 which was the lowest reading since mid-January. This reading raises an early warning signal for the April retail sales report, although reversal of atypical seasonal effects could offset.
 But prospects further out for the consumer sector may have to be downgraded. Expectations fell nearly 6-1/2 points from final March to 64.2 which however was above last month's mid-month reading of 61.7. A separate reading on the 12-month economic outlook was down 6 points to 79. But prospects further out for the consumer sector may have to be downgraded. Expectations fell nearly 6-1/2 points from final March to 64.2 which however was above last month's mid-month reading of 61.7. A separate reading on the 12-month economic outlook was down 6 points to 79.
 Despite a sharp deceleration in the fourth quarter, businesses are remaining cautious about putting inventories on the shelves. Businesses kept down their inventory growth in February. Given the weakness in many March indicators including last week's employment report and the latest retail sales report, this is good news—meaning there likely will not be a sharp inventory adjustment in retail, wholesale, and manufacturing activity. Despite a sharp deceleration in the fourth quarter, businesses are remaining cautious about putting inventories on the shelves. Businesses kept down their inventory growth in February. Given the weakness in many March indicators including last week's employment report and the latest retail sales report, this is good news—meaning there likely will not be a sharp inventory adjustment in retail, wholesale, and manufacturing activity.
Business inventories rose only 0.1 percent in February which was well below a 1.2 percent rise in business sales. The much higher rate of sales growth drove down the stock-to-sales ratio to 1.28, compared to an already lean 1.29 in January.
Inventory management is a fine art and the nation's businesses, based on February's slowing build, are well prepared for a slowing in demand. Note that slowing inventory growth may be a negative for the inventory component of GDP but is a plus for sustainable growth in output and in employment.
 The import & export price report showed very little inflationary pressures. Import prices fell 0.5 percent in March with the year-on-year rate at minus 2.7 percent. Swings in petroleum prices, down 1.9 percent in March, weighed on the monthly headline for this report, but when excluding petroleum the trend is still dead flat: minus 0.1 percent in March, no change in February, and plus 0.1 percent in both January and December. The year-on-year ex-petroleum reading was minus 0.2 percent. The import & export price report showed very little inflationary pressures. Import prices fell 0.5 percent in March with the year-on-year rate at minus 2.7 percent. Swings in petroleum prices, down 1.9 percent in March, weighed on the monthly headline for this report, but when excluding petroleum the trend is still dead flat: minus 0.1 percent in March, no change in February, and plus 0.1 percent in both January and December. The year-on-year ex-petroleum reading was minus 0.2 percent.
 Components, excluding agriculture, showed a wide sweep of negatives for the month and mostly negatives for the year-on-year readings. Prices of finished goods also show a sweep of declines in March with year-on-year rates at a low of minus 0.4 percent for capital goods and at a high of plus 0.7 percent for imported vehicles. Components, excluding agriculture, showed a wide sweep of negatives for the month and mostly negatives for the year-on-year readings. Prices of finished goods also show a sweep of declines in March with year-on-year rates at a low of minus 0.4 percent for capital goods and at a high of plus 0.7 percent for imported vehicles.
On the export side, higher costs for agricultural products are a big factor for an upward trend. Despite a 1.8 percent downswing in March, export prices were still up 8.8 percent year-on-year. But outside of agriculture, there are plenty of zeros and minuses on the export side of the table with total export prices down 0.4 percent in March and with the year-on-year rate at only plus 0.3 percent.
Overall, import prices were favorable for the consumer and export prices were favorable to farmers that actually had crops despite draught. Specifically for the consumer, lower oil prices are showing up as lower gasoline prices at the pump and this will help the Fed maintain loose monetary policy.
 The headline number was much weaker than expected but it was almost all related to a fall in gasoline prices. The March producer price index fell back 0.6 percent after a strong 0.7 percent boost in February. The core rate, which excludes both food and energy, increased 0.2 percent after rising 0.2 percent in February. Analysts expected a 0.2 percent increase. The headline number was much weaker than expected but it was almost all related to a fall in gasoline prices. The March producer price index fell back 0.6 percent after a strong 0.7 percent boost in February. The core rate, which excludes both food and energy, increased 0.2 percent after rising 0.2 percent in February. Analysts expected a 0.2 percent increase.
 Food prices rebounded 0.8 percent after falling 0.5 in February. Energy costs in March dropped 3.4 percent, following a 3.0 percent boost the month before. Gasoline fell 6.8 percent after spiking 7.2 percent in February. Food prices rebounded 0.8 percent after falling 0.5 in February. Energy costs in March dropped 3.4 percent, following a 3.0 percent boost the month before. Gasoline fell 6.8 percent after spiking 7.2 percent in February.
Within the core, almost one-quarter of the March advance can be traced to prices for civilian aircraft, which rose 0.7 percent. Also, pharmaceuticals increased 0.4 percent. Key players in the core, passenger car prices gained 0.2 percent while light trucks were flat.
For the overall PPI, the year-ago rate eased to 1.1 percent from 1.8 percent February (seasonally adjusted). The core rate held steady at 1.7 percent. On a not seasonally adjusted basis for February, the year-ago headline PPI was up 1.1 percent, while the core was up 1.7 percent.
The debate within the Fed picked up over when to slow the pace of quantitative easing. However, the FOMC meeting was before the latest and dismal employment report. Despite minority worries, most participants saw QE as having a meaningful effect on the economy. Few saw QE risks outweighing the benefits.
Regarding the economy, the minutes reflected the view expressed at the chairman’s press conference that the economy, including the labor market, was improving. This, of course, was prior to the latest employment situation report.
“The information reviewed at the March 19-20 meeting suggested that economic activity was expanding at a moderate rate in the first quarter of this year after the slowdown late last year. Private-sector employment increased at a fairly solid pace, on balance, and the unemployment rate, though still elevated, was slightly lower in February than in the fourth quarter of last year. Consumer price inflation, excluding some temporary fluctuations in energy prices, was subdued, while measures of longer-run inflation expectations remained stable.”
Fed staff economists gave a moderately favorable evaluation of U.S. financial markets, although Europe remained a concern.
As noted in the FOMC quarterly forecasts released March 20, FOMC participants left forecasts for economic growth little changed, calling for moderate growth.
“Meeting participants generally indicated that they viewed the economic data received during the intermeeting period as somewhat more positive than had been expected, but that fiscal policy appeared to have become more restrictive, leaving the outlook for the economy little changed on balance since the January meeting. Participants judged that the economy had returned to moderate growth following a pause late last year, and a few noted that the downside risks may have diminished. “
As heard in recent FedSpeak, there was quite a bit of internal debate about the benefits and costs of quantitative easing. One key point of the debate was whether the Fed should purchase only Treasuries and not mortgage-backed securities.
There was not much new news in the minutes, given that the forecasts were already released and that Chairman Bernanke explained much in the press conference after the release of the statement. One interesting item to come out of the minutes is that more guidance is likely to come—on the Fed’s balance sheet effects on the Treasury’s budget. The Fed transfers each year’s profits from operations to the Treasury and the remittances have been substantial at times. During unwinding of the Fed’s balance sheet, the Fed may actually lose money (buying Treasuries at high prices and selling lower). So, the Fed will eventually provide guidance on this path and essentially say, don’t worry.
The bottom line is that the doves still dominated the FOMC and QE continues. The latest and sluggish jobs report means that the hawks may tone down their rhetoric for an early tapering of QE.
The consumer appears to be growing a bit cautious—although atypical seasonal issues need to play out to really determine. Nonetheless, this sector at worst is likely slowing, not declining. And the Fed is determined to keep monetary policy quite loose for some time.
Housing and manufacturing take center stage. Housing sales have been volatile during winter months but homebuilders will be laying out their true feelings with the NAHB housing market index for April and housing starts for March. Manufacturing has shown off and on signs of re-gaining strength. This week’s updates will be Empire State for April and national industrial production for March.
The Empire State manufacturing index in March was mostly positive. The Empire State index, at 9.24, was well above zero to indicate monthly growth in the New York manufacturing sector but growth, however, that's slightly slower than February's 10.04. The rate of monthly growth in new orders, however, slowed with a reading of 8.18 versus 13.31 in January.
Empire State Manufacturing Survey Consensus Forecast for April 13: 7.50
Range: 2.50 to 10.50
NAHB housing market index dipped in March as home builders blamed lack of available lots and lack of available credit for a two point downturn in the housing market index to 44, off from a recovery peak of 47 hit in December and January and further below breakeven 50 to indicate that more builders describe conditions as bad than good. Weakness was centered in the present sales component, down four points to 47 which is a negative indication for current new home sales. But the report's two other components -- sales six months out and traffic -- both showed gains. Six month sales rose one point to 51 which is the best reading since November. The traffic component bounced three points higher to 35, still well below 50 but going in the right direction.
NAHB housing market index Consensus Forecast for April 13: 45
Range: 44 to 46
The consumer price index for February jumped 0.7 percent, following no change in January. The core CPI—excluding food and energy—softened to a 0.2 percent rise after increasing a strong 0.3 percent in January. By major components outside the core, energy jumped a monthly 5.4 percent after a decline of 1.7 percent in January. Gasoline surged a monthly 9.1 percent after falling 3.0 percent in January. For the core measure, the indexes for shelter, used cars and trucks, recreation, and medical care all rose in February. These increases more than offset declines in the indexes for new vehicles, apparel, airline fares, and tobacco.
CPI Consensus Forecast for March 13 0.0 percent
Range: -0.1 to +0.2 percent
CPI ex food & energy Consensus Forecast for March 13: +0.2 percent
Range: +0.1 to +0.2 percent
Housing starts made a partial comeback in February, but more importantly, housing permits made a sizeable gain. In February, housing starts rebounded 0.8 percent, following a drop of 7.3 percent the prior month. The February starts annualized level of 0.917 million units was up 27.7 percent on a year-ago basis. The increase in starts was led by a monthly 1.4 percent increase in the multifamily component after a 19.2 percent decline in January. The single-family component rose 0.5 percent after dipping 0.3 percent in January. Permits continue on a moderate uptrend, rising 4.6 percent to an annual pace of 0.946 million units. Strength was seen in single-family and multifamily permits.
Housing starts Consensus Forecast for March 13: 0.930 million-unit rate
Range: 0.885 million to 0.944 million-unit rate
Housing permits Consensus Forecast for March 13: 0.942 million-unit rate
Range: 0.905 million to 0.952 million-unit rate
Industrial production in February improved sharply. Overall industrial production jumped 0.7 percent in February after no change in January. The manufacturing component rebounded 0.8 percent, following a 0.3 percent drop in January. The rate of motor assemblies remained strong and rose 3.6 percent after a 4.9 percent drop in January. Other industries generally showed healthy gains. Excluding motor vehicles, manufacturing gained 0.6 percent in February after a 0.1 percent increase the prior month. The output of utilities increased 1.6 percent in February while production at mines dipped 0.3 percent. Capacity utilization for total industry advanced to 79.6 percent from 79.2 percent in January. Looking ahead to March, the prospects for manufacturing are not as bright. National manufacturing growth is likely to be down as production worker hours fell 0.4 percent in March. This should pull down on the manufacturing component in industrial production. This is in contrast with the consensus.
Industrial production Consensus Forecast for March 13: +0.2 percent
Range: -0.1 to +0.6 percent
Manufacturing production component Consensus Forecast for March 13: +0.1 percent
Range: -0.1 to +0.4 percent
Capacity utilization Consensus Forecast for March 13: 78.3 percent
Range: 78.1 to 79.8 percent
The Beige Book being prepared for the June 18-19 meeting will be released in the afternoon. Attention will likely focus on changes in the labor market as Fed guidance is now partially based on labor market conditions.
Initial jobless claims plunged 42,000 in the April 6 week to a 346,000 level. The March 30 week, which was shortened for Easter, was revised 3,000 higher for a 31,000 jump. Big swings like this put the emphasis on the 4-week average which, at 358,000, was the highest since February. This suggests that the trend for the jobs market, despite the big improvement in the latest week, is no better than flat. Improvement in continuing claims may be slowing. Continuing claims did fall 12,000 in data for the March 30 week, but the 4-week average was up 5,000 from the prior week's recovery low to 3.079 million
Jobless Claims Consensus Forecast for 4/13/13: 347,000
Range: 330,000 to 350,000
The general business conditions index of the Philadelphia Fed's Business Outlook Survey in March posted at plus 2.0, slightly over breakeven zero and indicating modest monthly growth. It was also well above February’s reading of minus 12.5. New orders, at plus 0.5, showed improvement from February’s minus 7.8.
Philadelphia Fed survey Consensus Forecast for April 13: 3.3
Range: 0.0 to 6.5
The Conference Board's index of leading indicators was up 0.5 percent in February, the same rate of growth from an upwardly revised 0.5 percent in January.
Strength was broad based with eight of 10 components showing monthly gains. Financial readings are strong positives including the report's leading credit component. Rising use of credit points to resilience for consumer spending and business spending. A special plus for February was a rise in building permits which points to strength for the housing sector. Also up was the factory workweek which indicates strength in manufacturing.
Other readings included a 0.2 percent gain for the coincident index which signals a modest rate of current growth.
Leading indicators Consensus Forecast for March 13: +0.2 percent
Range: -0.4 to +0.6 percent
R. Mark Rogers is the author of The Complete Idiot’s Guide to Economic Indicators, Penguin Books.
Econoday Senior Writer Mark Pender contributed to this article.
|
