|
The month’s highlight posted on Friday and it actually was a lowlight. Payroll employment growth for March essentially stalled to a snail’s pace. This is a bump in the road for the recovery—stronger employment growth is needed, not slower growth. Other indicators out this past week mostly slowed also but remained positive.
 Equities declined notably for the week. Weakness was largely due to disappointing economic news. At the start of the week, the ISM manufacturing index fell below expectations—more than offsetting a positive report on construction outlays. Stocks mostly rebounded Tuesday on better-than-expected factory orders data and on an easing in concern over the Cyprus banking crisis. The Cypriot government completed talks on the terms for aid with the troika of officials representing the International Monetary Fund, the European Central Bank and the European Union. Cyprus was granted two extra years to 2018 to implement measures linked to its bailout. Equities declined notably for the week. Weakness was largely due to disappointing economic news. At the start of the week, the ISM manufacturing index fell below expectations—more than offsetting a positive report on construction outlays. Stocks mostly rebounded Tuesday on better-than-expected factory orders data and on an easing in concern over the Cyprus banking crisis. The Cypriot government completed talks on the terms for aid with the troika of officials representing the International Monetary Fund, the European Central Bank and the European Union. Cyprus was granted two extra years to 2018 to implement measures linked to its bailout.
Stocks fell back at mid-week on a variety of factors. The ADP private employment report was softer than analysts’ projections. Saber rattling by North Korea worried markets. And FedSpeak indicated that quantitative easing might slow before year end. Equities improved Thursday despite an unexpected drop in initial jobless claims. But offsetting that, the Bank of Japan shocked markets with ambitious plans to fight deflation with further quantitative easing, including purchases of Japanese government bonds, or JGBs, as well as the exchange traded funds (ETF).
But the week ended on a sour note as equities dropped significantly after the March employment report showed a sharp slowing in payroll job growth.
Equities were down this past week. The Dow was down 0.1 percent; the S&P 500, down 1.0 percent; the Nasdaq, down 1.9 percent; the Russell 2000, down 3.0 percent; and the Wilshire 5000, down 1.3 percent.
For the year-to-date, major indexes are up as follows: the Dow, up 11.1 percent; the S&P 500, up 8.9 percent; the Nasdaq, up 6.1 percent; the Russell 2000, up 8.7 percent; and the Wilshire 5000, up 9.2 percent.
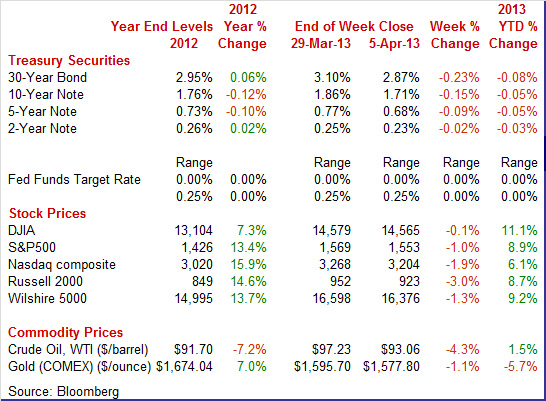
Weekly percent change column reflects percent changes for all components except interest rates. Interest rate changes are reflected in simple differences.
 Treasury yields were notably down this past week. Rates eased slightly on Monday’s sluggish ISM manufacturing report but edged up on Tuesday on a gain in factory orders. The rest of the week it was all about disappointing labor market news and flight to safety. Rates fell notably Wednesday, Thursday, and Friday on the ADP private employment report, initial jobless claims, and then the employment situation report. The below expectations ISM non-manufacturing report also tugged down on rates on Wednesday. Treasury yields were notably down this past week. Rates eased slightly on Monday’s sluggish ISM manufacturing report but edged up on Tuesday on a gain in factory orders. The rest of the week it was all about disappointing labor market news and flight to safety. Rates fell notably Wednesday, Thursday, and Friday on the ADP private employment report, initial jobless claims, and then the employment situation report. The below expectations ISM non-manufacturing report also tugged down on rates on Wednesday.
 Generally, funds moved into bonds on weakness in equities and also over worries about North Korea. The Bank of Japan’s new quantitative easing program also weighed on rates. Generally, funds moved into bonds on weakness in equities and also over worries about North Korea. The Bank of Japan’s new quantitative easing program also weighed on rates.
For this past week Treasury rates were down as follows: the 2-year note, down 2 basis points; the 5-year note, down 9 basis points; the 7-year note, down 8 basis points; the 10-year note, down 15 basis points; and the 30-year bond, down 23 basis points. The 3-month T-bill was unchanged.
Over the last several weeks, longer maturity yields have softened on flight to safety over Cyprus, mostly dovish comments by Fed officials, and this week on disappointing economic news.
 The spot price of crude dropped significantly this past week. The biggest daily moves were Wednesday and Thursday. The spot price of crude dropped significantly this past week. The biggest daily moves were Wednesday and Thursday.
But setting the week’s situation, spot WTI on Monday eased after Exxon Mobile shut down the Pegasus pipeline after a leak of heavy Canadian crude in Arkansas. This pipeline carries crude from Illinois to the U.S. Gulf Coast. The shutdown boosted crude inventories which are not reaching refineries.
On Wednesday, the Pegasus shutdown showed up in a sizeable jump in the government’s report on crude stockpiles. Spot WTI dropped $2-1/2 for the day. Thursday, crude declined a buck a barrel on the spike in initial jobless claims. WTI was down marginally Friday after the jobs report.
Net for the week, the spot price for West Texas Intermediate dropped $4.17 per barrel to settle at $93.06.
This past week, there were significant signs of slowing—especially in the labor market. But growth was still positive.
 The March employment report was very disappointing even though the unemployment rate eased—for the wrong reason. Total payroll jobs rose a meager 88,000 after gaining 268,000 in February (originally up 236,000). Analysts forecast a 193,000 rise for March. The net revisions for January and February were up 61,000. The unemployment rate edged down to 7.6 percent in March from 7.7 percent the prior month. The consensus projected a 7.7 percent unemployment rate. The decline was due to a drop in the labor force. The March employment report was very disappointing even though the unemployment rate eased—for the wrong reason. Total payroll jobs rose a meager 88,000 after gaining 268,000 in February (originally up 236,000). Analysts forecast a 193,000 rise for March. The net revisions for January and February were up 61,000. The unemployment rate edged down to 7.6 percent in March from 7.7 percent the prior month. The consensus projected a 7.7 percent unemployment rate. The decline was due to a drop in the labor force.
 Turning back to payroll data, private payrolls increased 95,000 after rising 254,000 in February (originally 246,000). Expectations were for a 200,000 gain. Turning back to payroll data, private payrolls increased 95,000 after rising 254,000 in February (originally 246,000). Expectations were for a 200,000 gain.
In the private sector, relative strength was service-providing sectors—which were still soft. Service-providing jobs increased 79,000 after a 181,000 rise in February. The March rise was led by subcomponents for healthcare, up 23,400; temporary help, up 20,300; and leisure, up 17,000. The impact of higher payroll taxes finally may be kicking in as retail jobs fell 24,100. An alternative possible explanation—at least in part—is that significantly cooler spring weather has cut into retail sales and employment in that sector.
Goods-producing jobs rose 16,000 after a 73,000 jump in February. Construction advanced 18,000 in the latest month with mining edging up 1,000. Manufacturing employment slipped 3,000.
Government jobs declined 7,000 in March, following an increase of 14,000 the month before. The March drop was mostly from cuts in the labor force for the U.S. Postal Service, showing an 11,700 decrease in jobs. This was not related to sequestration—this factor has had minimal impact so far.
Wage growth was dead in the water for the average worker. Average hourly earnings were flat in March, following a modest improvement of 0.1 percent for February. Analysts called for a 0.2 percent gain. However, the average workweek edged up to 34.6 hours in March from 34.5 hours the prior month. This had a positive effect on overall earnings. The market consensus was for 34.5 hours.
Turning to detail for the household survey, household employment in March fell 206,000 after a 170,000 gain the month before. The labor force dropped even faster, down 496,000 after a 130,000 dip in February. The labor force participation rate is at its lowest since May 1979.
Looking ahead, the latest employment numbers were mixed for March industrial production and personal income. National manufacturing growth is likely to be down as production worker hours fell 0.4 percent in March. This should pull down on the manufacturing component in industrial production. On the positive side, aggregate weekly earnings in the private sector improved a notable 0.5 percent in March, pointing to a healthy gain in the private wages & salaries component in personal income. This was mainly due to an increase in workweek hours. However, look for offset from a decline in government wages & salaries.
The March employment report can only be described as dismal despite the dip in the unemployment rate. The sharp deceleration in hiring will keep Fed policy loose even though the unemployment rate is now part of its policy guidance. The Fed has clarified that it is looking at a broad range of labor market measures and outside of the unemployment rate, other measures showed little progress. And the Fed will know that the unemployment rate slipped for the wrong reason—more discouraged workers. Aggregate earnings were up but there still are the headwinds on spending from higher payroll taxes.
 Motor vehicle sales are holding at healthy levels despite the recent boost in payroll taxes and sluggish employment growth. Total vehicle sales came in at a strong 15.3 million annual rate but showed no significant difference from 15.4 million in February. The sales pace has been above 15 million units for the last five months. Motor vehicle sales are holding at healthy levels despite the recent boost in payroll taxes and sluggish employment growth. Total vehicle sales came in at a strong 15.3 million annual rate but showed no significant difference from 15.4 million in February. The sales pace has been above 15 million units for the last five months.
Domestic sales came in unchanged at 12.1 million. Vehicle sales make up about 1/5 of total retail sales.
For the upcoming retail sales report, the unit sales numbers point either way, depending on price effects.
There are cross currents in the auto market. On the downside, employment growth has softened and individual after-tax income is down. On the positive side, rates are very low, the auto fleet aged over the recession, and electronics in vehicles are getting consumer attention. Also, income tax returns are finally coming in and that may boost sales.
 Consumer credit is surging but outside of student loans, it looks flat. Consumer credit jumped $18.1 billion in February for the largest increase in nearly 13 years and following a revised $12.7 billion in January. Consumer credit is surging but outside of student loans, it looks flat. Consumer credit jumped $18.1 billion in February for the largest increase in nearly 13 years and following a revised $12.7 billion in January.
But gains continue to be confined almost entirely to non-revolving credit, in part reflecting strong vehicle sales but largely reflecting a continuing surge in student loans. Non-revolving credit rose $17.6 billion in February versus $11.1 billion in January and December's near record $18.3 billion. Part of the gain in student loans in the non-revolving category is due to government agency purchases of loans from private lenders.
The February gain for revolving credit, the category that includes credit cards, was very thin, at $0.5 billion in February following a $1.7 billion gain in January which together come up shy against December's $4.4 billion contraction.
Consumer credit outstanding is jumping but little of it points to rising spending habits outside of autos.
 The U.S. trade balance in February unexpectedly narrowed somewhat. The trade gap improved to $43.0 billion from $44.5 billion in January. Exports rose 0.8 percent after declining 1.2 percent in January. Imports were unchanged after rebounding 1.8 percent. The U.S. trade balance in February unexpectedly narrowed somewhat. The trade gap improved to $43.0 billion from $44.5 billion in January. Exports rose 0.8 percent after declining 1.2 percent in January. Imports were unchanged after rebounding 1.8 percent.
The shrinking in the trade gap was primarily due to the petroleum deficit which posted at $21.2 billion versus $24.3 billion in January. The nonpetroleum goods deficit expanded to $38.3 billion in February from $37.0 the month before. The services surplus grew to $17.3 billion from $17.2 billion.
The gain in goods exports reflected increases in industrial supplies and materials ($1.8 billion); other goods ($0.5 billion); and automotive vehicles, parts, and engines ($0.2 billion). Decreases occurred in capital goods ($0.8 billion); consumer goods ($0.3 billion); and foods, feeds, and beverages ($0.1 billion).
Even though the trade deficit narrowed, it was negative in terms of reflecting weakness in international trade—that is, global demand has softened, likely due to recession in Europe. This is not good news for U.S. manufacturing. However, the trade data are adding to the argument by some economists for a 3 percent-plus first quarter for GDP. The real deficit slipped to $47.4 billion from $48.1 billion in January.
National manufacturing surveys moved somewhat in opposite directions but both the Markit PMI and ISM’s composite index stayed above breakeven of 50.
Manufacturing continued to expand at a solid rate based on Markit's PMI index which came in at 54.6 in March, in line with the mid-month flash reading of 54.9 and slightly above February's 54.3. A plus 50-reading indicates month-to-month growth with March's final rate indicating slightly faster growth than in February. However, the lower final reading indicates that the second half of the month was not as strong.
The new orders index posted at 55.4, unchanged from February. Export orders, at 51.8 versus a sub-50 reading of 48.5 in February, showed monthly growth which is especially good news given wide concern about foreign demand.
Output was strong at 56.6 as was employment at 54.6. Inventory readings showed slight builds.
 The ISM manufacturing report indicated softening in growth for this sector. Orders are coming in, but not at a very fast rate, at least based on the ISM manufacturing report where the headline index slowed to 51.3 in March for a sizable decline from 54.2 and 53.1 in the prior two months. New orders fell to 51.4 for a 6.4 point decline from February and compared with 53.3 in January. New orders have been moving up and down with four sub-50 readings since June last year. The ISM manufacturing report indicated softening in growth for this sector. Orders are coming in, but not at a very fast rate, at least based on the ISM manufacturing report where the headline index slowed to 51.3 in March for a sizable decline from 54.2 and 53.1 in the prior two months. New orders fell to 51.4 for a 6.4 point decline from February and compared with 53.3 in January. New orders have been moving up and down with four sub-50 readings since June last year.
But new export orders were very solid in the report, rising 2.5 points to a 56.0 level that is the best since April last year. Employment was also very positive, at 54.2 to indicate the strongest rate of hiring since June.
Net, the Markit and ISM reports suggest some deceleration (not decline) in manufacturing.
 The ISM non-manufacturing composite index fell 1.6 points to a 54.4 level that indicates the slowest rate of monthly growth since July last year. Nonetheless, the latest reading is above 50, reflecting growth—but softer growth. The ISM non-manufacturing composite index fell 1.6 points to a 54.4 level that indicates the slowest rate of monthly growth since July last year. Nonetheless, the latest reading is above 50, reflecting growth—but softer growth.
The employment index was down a sizable 3.9 points to 53.3, still indicating monthly growth, but monthly growth at a slowing rate.
New orders are also slowing, down 3.6 points to 54.6. But backlog orders, unchanged at 54.5, continue to build in what is an especially good reading for this index. Business activity remains steady and strong and deliveries are slowing which is another sign of strength.
Overall, while growth is positive, the ISM non-manufacturing report is pointing toward slower growth in the second quarter.
 Probably the positive highlight for economic indicators this past week was construction spending. Housing continues to gain traction, leading the rebound in construction outlays in the latest report. Probably the positive highlight for economic indicators this past week was construction spending. Housing continues to gain traction, leading the rebound in construction outlays in the latest report.
Construction outlays rebounded 1.2 percent in February after dropping 2.1 percent in January. Private residential construction jumped 2.2 percent after slipping 0.1 percent the month before. For the latest month, the new one-family component was particularly strong, gaining 4.3 percent, following a 3.6 percent boost in January. The new multifamily component fell back 2.2 percent but followed a robust 6.1 percent jump the prior month. Public construction gained 0.9 percent, following a 0.2 percent rise in January.
On a year-ago basis, overall construction was up 7.9 percent in February compared to 6.1 percent in January.
The construction sector appears to be adding to first quarter economic growth. However, seasonal factors and atypical weather can have large effects during winter months.
Most of the economic news this past week was disappointing. However, all key monthly indicators still showed growth, albeit slower growth. Most numbers for the first quarter are in, though certainly not all. And so far, it looks like we will get a moderately strong number for first quarter GDP. But we may see slower growth for the second quarter. There may be a bump in the road for the recovery, but so far, it appears to be a small one.
After this past week’s very disappointing employment report, markets will be watching for signs of health in the consumer sector. The highlight is likely the retail sales report for March which could be affected by cool weather and an early Easter. Also closely watched will be consumer sentiment, out on Friday. And initial jobless claims unexpectedly jumped this past week. Traders likely will hope for reversal this week.
The NFIB Small Business Optimism Index in February rose a solid 1.9 points to 90.8 in February. Inventory building, which is often a sign of optimism, led February's gain followed by plans to increase capital outlays which is another sign of optimism. Gains were widespread across components and also included a rise in current job openings. Despite the month's strengths, the report noted that the index level remains in recessionary ground.
NFIB Small Business Optimism Index Consensus Forecast for March 13: 90.6
Range: 89.0 to 92.0
Wholesale inventories in January jumped 1.2 percent against a 0.8 percent decline in wholesale sales. This mismatch lifted the stock-to-sales ratio up to 1.21 versus 1.19 in December for the highest reading since October. Taken out to three decimals, January's ratio is the highest of the recovery. The build was spread widely across the sector including lumber and computer equipment and a small build for autos.
Wholesale inventories Consensus Forecast for February 13: +0.5 percent
Range: +0.2 to +1.4 percent
The Minutes of the March 19-20 FOMC meeting are scheduled for release at 2:00 p.m. ET. Traders will be parsing the text for signs of early withdrawal of quantitative easing after some Fed officials last week hinted at that.
The U.S. Treasury monthly budget report for February reflected an upward trend in tax receipts and a slowing in spending growth as the government's deficit is coming down. The Treasury deficit in February looks big, at $203.5 billion, but February, when receipts are low, is typically a high deficit month and the latest total is slightly under the $208 billion average of the last six years. Looking ahead, the month of March typically shows a moderate deficit for the month. Over the past 10 years, the average deficit for the month of March has been $107.6 billion and $138.3 billion over the past 5 years. The March 2012 deficit came in at $198.2 billion.
Treasury Statement Consensus Forecast for March 13: -$172.4 billion
Range: -$180.0 billion to -$107.0 billion.
Initial jobless claims for the March 30 week spiked 28,000 to 385,000 for the sharpest weekly increase and the highest level of the year. The 4-week average also showed its largest increase and highest level of the year, up 11,250 to 354,250. A partial offset to the rise in initial claims was a decline in continuing claims, down 8,000 to 3.063 million in the latest available data which is for the March 23 week. The 4-week average, in contrast to initial claims, is at a recovery low, down 11,000 to 3.067 million.
Jobless Claims Consensus Forecast for 4/6/13: 365,000
Range: 350,000 to 375,000
Import prices were up a sharp 1.1 percent in February, but only because of oil. Excluding petroleum products, import prices were unchanged to extend a very flat trend—plus 0.1 percent in January and December and unchanged in November. Year-on-year rates are also flat and are actually negative, at minus 0.3 percent, for total import prices which include petroleum. Export prices are also up, 0.8 percent higher and reflecting a 2.0 percent monthly jump for agricultural products, largely due to the Midwest drought.
Import prices Consensus Forecast for March 13: -0.5 percent
Range: -0.7 to +0.9 percent
Export prices Consensus Forecast for March 13: +0.1 percent
Range: -0.3 to +0.6 percent
The producer price index in February producer price index increased a strong 0.7 percent, following a rebound of 0.2 percent in January. The boost was largely energy related. The core rate, which excludes both food and energy, rose 0.2 percent—matching the prior month’s pace. Food prices declined 0.5 percent after jumping 0.7 percent in January. Energy costs in February accelerated to a 3.0 percent boost, following a 0.4 percent decline the prior month. Gasoline spiked 7.2 percent, following a monthly decrease of 2.1 percent in January. Within the core, about 20 percent of the February increase was traced to prices for pharmaceutical preparations, which moved up 0.2 percent. Passenger car prices gained 0.3 percent while light trucks rose 0.1 percent.
PPI Consensus Forecast for March 13: -0.2 percent
Range: -0.7 to +0.5 percent
PPI ex food & energy Consensus Forecast for March 13: +0.2 percent
Range: -0.1 to +0.2 percent
Retail sales in February were strong despite payroll tax increases and delayed income tax refunds. Retail sales jumped 1.1 percent, following a rise of 0.2 percent in January. Motor vehicle sales rebounded a sizeable 1.1 percent, following a 0.3 percent dip in January. Ex-auto sales in February increased 1.0 percent, following boost of 0.4 percent the month before. On higher prices, gasoline sales spiked a monthly 5.0 percent in February, following a 0.7 percent increase the prior month. Gasoline sales were up significantly. Excluding both autos and gasoline components, sales gained 0.4 percent after increasing 0.3 percent in January. Core subcomponent strength was widely scattered. For the upcoming March numbers, cool weather may have dampened sales of spring apparel while an early Easter may have boosted sales. Also, consumers may be noticing reduced take home pay due to higher payroll taxes. Flat unit new motor vehicle sales could tip the auto component in either direction, depending on price discounting for the month.
Retail sales Consensus Forecast for March 13: 0.0 percent
Range: -0.6 to +0.7 percent
Retail sales excluding motor vehicles Consensus Forecast for March 13: +0.1 percent
Range: -0.2 to +0.8 percent
Less motor vehicles & gasoline Consensus Forecast for March 13: +0.3 percent
Range: -0.1 to +0.6 percent
The Reuter's/University of Michigan's consumer sentiment index showed an unusually sharp second half swing which put a final reading for March at 78.6 versus a mid-month reading of 71.8. The final reading implied a mid-80s pace for the final two weeks of the month which is the very strongest pace of the whole recovery. As is, the 78.6 level was up 1 point from February for the fourth highest reading of the recovery, behind low 80 readings late last year and a 79-plus reading back in May. The current conditions component, at 90.7, was a recovery best. Less strong was the expectations component at 70.8 which was well down from nearly 80 readings late last year though it is up six tenths from February.
Consumer sentiment Consensus Forecast for preliminary April 13: 79.0
Range: 72.0 to 84.5
Business inventories in January jumped 1.0 percent on a surprisingly heavy build in retail vehicles. A 1.9 percent increase in retail autos & parts was the strongest build in six months and reflected strong demand for autos. Autos also were building in the wholesale sector. Overall, inventory build was roughly in line with demand and likely will add to first quarter GDP growth. Inventories to sales were up a bit but still relatively low.
Business inventories Consensus Forecast for February 13: +0.4 percent
Range: +0.2 to +0.6 percent
R. Mark Rogers is the author of The Complete Idiot’s Guide to Economic Indicators, Penguin Books.
Econoday Senior Writer Mark Pender contributed to this article.
|
