|
During a holiday shortened trading week, economic news was mostly positive—especially for some readings on the consumer sector. Housing numbers showed typical winter volatility. And Cyprus banking issues did not derail financial markets—at least for now.
 Equities ended the week up despite concern about Cyprus and other European debt problems. The week was shortened by the Good Friday holiday. Equities ended the week up despite concern about Cyprus and other European debt problems. The week was shortened by the Good Friday holiday.
However, stocks headed down at the start of the week as investors evaluated the Cyprus bailout package (taxing bank deposits) and its potential ramifications for other debt strapped Eurozone nations. Equities rebounded sharply on Tuesday on positive numbers on Case-Shiller home prices and durable goods orders. However, new home sales took a breather in February and consumer confidence was weaker than anticipated.
 Stocks were mixed on Wednesday as pending home sales eased but markets in the U.S. calmed about the Cyprus situation. Equities gained moderately on Thursday despite a rise in initial jobless claims. Fourth quarter GDP growth was revised up. Stocks were mixed on Wednesday as pending home sales eased but markets in the U.S. calmed about the Cyprus situation. Equities gained moderately on Thursday despite a rise in initial jobless claims. Fourth quarter GDP growth was revised up.
While equities were closed on Friday, the personal income report was quite positive and could impact Monday's opening.
U.S. shares ended the week, month and quarter on an upbeat note with the S&P 500 closing at a new record high. The index eclipsed its previous closing high which was set in October 2007. The gains were broad based.
 Equities were up this past week. The Dow was up 0.5 percent; the S&P 500, up 0.8 percent; the Nasdaq, up 0.7 percent; the Russell 2000, up 0.6 percent; and the Wilshire 5000, up 0.8 percent. Equities were up this past week. The Dow was up 0.5 percent; the S&P 500, up 0.8 percent; the Nasdaq, up 0.7 percent; the Russell 2000, up 0.6 percent; and the Wilshire 5000, up 0.8 percent.
Equities were up in March. The Dow was up 3.7 percent; the S&P 500, up 3.6 percent; the Nasdaq, up 3.4 percent; the Russell 2000, up 4.4 percent; and the Wilshire 5000, up 3.8 percent.
 Equities were up in the first quarter. The Dow was up 11.3 percent; the S&P 500, up 10.0 percent; the Nasdaq, up 8.2 percent; the Russell 2000, up 12.0 percent; and the Wilshire 5000, up 10.7 percent. Equities were up in the first quarter. The Dow was up 11.3 percent; the S&P 500, up 10.0 percent; the Nasdaq, up 8.2 percent; the Russell 2000, up 12.0 percent; and the Wilshire 5000, up 10.7 percent.
For the year-to-date, major indexes are up as follows: the Dow was up 11.3 percent; the S&P 500, up 10.0 percent; the Nasdaq, up 8.2 percent; the Russell 2000, up 12.0 percent; and the Wilshire 5000, up 10.7 percent. The year-to-date numbers match the first quarter growth rates.
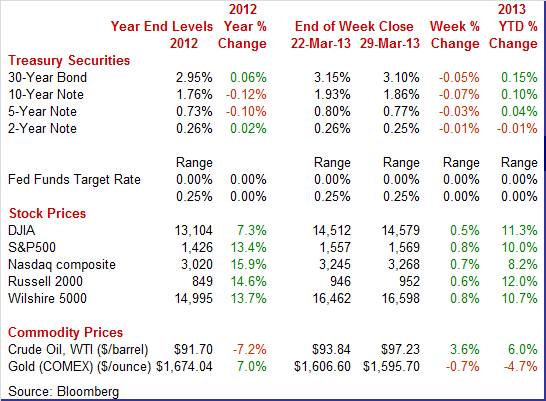
Weekly percent change column reflects percent changes for all components except interest rates. Interest rate changes are reflected in simple differences.
 In a shortened trading week, Treasury yields eased moderately. Rates nudged lower on Monday on concerns about Cyprus—flight to safety but to a mild degree. Tuesday saw slippage in yields on below expectations for consumer confidence. In a shortened trading week, Treasury yields eased moderately. Rates nudged lower on Monday on concerns about Cyprus—flight to safety but to a mild degree. Tuesday saw slippage in yields on below expectations for consumer confidence.
The biggest move during the week was on Wednesday—but was still moderate. Flight to safety was the theme as investors worried about the outcome of banks reopening in Cyprus on Thursday. Also, traders took note of Italy’s inability to form a government.
Nonetheless, this past week’s movement in Treasuries was relatively muted. The U.S. economy is seen as relatively strong and safe.
For this past week Treasury rates were down as follows: the 2-year note, down 1 basis point; the 5-year note, down 3 basis points; the 7-year note, down 8 basis points; the 10-year note, down 7 basis points; and the 30-year bond, down 5 basis points. The 3-month T-bill was unchanged.
 The price of crude rose throughout this past week. Oil traders saw developments in Cyprus as positive (relative to other potential outcomes). Also, the U.S. recovery was seen as gaining traction. The biggest daily move in spot WTI was Tuesday with a gain of about $1-3/4. This was due to an unexpectedly strong increase in durables orders. The price of crude rose throughout this past week. Oil traders saw developments in Cyprus as positive (relative to other potential outcomes). Also, the U.S. recovery was seen as gaining traction. The biggest daily move in spot WTI was Tuesday with a gain of about $1-3/4. This was due to an unexpectedly strong increase in durables orders.
Net for the week, the spot price for West Texas Intermediate gained $3.39 per barrel to settle at $97.23.
For the U.S. there are headwinds from higher payroll taxes and sequestration, but for now the economic boat is tacking moderately well. And we are seeing mostly positive numbers for the consumer sector. Housing is oscillating upward through the volatile winter months. And manufacturing is mixed but mostly positive.
 Economic growth was revised marginally higher into positive territory. Real GDP growth for the fourth quarter was revised up to an annualized rate of plus 0.4 percent from the second estimate of 0.1 percent and compared to a third quarter gain of 3.1 percent. Economic growth was revised marginally higher into positive territory. Real GDP growth for the fourth quarter was revised up to an annualized rate of plus 0.4 percent from the second estimate of 0.1 percent and compared to a third quarter gain of 3.1 percent.
The upward revision was largely due to a smaller net export gap, stronger growth in nonresidential structures, and somewhat higher inventory growth.
Demand numbers were revised up slightly. Final sales of domestic product came in at 1.9 percent-up from the second estimate of 1.7 percent. Final sales to domestic purchasers were nudged up to 1.5 percent versus the second estimate of 1.4 percent.
Headline inflation for the GDP price index posted a 1.0 percent annualized inflation rate versus the second estimate of 0.9 percent. When excluding food and energy, inflation was revised to 1.3 percent, versus the second estimate of 1.2 percent.
The GDP data for the fourth quarter are looking somewhat stale. First quarter data are looking moderately better despite the increase in payroll taxes. And as the Fed has stated, the fourth quarter slowdown was largely due to temporary factors, including weather.
 While individuals are coping with higher payroll taxes, aggregate personal income posted a sizeable gain in February and personal spending rose significantly. However, headline and core inflation were divergent. We are still seeing the impact of the fiscal cliff on data as February numbers reflect some normalcy after January data included after effects of acceleration of income to December to partially avoid income tax increases for some income brackets. While individuals are coping with higher payroll taxes, aggregate personal income posted a sizeable gain in February and personal spending rose significantly. However, headline and core inflation were divergent. We are still seeing the impact of the fiscal cliff on data as February numbers reflect some normalcy after January data included after effects of acceleration of income to December to partially avoid income tax increases for some income brackets.
Personal income rebounded 1.1 percent in February after a drop of 3.7 percent in January and a 2.6 percent jump in December. The wages & salaries component gained 0.6 percent after declining 0.6 percent in January. Strength in February was in wages & salaries, dividend income and in a sharp reduction in the change in contributions for government social insurance (a negative for personal income). Payroll taxes spiked in January but the rates held steady in February. This was a fiscal cliff issue as was partially the dividend income. Too a notable degree dividend income that would have been seen in January was accelerated to December to avoid higher taxes for some income brackets.
 Despite the increase in payroll taxes, consumer spending is holding up—and it is not just due to higher gasoline prices. Personal spending jumped 0.7 percent after rising 0.4 percent in January. Strength was in nondurable goods, reflecting higher gasoline prices. Still, real spending was up 0.3 percent, matching the January pace. Consumer outlays are relatively strong and point to a healthy Q1 GDP number. Despite the increase in payroll taxes, consumer spending is holding up—and it is not just due to higher gasoline prices. Personal spending jumped 0.7 percent after rising 0.4 percent in January. Strength was in nondurable goods, reflecting higher gasoline prices. Still, real spending was up 0.3 percent, matching the January pace. Consumer outlays are relatively strong and point to a healthy Q1 GDP number.
Turning to inflation, the overall PCE price index jumped 0.4 percent, following no change in January. The core rate in February rose a modest 0.1 percent, following a rise of 0.2 percent in the month before.
Year-on-year, headline prices were up 1.3 percent in February versus 1.3 percent in January. The core was up 1.3 percent, compared to 1.3 percent the prior month. Despite volatility in the month ago headline numbers, the trend is that measured inflation is soft. This will give the Fed room to keep monetary policy easy for some time.
Despite headwinds of high unemployment, high gasoline prices, and worries about Europe and fiscal sequestration, the consumer (at least those employed) is voting with the wallet and so far in 2013, the consumer is moderately positive. Apparently, it is relative—the economy is much healthier in 2013 than in 2008. Consumers with jobs are doing their part to keep the recovery going.
 For March, the Conference Board’s consumer confidence index fell more than eight points to 59.7, to nearly fully reverse February's gain from January. Higher payroll taxes, high gas prices and perhaps uncertainty over sequestration were negative factors. For March, the Conference Board’s consumer confidence index fell more than eight points to 59.7, to nearly fully reverse February's gain from January. Higher payroll taxes, high gas prices and perhaps uncertainty over sequestration were negative factors.
The assessment of future job conditions was down with more seeing fewer jobs opening up six months from now and fewer seeing more jobs. But the current assessment has a positive tone with those saying jobs-are-hard-to-get down seven tenths to 36.2 percent. This is a key reading for expectations for the monthly employment report.
Income expectations, another key reading, were only slightly lower.
In contrast, Reuters/University of Michigan consumer sentiment showed a boost in the consumer mood. The latest consumer sentiment report showed an unusually sharp second half swing which put a final reading for March at 78.6 versus a mid-month reading of 71.8. The final reading implies a mid-80s pace for the final two weeks of the month which is the very strongest pace of the whole recovery. As is, the 78.6 level was up 1 point from February for the fourth highest reading of the recovery, behind low 80 readings late last year and a 79-plus reading back in May.
The current conditions component, at 90.7, was a recovery best and points to strength for March economic data including the employment report and perhaps the retail sales report. Less strong was the expectations component at 70.8 which was well down from nearly 80 readings late last year though it is up six tenths from February.
The dramatic surge the last two weeks in this report is difficult to explain. Though economic data have been strong lately and the stock market is at record highs, the gain nevertheless may be tied to volatility in the report itself. However, the weekly Bloomberg consumer comfort index has been oscillating upward as a separate measure of the consumer mood.
In sum, the consumer is generally reporting ongoing strength in the economy but is less upbeat about the outlook, the result no doubt of higher payroll taxes and uncertainty over the effects of sequestration.
 New home sales for February did not show the same strength that earlier released existing home sales showed—but the level was still moderately strong. Sales declined 4.6 percent to an annualized pace of 411,000. But this followed a strong 13.1 percent jump in January. Sales are up 12.3 percent on a year-ago basis. New home sales for February did not show the same strength that earlier released existing home sales showed—but the level was still moderately strong. Sales declined 4.6 percent to an annualized pace of 411,000. But this followed a strong 13.1 percent jump in January. Sales are up 12.3 percent on a year-ago basis.
Importantly, seasonal factors are large for winter months and volatility is common over these months.
One modest positive was a rise in houses for sale to 152,000 from 150,000 in January. The combination of a dip in sales and rise in supply put months' supply at 4.4 months, compared to 4.2 months in January. Low supply recently has been constraining sales.
 Existing home sales, which opened the year with solid gains, are likely to be flat in the next report or two based on the pending home sales index. The number of contracts signed to purchase an existing home in February slipped 0.4 percent to an index level of 104.8. The prior month was revised down slightly to a gain of 3.8 percent. Existing home sales, which opened the year with solid gains, are likely to be flat in the next report or two based on the pending home sales index. The number of contracts signed to purchase an existing home in February slipped 0.4 percent to an index level of 104.8. The prior month was revised down slightly to a gain of 3.8 percent.
Nonetheless, the pending home sales index for February posted at the second highest level in nearly three years.
The Northeast, which is the smallest region for home sales, showed a 2.5 percent decline with the other regions near zero.
 Home price appreciation is accelerating straight up based on S&P Case-Shiller where the monthly adjusted rise for the 20-city index was at plus 1.0 percent in January. This is on top of gains of 0.9 percent and 0.6 percent in the prior two months. All 20 cities, for the second straight month, showed gains and in the month before that, 19 cities showed gains. Home price appreciation is accelerating straight up based on S&P Case-Shiller where the monthly adjusted rise for the 20-city index was at plus 1.0 percent in January. This is on top of gains of 0.9 percent and 0.6 percent in the prior two months. All 20 cities, for the second straight month, showed gains and in the month before that, 19 cities showed gains.
The year-on-year rate is even more persuasive, showing an adjusted 20-city rise of plus 8.1 percent. This follows gains in prior months of 6.9 percent, 5.5 percent, 4.2 percent, 2.9 percent, and 2.0 percent.
Year-on-year rates for individual cities are led by Phoenix at a whopping 23.2 percent with eight of the 20 cities showing double-digit gains.
Unadjusted data also showed an 8.1 percent year-on-year rise while the monthly reading, reflecting seasonal winter weakness, was up 0.1 percent.
This report confirms the positive outlook for home prices this year, a factor that, for homeowners at least, should help offset the impact of higher payroll taxes. Higher home prices will bring more supply into market and boost consumer confidence.
 The durables orders series is volatile but it appears that momentum for manufacturing is edging upward. The durables orders series is volatile but it appears that momentum for manufacturing is edging upward.
For the latest report, aircraft led durables orders to soar in February—but the core disappointed with a modest decline. New factory orders for durables jumped a monthly 5.7 percent, following a 3.8 percent decrease in January.
The transportation component rebounded a sharp 21.7 percent in February after dropping 17.8 percent the prior month. Transportation was led by nondefense aircraft orders but motor vehicles and defense aircraft also rose.
Excluding transportation, durables orders slipped 0.5 percent in February after a 2.9 percent gain the month before. On average, momentum is still healthy.
 Outside of transportation, industry strength was seen in electrical equipment, up 2.9 percent; primary metals, up 1.7 percent; and computers & electronics, up 1.3 percent. Declines were led by communications equipment, down 7.6 percent, and fabricated metals, down 4.4 percent. Outside of transportation, industry strength was seen in electrical equipment, up 2.9 percent; primary metals, up 1.7 percent; and computers & electronics, up 1.3 percent. Declines were led by communications equipment, down 7.6 percent, and fabricated metals, down 4.4 percent.
Nondefense capital goods orders excluding aircraft fell back 2.7 percent after rebounding a sizeable 6.7 percent in January. However, shipments for this series gained 1.9 percent in February, following a dip of 0.7 percent the prior month.
Overall, manufacturing is regaining momentum after volatility in orders is smoothed.
 Growth was down in the Chicago area in March but followed strong growth rates in February and January. The Chicago index was down 4.4 points to a 52.4 level that is still above 50 to indicate monthly expansion but at a lower rate of expansion than the 56.8 and 55.6 readings in the prior two months. Growth was down in the Chicago area in March but followed strong growth rates in February and January. The Chicago index was down 4.4 points to a 52.4 level that is still above 50 to indicate monthly expansion but at a lower rate of expansion than the 56.8 and 55.6 readings in the prior two months.
New orders were still above 50 at 53.0 though the growth rate looks soft compared to February's unusually strong 60.2. With new orders slowing, Chicago businesses are working down their backlog which was down nearly 6 points to a sub-50 level of 45.0 that indicates monthly contraction.
Yet an indication that Chicago businesses are still upbeat was a solid plus-50 reading for employment, at 55.1 which is very respectable and combines with 55.7 and 58.0 in the prior two months to point to a relatively brisk rate of hiring.
The Chicago report, which tracks all areas of the city's economy, can be very volatile month to month which puts the emphasis on the trend. And the trend for this report, March slowing aside, still points to solid expansion.
The recovery continues despite headwinds from Europe, payroll taxes, and uncertainty regarding sequestration. Economic momentum—while less than traditional for recoveries—has consolidated and continues at a somewhat improved pace.
Traders will be anticipating Friday’s employment report for March. February numbers were somewhat on the high side (for this recovery) and the issue is whether the improvement continues. Early in the week, strength of the consumer sector will be measured by motor vehicle sales, ADP employment, and jobless claims.
Sales of total light motor vehicles have been very strong the last four months, above a 15 million annual unit rate compared to low 14 million rates through much of last year. The February-to-January comparison is marginally favorable, at 15.4 million versus 15.3 million. Sales of domestics held steady at 12.1 million units. The numbers could improve in March once income tax refunds return to normal after the IRS recognized fiscal cliff tax legislation at the last minute of 2012. A boost to motor vehicle sales would help improve momentum in the recovery.
Motor vehicle domestic sales Consensus Forecast for March 13: 12.1 million-unit rate
Range: 12.1 to 12.2 million-unit rate
Motor vehicle total sales Consensus Forecast for March 13: 15.4 million-unit rate
Range: 15.3 to 15.6 million-unit rate
The Markit PMI manufacturing flash index for March rose six tenths to 54.9 versus the final February reading of 54.3. Any reading above 50 indicates monthly growth, and the further over 50 indicates a greater rate of growth. Orders gained with new orders at 55.9, for a 1.5 point gain, with new export orders moving back above 50 to 51.2 for a sizable 2.7 point increase.
No consensus numbers are available for this release
The composite index from the ISM manufacturing survey for February offered very good news, reflected in a 1.1 point gain for the headline index to 54.2, and acceleration in new orders which jumped 4.5 points to a very strong 57.8. A plus in this report was strength in new orders for exports, which accelerated to 53.5 for a 3-1/2 point gain. Total backlogs were especially strong in the ISM report, at 55.0 for a big 7-1/2 point gain.
ISM manufacturing composite index Consensus Forecast for March 13: 54.0
Range: 51.6 to 55.0
Construction spending fell 2.1 percent in January after a 1.1 percent increase the month before. Public construction declined 1.0 percent in the latest month while private nonresidential outlays dropped 5.1 percent. New home outlays jumped 3.3 percent although residential excluding new homes (largely renovation) declined 4.3 percent. The latest report is positive for housing overall but negative for the public and nonresidential sectors. The first likely is being supported by low mortgage rates and low supply. The latter two are likely being held back by fiscal issues of the federal government and revenue shortfalls at the state & local government level.
Construction spending Consensus Forecast for February 13: +1.1 percent
Range: +0.7 to +2.0 percent
Factory orders fell 2.0 percent in January following a 1.3 percent gain in December and a 0.3 percent dip in November. But these numbers, at least for January and December, were sharply skewed by aircraft orders. Excluding transportation equipment, where commercial aircraft is tracked, factory orders actually rose in January, up 1.3 percent following a 0.1 percent dip in December and a 0.2 percent dip in November. More recently, aircraft led durables orders to soar in February—new factory orders for durables jumped a monthly 5.7 percent.
Factory orders Consensus Forecast for February 13: +2.9 percent
Range: -4.5 to +3.8 percent
ADP private payroll employment did not show improvement for private payrolls, at plus 198,000 in February versus an upwardly revised 215,000 in January. The BLS private payroll number for February posted at 246,000.
ADP private payrolls Consensus Forecast for March 13: 205,000
Range: 170,000 to 240,000
The composite index from the ISM non-manufacturing survey rose nearly one point in February to a higher-than-expected level of 56.0 which indicated a stronger pace of overall growth relative to what was already a strong rate in January. This index covers the bulk of the economy—services, construction, mining, and agriculture. Forward momentum is moderately good as the new orders index was up a very sharp 3.8 points to 58.2 with backlogs posting a 5.5 point jump to a very strong 55.0.
ISM non-manufacturing composite index Consensus Forecast for March 13: 56.0
Range: 54.0 to 56.5
Initial jobless claims rose 16,000 which was the sharpest increase of the year. And the 357,000 level was the highest since mid-February. But the 4-week average of 343,000 was still more than 10,000 below February's trend which is a positive signal for the labor market. Unlike initial claims, continuing claims came down in the latest week, 27,000 lower to a new recovery low of 3.050 million with the 4-week average 6,000 lower to 3.073 million which is also a recovery low.
Jobless Claims Consensus Forecast for 3/30/13: 350,000
Range: 339,000 to 365,000
Nonfarm payroll employment was much stronger than expected in February. They posted a gain of 236,000, following an increase of 119,000 in January and an increase of 219,000 in December. The unemployment rate declined to 7.7 percent from 7.9 percent in January. Private payrolls advanced 246,000 in February, following a boost of 140,000 in January. In the private sector, strength was seen in both goods-producing and service-providing sectors but led by the latter. Service-providing jobs increased 179,000 after a 99,000 rise in January. Goods-producing jobs jumped 67,000 after a 41,000 gain in January. Government jobs declined 10,000 in February, following a drop of 21,000 the month before. Earnings have been oscillating but upward. Average hourly earnings increased 0.2 percent in February, following a gain of 0.1 percent January. The average workweek edged up to 34.5 hours in February from 34.4 hours the month before.
Nonfarm payrolls Consensus Forecast for March 13: 193,000
Range: 170,000 to 230,000
Private payrolls Consensus Forecast for March 13: 200,000
Range: 175,000 to 240,000
Unemployment rate Consensus Forecast for March 13: 7.7 percent
Range: 7.6 to 7.8 percent
Average workweek Consensus Forecast for March 13: 34.5 hours
Range: 34.4 to 34.6 hours
Average hourly earnings Consensus Forecast for March 13: +0.2 percent
Range: +0.1 to +0.2 percent
The U.S. international trade gap in January widened to $44.4 billion from $38.1 billion in December. Exports declined 1.2 percent after gaining 2.2 percent in December. Imports rebounded 1.8 percent after a 2.6 percent drop the prior month. The worsening in the trade gap was primarily due to the petroleum deficit which moved to $24.3 billion from $18.6 billion in December. The nonpetroleum goods deficit grew a bit—to $37.0 billion in January from $36.8 the prior month. The services surplus slipped to $17.3 billion from $17.9 billion.
International trade balance Consensus Forecast for February 13: -$44.8 billion
Range: -$47.0 billion to -$41.2 billion
Consumer credit outstanding rose $16.2 billion in January. But the gains recently have been clumped on the non-revolving side, not the revolving side where credit cards are tracked and where growth is much slower with a only fractional gain in the latest report. In contrast, non-revolving credit jumped $16.0 billion and followed December's upwardly revised $18.3 billion jump which, outside a definitional break in the data in 2010, is the largest monthly increase in 11-1/2 years. Though vehicle sales have been contributing strongly to this component in recent months, January's gain reflected yet another surge in the student loan component, a surge not related to consumer spending.
Consumer credit Consensus Forecast for February 13: +$15.0 billion
Range: +$8.9 billion to +$17.0 billion
R. Mark Rogers is the author of The Complete Idiot’s Guide to Economic Indicators, Penguin Books.
Econoday Senior Writer Mark Pender contributed to this article.
|
