|
The U.S. economic recovery continued to make notable progress this past week. But concerns about Cyprus drowned out that news.
 Equities were flat to moderately down for the week due to concern about contagion and terms of a proposed bailout plan for Cyprus. Equities were flat to moderately down for the week due to concern about contagion and terms of a proposed bailout plan for Cyprus.
Equities declined Monday with the drop set off by a plan to tax bank accounts in Cyprus to help pay for the country's bailout. Cyprus had announced plans to tax bank depositors, a precondition for receiving a €10 billion bailout from the “troika”—the European Commission, European Central Bank and the International Monetary Fund. On Monday, Cyprus postponed a parliamentary debate on the plan to Tuesday and said its banks would remain closed until Thursday. The plan rekindled fears of an escalation in the Eurozone crisis.
 Tuesday, Cyprus’ parliament rejected the bailout plan. Stocks fell on the uncertainty surrounding how the parliament’s rejection would play out—that is, what would a substitute plan look like or would there even be a substitute plan. Stocks were down despite a favorable housing starts reports. At mid-week, equities rose on news from the Fed that it would continue with extremely loose monetary policy for quite some time. Tuesday, Cyprus’ parliament rejected the bailout plan. Stocks fell on the uncertainty surrounding how the parliament’s rejection would play out—that is, what would a substitute plan look like or would there even be a substitute plan. Stocks were down despite a favorable housing starts reports. At mid-week, equities rose on news from the Fed that it would continue with extremely loose monetary policy for quite some time.
The last two trading days it was on and off concern about Cyprus. Thursday saw favorable economic news on jobless claims, home prices, existing home sales, and Philly Fed. But all of that was overridden by Cyprus. Worries about Cypriot banks increased after the European Union gave Cyprus until Monday to raise the billions of euros it needs to get an international bailout. Cyprus announced plans on Thursday to overhaul the island’s banking industry, including forcing big depositors to accept losses on their accounts, as the European Central Bank threatened to withdraw crucial funding if the island’s government failed to agree on a bailout plan. Stocks rebounded Friday on optimism that officials in Cyprus will reach a deal over the weekend to rescue the country's troubled banks.
Equities were down this past week. The Dow was down fractionally but basically unchanged; the S&P 500, down 0.2 percent; the Nasdaq, down 0.1 percent; the Russell 2000, down 0.7 percent; and the Wilshire 5000, down 0.2 percent.
For the year-to-date, major indexes are up as follows: the Dow, up 10.7 percent; the S&P 500, up 9.2 percent; the Nasdaq, up 7.5 percent; the Russell 2000, up 11.4 percent; and the Wilshire 5000, up 9.8 percent.
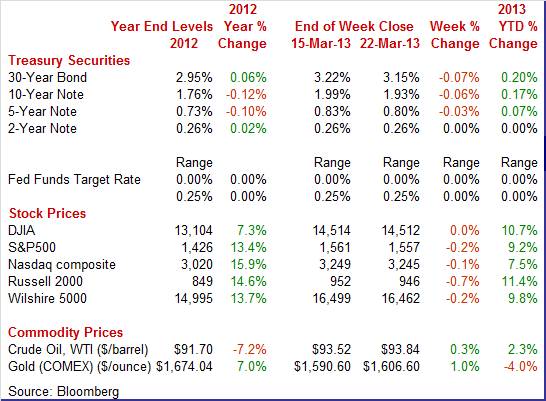
Weekly percent change column reflects percent changes for all components except interest rates. Interest rate changes are reflected in simple differences.
 Treasury rates declined moderately this past week. It was almost entirely about Cyprus. The biggest decline in yields was Tuesday on flight to safety after the Cypriot parliament voted down a bailout plan. Treasury rates declined moderately this past week. It was almost entirely about Cyprus. The biggest decline in yields was Tuesday on flight to safety after the Cypriot parliament voted down a bailout plan.
Rates did firm on Wednesday and the Fed was the reason. The Fed confirmed in its policy decision that it would maintain loose policy, including quantitative easing until unemployment comes down. Even though the Fed is buying Treasuries as part of QE4, bond traders saw the statement as reflecting policy that will continue to boost the economy.
Rates slipped on Thursday despite a plethora of good economic news in the U.S. Again, it was flight to safety over worries about the Cyprus banking situation.
For this past week Treasury rates were down as follows: 3-month T-bill, down 2 basis points; the 5-year note, down 3 basis points; the 7-year note, down 6 basis points; the 10-year note, down 6 basis points; and the 30-year bond, down 7 basis points. The 2-year note was unchanged.
 The spot price of crude was essentially unchanged this past week. West Texas Intermediate followed the same pattern as equities in reaction to developments in Cyprus and from the Fed. Crude dropped notably Tuesday, rebounded Wednesday, dipped Thursday, and again rebounded Friday on hopes of a solution for Cyprus. The spot price of crude was essentially unchanged this past week. West Texas Intermediate followed the same pattern as equities in reaction to developments in Cyprus and from the Fed. Crude dropped notably Tuesday, rebounded Wednesday, dipped Thursday, and again rebounded Friday on hopes of a solution for Cyprus.
Net for the week, the spot price for West Texas Intermediate edged up 32 cents per barrel to settle at $93.84.
It was a good week for economic indicators in the U.S. Plus, the Fed confirmed a continuation of easy monetary policy.
 At its latest policy meeting, the Fed emphasized that it is maintaining loose monetary policy for quite some time. This includes extremely low interest rates and continued quantitative easing. At its latest policy meeting, the Fed emphasized that it is maintaining loose monetary policy for quite some time. This includes extremely low interest rates and continued quantitative easing.
The Fed left policy rates unchanged with the fed funds target still at a range of zero to 0.25 percent. However, the vote was 11-1 to retain QE with Kansas City Fed President Esther George dissenting, stating concern about future inflation.
The Fed acknowledged improvement in portions of the economy but was concerned about fiscal drag. Basically, the Fed is saying that it is going to wait and see how the economy is progressing before making policy changes.
Guidance was mostly the same but somewhat expanded. Key numbers are 6.5 percent unemployment and 2.5 percent inflation expectations. Rates are expected to remain exceptionally low until this unemployment threshold is reached and as long as inflation expectations do not exceed this mark. But the Fed clarified that it is looking at a wide range of economic information—not just those two numbers.
The Fed does see the economy as having improved but worries about the negative impact of federal sequestration. And the economy—notably in terms of unemployment—is not yet where it needs to be. Overall, the Fed is on hold. Quantitative easing continues as earlier established. Earlier purchase programs for buying mortgage-backed securities and Treasuries continue.
The Fed is maintaining its existing policy of reinvesting principal payments from its holdings of agency debt and agency mortgage-backed securities in agency mortgage-backed securities and of rolling over maturing Treasury securities at auction. This will continue downward pressure on longer-term rates.
Fed policy remains extremely loose and policy is on hold. The Fed is waiting to see the impact of fiscal sequestration before changing guidance on easy policy. But the latest statement indicates that the Fed is watching current data to make future decisions. This is not new to the Fed but it may suggest that the Fed sees the recovery gaining traction.
 Housing starts made a partial comeback in February, but more importantly, housing permits made a sizeable gain. In February, housing starts rebounded 0.8 percent, following a drop of 7.3 percent the prior month. The February starts annualized level of 0.917 million units was up 27.7 percent on a year-ago basis. Housing starts made a partial comeback in February, but more importantly, housing permits made a sizeable gain. In February, housing starts rebounded 0.8 percent, following a drop of 7.3 percent the prior month. The February starts annualized level of 0.917 million units was up 27.7 percent on a year-ago basis.
The increase in starts was led by a monthly 1.4 percent increase in the multifamily component after a 19.2 percent decline in January. The single-family component rose 0.5 percent after dipping 0.3 percent in January.
 Permits continue on a moderate uptrend, rising 4.6 percent to an annual pace of 0.946 million units. Strength was seen in single-family and multifamily permits. Permits continue on a moderate uptrend, rising 4.6 percent to an annual pace of 0.946 million units. Strength was seen in single-family and multifamily permits.
Overall, housing starts are volatile during winter months due to weather and large seasonal factors. Nonetheless, starts are on a modest uptrend, fueled in part by shortage in supply and also slowly rising demand boosted by low mortgage rates. Permits, less affected by weather, are heading up and this is a positive for the economy. The housing numbers should not only nudge up construction employment but also consumer confidence.
 The latest report on existing home sales adds to the view that housing is improving. A curious plus in existing home sales data for February was a jump in supply. Also, sales improved. The latest report on existing home sales adds to the view that housing is improving. A curious plus in existing home sales data for February was a jump in supply. Also, sales improved.
Existing home sales rose 0.8 percent to an annualized pace of 4.98 million units. January was revised to up 0.8 percent from the initial estimate of 0.4 percent.
Low supply had been holding down sales but that appears to be changing as higher prices are bringing more homes into the market. Supply jumped 9.6 percent to 1.94 million units. Months’ supply rose to 4.7 months from 4.3 months in January.
Prices are rising as the median sales price gained 1.8 percent to $173,600. This followed a drop of 5.3 percent in January. On a year-ago basis, prices are up 11.6 percent. Prices for existing home sales are not on a repeat sales basis and are impacted by shifts in sales between high and low end.
Overall, the moderate upward trend for improvement in the housing sector continues. The gain in supply is especially positive, reflecting homeowners’ acknowledgement of rising prices. This also should be a boost for consumer confidence although there are cross currents on that issue.
 Home prices continue to be on the mend. The FHFA price index for January increased 0.6 percent, following a rise of 0.5 percent the prior month. The January gain was led by the Pacific region, increasing 1.6 percent. The weakest region was New England, down 0.7 percent for the month. Home prices continue to be on the mend. The FHFA price index for January increased 0.6 percent, following a rise of 0.5 percent the prior month. The January gain was led by the Pacific region, increasing 1.6 percent. The weakest region was New England, down 0.7 percent for the month.
The year-on-year rate for January came in at plus 6.5 percent versus 5.6 percent for the prior month.
Home prices are gradually improving although still below pre-recession peak levels.
 The Mid-Atlantic has been lagging other manufacturing regions but that changed somewhat in March. The general conditions index posted at plus 2.0, slightly over breakeven zero and indicating modest monthly growth. It was also well above February’s reading of minus 12.5. The Mid-Atlantic has been lagging other manufacturing regions but that changed somewhat in March. The general conditions index posted at plus 2.0, slightly over breakeven zero and indicating modest monthly growth. It was also well above February’s reading of minus 12.5.
New orders, at plus 0.5, showed improvement from February’s minus 7.8.
Shipments, at plus 3.5, and employment, at 2.7, are both showing slightly higher rates of growth. The overall six-month outlook is also positive, improving four tenths to a solidly optimistic level of 32.5. Price data show slightly easing pressures for inputs but continued softness for finished goods.
The strength in this report is not outstanding but, compared to prior months, suggests that the Mid-Atlantic region may finally be joining the nation's other regions in showing growth.
 The outlook for economic expansion is steady and respectable, at least before effects hit from the government sequester. The index of leading economic indicators was up 0.5 percent in February, the same rate of growth from an upwardly revised 0.5 percent in January. The outlook for economic expansion is steady and respectable, at least before effects hit from the government sequester. The index of leading economic indicators was up 0.5 percent in February, the same rate of growth from an upwardly revised 0.5 percent in January.
Strength was broad based with eight of 10 components showing monthly gains. Financial readings are strong positives including the report's leading credit component. Rising use of credit points to resilience for consumer spending and business spending. A special plus for February was a rise in building permits which points to strength for the housing sector. Also up was the factory workweek which indicates strength in manufacturing.
Other readings included a 0.2 percent gain for the coincident index which signals a modest rate of current growth.
The outlook for the economy may be picking up based on this report. However, cuts in government spending tied to the sequestration are an unknown risk. This uncertainty is one of the reasons the Fed is maintaining easy monetary policy.
The recovery continues to gain traction throughout key sectors. However, uncertainties remain—including the impact of sequestration and Europe. The Fed is keeping monetary policy loose but it is increasingly being debated how much marginal impact the Fed is having.
Manufacturing has shown signs of regaining strength—even in regional surveys. The durables orders report could add to that momentum. Existing home sales and FHFA home prices posted advances this past week. New home sales and Case-Shiller this week may boost confidence in the housing recovery. The impact of higher payroll taxes is still a concern and traders will be parsing the personal income report for any slippage in the consumer sector.
The Chicago Fed National Activity Index was below trend in January, falling into the minus column to minus 0.32 versus a revised plus 0.25 in December. Consumption & housing was January's largest negative factor followed by production. Employment was a plus for January but much less so than in December. The component for sales/orders/inventories was January's strength, moving from the minus side to the plus side.
Consensus numbers are not available for this release
The Dallas Fed general business activity index expanded in February but generally at a slower rate as the business activity index eased to 2.2 from 5.5 in January. Still, this was one of the more positive regional reports on manufacturing. The production index, a key measure of state manufacturing conditions, fell from 12.9 to 6.2, indicating that growth continued but at a slower pace. Other measures of current manufacturing activity also indicated slower growth in February. The new orders index was positive for the second month in a row, although it fell from 12.2 to 2.8.
Dallas Fed general business activity index Consensus Forecast for March 13: 3.4
Range: 2.0 to 7.0
Durable goods orders in January reversed back down 4.9 percent, following a spike of 3.6 percent in December. The transportation component was the key culprit behind the drop, which plunged 19.8 percent after a 9.9 percent gain in December. Excluding transportation, durables orders increased a healthy 2.3 percent in January after a 0.8 percent rise the month before. Apparently, the manufacturing sector cannot wait for the government to decide on how to resolve fiscal issues. Numbers reflect revisions from the more recent total factory orders report. Total orders should get some lift from transportation as Boeing reported a boost in orders.
New orders for durable goods Consensus Forecast for February 13: + 3.5 percent
Range: +0.3 percent to +6.0 percent
New orders for durable goods, ex-trans., Consensus Forecast for February 13: +0.7 percent
Range: -2.2 percent to +4.0 percent
The S&P/Case-Shiller 20-city home price index (SA) was up a very strong 0.9 percent for December's 20-city. This rate was the best since last year's second quarter when monthly gains averaged a recovery best 1.0 percent. The adjusted year-on-year rate for December was plus 6.9 percent which is the highest since the giant housing bubble back in 2006. Given last week’s gain in FHFA home prices of 0.6 percent, Case-Shiller is likely to post a notable gain also.
The S&P/Case-Shiller 20-city HPI (SA, m/m) Consensus Forecast for January 13: +1.0 percent
Range: +0.6 to +1.3 percent
The S&P/Case-Shiller 20-city HPI (NSA, m/m) Consensus Forecast for January 13: +0.1 percent
Range: 0.0 to +0.3 percent
The S&P/Case-Shiller 20-city HPI (NSA, y/y) Consensus Forecast for January 13: +8.2 percent
Range: +7.1 to +8.9 percent
New home sales in January surged a monthly 15.6 percent to an annualized 437 thousand from an upwardly revised 378 thousand for December. The median sales price unexpectedly dropped to $226,400 from $249,800 in December. But the data do not reflect repeat transactions. New home sales may track last week’s gain in existing home sales for February. A key number will be months’ supply which may indicate how homebuilders really feel about the housing market. Supply for existing homes jumped sharply in last week’s numbers.
New home sales Consensus Forecast for February 13: 425 thousand-unit annual rate
Range: 397 thousand to 450 thousand-unit annual rate
The Richmond Fed manufacturing index for February posted at 6 to show monthly growth from January which was a very weak month in the region. Shipments were up strongly along with capacity utilization and, very importantly, employment. Negatives were no change for new orders and another contraction for backlogs.
Richmond Fed manufacturing index Consensus Forecast for March 13: 5.5
Range: 3.0 to 6.0
The pending home sales index for January jumped 4.5 percent in January. At the time, available homes on the market were scarce and sales were increasingly draining what inventory there was, shifting the balance in the favor of sellers. But lack of supply is good for prices where growth is at a seven-year high. February existing homes sales were up and supply was making a comeback.
Pending home sales Consensus Forecast for February 13: -0.7 percent
Range: -2.0 to +4.0 percent
GDP for the fourth quarter was revised up to an annualized rate of plus 0.1 percent from the initial estimate of minus 0.1 percent and compared to a third quarter gain of 3.1 percent. As expected, net exports were less negative. However, inventory growth was revised down notably. Government purchases also were bumped down. Final sales of domestic product were revised up, to 1.7 percent from the advance estimate of 1.1 percent. Final sales to domestic purchasers posted at 1.4 percent versus the initial estimate of 1.4 percent. Headline inflation for the GDP price index showed a 0.9 percent annualized inflation rate versus the initial estimate of 0.6 percent and 2.7 percent in the third quarter. When excluding food and energy, inflation was revised to 1.2 percent, compared to the advance estimate of 1.1 percent and 1.3 percent in the third quarter.
Real GDP Consensus Forecast for third estimate Q4 12: +0.6 percent annual rate
Range: +0.1 to +0.8 percent annual rate
GDP price index Consensus Forecast for a third estimate Q4 12: +0.9 percent annual rate
Range: +0.9 to +0.9 percent annual rate
Initial jobless claims continue to signal improvement in the labor market. Initial claims did inch 2,000 higher in the March 16 week to 336,000, but the four-week average was down 7,500 to 339,750 for a new recovery low. A comparison of the March 16 week with the February 16 week, which matched the sampling weeks of the government's monthly employment report, shows a big 30,000 decline. Continuing claims are also pointing to improvement. Though edging 5,000 higher in data for the March 9 week to 3.053 million, the four-week average was at a new recovery low of 3.076 million for a 28,000 decline from the prior week.
Jobless Claims Consensus Forecast for 3/23/13: 340,000
Range: 330,000 to 345,000
The Chicago PMI for February posted at 56.8, over 50 to indicate monthly growth and 1.2 points over January to indicate an accelerating rate of growth. New orders led the highlights, above 60 at 60.2 for a two point gain from an already very strong 58.2 in January.
Chicago PMI Consensus Forecast for March 13: 56.1
Range: 55.0 to 57.9
The Kansas City Fed manufacturing index was minus 10 in February, down from minus 2 in January and minus 1 in December. The production index decreased from minus 3 to minus 11, and the shipments, new orders, and order backlog indexes also declined to their lowest levels since early 2009. In contrast, the employment index improved from minus 8 to plus 2, and the new orders for exports index climbed towards positive territory.
Kansas City Fed manufacturing index Consensus Forecast for March 13: -3
Range: -4 to 0
Good Friday. U.S. banks open. Equity markets closed.
Personal income fell as expected in January due to fiscal cliff effects. Personal income dropped a monthly 3.6 percent, following a 2.6 percent surge in December. December was boosted by attempts to avoid January income and payroll tax increases. The wages & salaries component declined 0.6 percent in January after a 0.7 percent jump the month before. Personal spending rose 0.2 percent, following a 0.1 percent rise in December. Turning to inflation, the headline PCE price index was flat in January, matching the pace the month before. The core rate in January edged up 0.1 percent, following no change in December. Looking ahead, aggregate weekly earnings jumped 0.6 percent in February, pointing to a healthy gain in the private wages & salaries component in personal income. Expect high headline PCE inflation but more moderate core. The consumer price index for February jumped 0.7 percent, following no change in January. The core CPI—excluding food and energy—softened to a 0.2 percent rise after increasing a strong 0.3 percent in January.
Personal income Consensus Forecast for February 13: +0.9 percent
Range: +0.4 to +1.5 percent
Personal consumption expenditures Consensus Forecast for February 13: +0.6 percent
Range: +0.4 to +0.8 percent
PCE price index Consensus Forecast for February 13: +0.5 percent
Range: +0.4 to +0.5 percent
Core PCE price index Consensus Forecast for February 13: +0.2 percent
Range: 0.0 to +0.2 percent
The Reuter's/University of Michigan's consumer sentiment index took a surprise plunge in early March, to 71.8 versus a roughly 79 pace during the last two weeks of February. Weakness was in the expectations component which fell 8.5 points to 61.7 which was the lowest reading since the fiscal impasse and US ratings cut in the third quarter of 2011.
Consumer sentiment Consensus Forecast for final March 13: 72.5
Range: 71.7 to 78.5
R. Mark Rogers is the author of The Complete Idiot’s Guide to Economic Indicators, Penguin Books.
Econoday Senior Writer Mark Pender contributed to this article.
|
