|
Two important sectors showed surprising improvement. The consumer and manufacturing sectors gained with healthy numbers in February for retail sales and industrial production.
 The Dow had quite a run with a 10-day rally through Thursday but ended on the Ides of March (Friday, the 15th). Fundamentals remain positive. And the Fed is sticking with its position of easy policy until unemployment drops to 6.5 percent. The Dow had quite a run with a 10-day rally through Thursday but ended on the Ides of March (Friday, the 15th). Fundamentals remain positive. And the Fed is sticking with its position of easy policy until unemployment drops to 6.5 percent.
With little economic news the first two days of trading, stocks oscillated on corporate news, with most indexes up moderately Monday and down moderately Tuesday, although the Dow continued up both days.
 On Wednesday, equities gained on unexpectedly strong retail sales. Thursday, stocks were boosted by a drop in initial jobless claims. The Dow hit another record high while the S&P 500 approached a record high. On Wednesday, equities gained on unexpectedly strong retail sales. Thursday, stocks were boosted by a drop in initial jobless claims. The Dow hit another record high while the S&P 500 approached a record high.
The winning streak for the Dow ended Friday as a dip in consumer sentiment more than offset a jump in industrial production. Also, profit taking and quadruple witching came into play. But Friday’s “retreat” was modest as investors continue to see Fed easing as a plus for equities.
Equities were up this past week. The Dow was up 0.8 percent; the S&P 500, up 0.6 percent; the Nasdaq, up 0.1 percent; the Russell 2000, up 1.1 percent; and the Wilshire 5000, up 0.6 percent.
For the year-to-date, major indexes are up as follows: the Dow, up 10.8 percent; the S&P 500, up 9.4 percent; the Nasdaq, up 7.6 percent; the Russell 2000, up 12.1 percent; and the Wilshire 5000, up 10.0 percent.
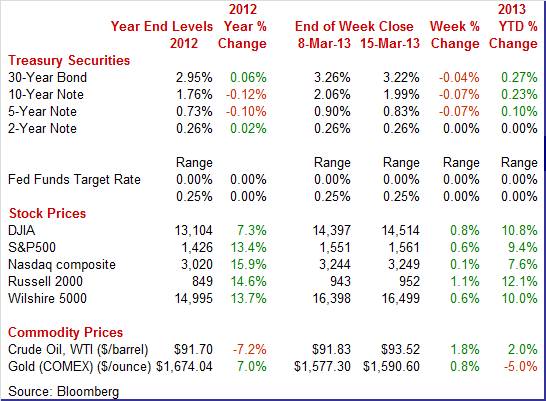
Weekly percent change column reflects percent changes for all components except interest rates. Interest rate changes are reflected in simple differences.
 Despite mostly stronger news on the economy, Treasury rates eased moderately for the week. The only notable daily swings in yields were on Tuesday and Friday. Despite mostly stronger news on the economy, Treasury rates eased moderately for the week. The only notable daily swings in yields were on Tuesday and Friday.
Rates dipped Tuesday on results of a favorable auction of 3-year Treasury notes. Investors were showing some nervousness about the impact of sequestration. Yields slipped Friday on a decline in consumer sentiment even as industrial production was stronger than expected.
 For this past week Treasury rates were down as follows: 3-month T-bill, down 1 basis point; the 5-year note, down 7 basis points; the 7-year note, down 8 basis points; the 10-year note, down 7 basis points; and the 30-year bond, down 4 basis points. The 2-year note was unchanged. For this past week Treasury rates were down as follows: 3-month T-bill, down 1 basis point; the 5-year note, down 7 basis points; the 7-year note, down 8 basis points; the 10-year note, down 7 basis points; and the 30-year bond, down 4 basis points. The 2-year note was unchanged.
Longer maturity rates are firming on improved economic news and on concerns about the Fed unwinding easy policy at some point. Near-term rates remain held down by the Fed’s extraordinarily low policy rates.
 The spot price of crude rose modestly this past week, regaining some lost ground from late February and early March. The spot price of crude rose modestly this past week, regaining some lost ground from late February and early March.
Key daily moves were Tuesday and Thursday, but still were very modest. WTI spot rose under a dollar a barrel on Tuesday on a report of a drop in U.S. inventories from the American Petroleum Institute. Crude was boosted Thursday on a drop in initial jobless claims.
Net for the week, the spot price for West Texas Intermediate rebounded $1.69 per barrel to settle at $93.52.
Most economic news was unexpectedly positive and indicated that the recovery may be gaining momentum.
 Retail sales in February were strong despite payroll tax increases and delayed income tax returns. This report points to a stronger-than-expected consumer sector and improving recovery. Retail sales in February were strong despite payroll tax increases and delayed income tax returns. This report points to a stronger-than-expected consumer sector and improving recovery.
As expected, lift came from gasoline prices and auto sales but there also was strength elsewhere. Retail sales jumped 1.1 percent, following a rise of 0.2 percent in January. Expectations were for a 0.5 percent rise.
Motor vehicle sales rebounded a sizeable 1.1 percent, following a 0.3 percent dip in January. Ex-auto sales in February increased 1.0 percent, following boost of 0.4 percent the month before. The consensus projected a 0.6 percent increase in February. Gasoline sales were up significantly.
On higher prices, gasoline sales spiked a monthly 5.0 percent in February, following a 0.7 percent increase the prior month. Gasoline sales were up significantly. Excluding both autos and gasoline components, sales gained 0.4 percent after increasing 0.3 percent in January (originally up 0.2 percent). Market expectations were for a 0.3 percent rise.
Core subcomponent strength was widely scattered with increases seen in building materials & garden equipment, food & beverage stores, clothing & apparel, general merchandise, miscellaneous store retailers, and nonstore retailers.
 Weakness was in furniture & furnishings, electronics & appliances; sporting goods, hobby, book & music stores; and food services & drinking places. Weakness was in furniture & furnishings, electronics & appliances; sporting goods, hobby, book & music stores; and food services & drinking places.
The consumer sector is looking a little stronger than earlier believed. Apparently, job growth is offsetting payroll tax increases at the aggregate level. Specifically, individuals are likely cutting back on spending a little (remember, consumption patterns change slowly even when disposable income changes) but aggregate gains in employment are outpacing individual losses. The February strength and mild upward revisions to January will have some economists nudging up forecasts for first quarter GDP.
 Fast forward back—yes, that is an unusual reminder. But a key economic issue is that fourth quarter GDP was held back in part by a sharp slowing in inventory build. Businesses were concerned about fiscal cliff issues. Now, businesses appear to have decided that demand is decent and fiscal cliff issues have to be ignored—although they have been only partially resolved. Now, businesses are rebuilding inventories to offset weakness in the fourth quarter and to meet expected moderate demand which has been confirmed by the latest retail sales numbers. Fast forward back—yes, that is an unusual reminder. But a key economic issue is that fourth quarter GDP was held back in part by a sharp slowing in inventory build. Businesses were concerned about fiscal cliff issues. Now, businesses appear to have decided that demand is decent and fiscal cliff issues have to be ignored—although they have been only partially resolved. Now, businesses are rebuilding inventories to offset weakness in the fourth quarter and to meet expected moderate demand which has been confirmed by the latest retail sales numbers.
A surprisingly heavy build in retail vehicles was a major factor behind a 1.0 percent rise in business inventories in January. A 1.9 percent increase in retail autos & parts was the strongest build in six months and reflected strong demand for autos. Note that autos are also building in the wholesale sector and are being drawn heavily, not surprisingly, out of the factory sector.
Overall, inventory build is roughly in line with demand and likely will add to first quarter GDP growth. Inventories to sales are up a bit but still relatively low.
 Readings on the consumer mood recently have been oscillating—and have been different, depending on the source. Readings on the consumer mood recently have been oscillating—and have been different, depending on the source.
According to Reuters/University of Michigan, consumer sentiment took a surprise plunge in early March, to 71.8 versus a roughly 79 pace during the last two weeks of February. Weakness was in the expectations component which fell 8.5 points to 61.7 which was the lowest reading since the fiscal impasse and US ratings cut in the third quarter of 2011.
Weakness behind sentiment could be the impasse over fiscal policy, recently high gasoline prices, and higher payroll taxes.
 But not all surveys tell the same story. Bloomberg’s consumer comfort index improved in early March and Gallup’s measure of economic confidence rose in early March. “Money” says consumers are feeling a little better about the economy if one looks at retail sales. But not all surveys tell the same story. Bloomberg’s consumer comfort index improved in early March and Gallup’s measure of economic confidence rose in early March. “Money” says consumers are feeling a little better about the economy if one looks at retail sales.
It bears repeating that it is going to take more than one month to see the trend—especially for the impact of payroll taxes on the consumer. But aggregate effects (job gains) may be outweighing negative effects on individuals (payroll taxes). It also bears watching what consumers think about sequestration. While economists may think in terms of dollar impact from program cuts, households may think more in terms of government direction—positive or negative. We are in uncharted territory on this.
 There are more signs of better-than-expected growth in the first quarter. Manufacturing in February improved sharply. Overall industrial production jumped 0.7 percent in February after no change in January. There are more signs of better-than-expected growth in the first quarter. Manufacturing in February improved sharply. Overall industrial production jumped 0.7 percent in February after no change in January.
The manufacturing component rebounded 0.8 percent, following a 0.3 percent drop in January. The rate of motor assemblies remained strong and rose 3.6 percent after a 4.9 percent drop in January. Other industries generally showed healthy gains. Excluding motor vehicles, manufacturing gained 0.6 percent in February after a 0.1 percent increase the prior month.
The output of utilities increased 1.6 percent in February while production at mines dipped 0.3 percent.
Capacity utilization for total industry advanced to 79.6 percent from 79.2 percent in January. Expectations were for 79.4 percent.
Manufacturing may be making a comeback after a soft January. The latest production numbers will likely nudge up estimates for first quarter GDP. The report also will boost debate next week within the Fed on when to unwind easy monetary policy.
 The first look at the manufacturing sector in March was mostly positive. The Empire State index, at 9.24, was well above zero to indicate monthly growth in the New York manufacturing sector but growth, however, that's slightly slower than February's 10.04. The first look at the manufacturing sector in March was mostly positive. The Empire State index, at 9.24, was well above zero to indicate monthly growth in the New York manufacturing sector but growth, however, that's slightly slower than February's 10.04.
The rate of monthly growth in new orders, however, slowed with a reading of 8.18 versus 13.31 in January. Unfilled orders continued to contract, though only slightly at minus 2.15. Shipments, at 7.76, were more than four points slower than last month while employment, at an un-resounding 3.23, was nearly five points slower.
 Higher energy costs boosted headline CPI inflation in February but the core rate was somewhat moderate. The consumer price index for February jumped 0.7 percent, following no change in January. The core CPI—excluding food and energy—softened to a 0.2 percent rise after increasing a strong 0.3 percent in January. Higher energy costs boosted headline CPI inflation in February but the core rate was somewhat moderate. The consumer price index for February jumped 0.7 percent, following no change in January. The core CPI—excluding food and energy—softened to a 0.2 percent rise after increasing a strong 0.3 percent in January.
By major components outside the core, energy jumped a monthly 5.4 percent after a decline of 1.7 percent in January. Gasoline surged a monthly 9.1 percent after falling 3.0 percent in January.
 For the core measure, the indexes for shelter, used cars and trucks, recreation, and medical care all rose in February. These increases more than offset declines in the indexes for new vehicles, apparel, airline fares, and tobacco. For the core measure, the indexes for shelter, used cars and trucks, recreation, and medical care all rose in February. These increases more than offset declines in the indexes for new vehicles, apparel, airline fares, and tobacco.
Year-on-year, overall CPI inflation increased to 2.0 percent in February from 1.6 percent in January (seasonally adjusted). The core rate came in at 2.0 percent, compared to 1.9 percent in January. On an unadjusted year-ago basis, the headline CPI in February on a year-ago basis was up 2.0 percent and the core was up 2.0 percent.
The headline CPI rate mainly was boosted by energy costs which since have eased in March. The core rate, however, is at the Fed’s target rate of 2 percent but below the policy trigger rate of 2.5 percent. This likely will heat up the debate within the Fed on timing of unwinding easy policy. But for now, the doves—focusing on unemployment—will carry the vote. But expect debate to increase.
 Energy inflation was back in February, boosting the headline rate for the PPI. The core, however, remained moderate. The February producer price index increased a strong 0.7 percent, following a rebound of 0.2 percent in January. The core rate, which excludes both food and energy, rose 0.2 percent—matching the prior month’s pace. Energy inflation was back in February, boosting the headline rate for the PPI. The core, however, remained moderate. The February producer price index increased a strong 0.7 percent, following a rebound of 0.2 percent in January. The core rate, which excludes both food and energy, rose 0.2 percent—matching the prior month’s pace.
 Food prices declined 0.5 percent after jumping 0.7 percent in January. Energy costs in February accelerated to a 3.0 percent boost, following a 0.4 percent decline the prior month. Gasoline spiked 7.2 percent, following a monthly decrease of 2.1 percent in January. Food prices declined 0.5 percent after jumping 0.7 percent in January. Energy costs in February accelerated to a 3.0 percent boost, following a 0.4 percent decline the prior month. Gasoline spiked 7.2 percent, following a monthly decrease of 2.1 percent in January.
Within the core, about 20 percent of the February increase can be traced to prices for pharmaceutical preparations, which moved up 0.2 percent. An advance in the index for plastic products also contributed to higher prices for finished goods less foods and energy. Passenger car prices gained 0.3 percent while light trucks rose 0.1 percent.
For the overall PPI, the year-ago rate in February posted at 1.8 percent, compared to 1.4 percent in January (seasonally adjusted). The core rate was up 1.7 percent versus 1.8 percent in January. On a not seasonally adjusted basis for February, the year-ago headline PPI was up 1.7 percent, while the core was up 1.7 percent.
Overall, the economy is showing notable signs of improvement. However, inflation also is up although mainly due to February’s jump in gasoline costs. Core inflation is rising, however. Probably the key points from this past week are that the recovery is gaining traction and that debate is going to pick up within the Fed on the timing of when to unwind easy monetary policy. It is too soon for the Fed to act but not too soon to raise the level of debate. It is, however, too soon to debate anything other than very gradual moves as sequestration will be seen as a drag on the economy.
On Wednesday, Fed Chairman Ben Bernanke conducts his quarterly press conference following the FOMC statement and Fed forecasts. Otherwise, the focus is housing. This sector has shown moderate strengthening. Updates are posted on NAHB, housing starts, FHFA home prices, and existing home sales.
NAHB housing market index for February was down one point to 46, now four points short of the 50 mark and indicating that more builders still describe conditions as bad than good. The National Association of Home Builders attributed the weakness to uncertainty over the nation's jobs market as well as a shortage of available lots which is limiting new supply. The NAHB continues to cite stringent credit standards as another factor limiting the market.
The report's traffic component was far below 50, at 32 for a four point decline in the month. Weak traffic points to weak sales in the months ahead, but for right now the report's two sales components remained steady with present sales at 51 and with sales six months out at 50.
NAHB housing market index Consensus Forecast for March 13: 47
Range: 46 to 49
Housing starts in January declined 8.5 percent, following a sharp rebound of 15.7 percent in December. The January starts pace of 0.890 million units was up 23.6 percent on a year-ago basis. The decrease in starts was led by a monthly 24.1 percent drop in the multifamily component after a 34.7 percent spike in December. Housing permits advanced 1.8 percent to an annual pace of 0.925 million units. Notably, single-family permits have not dipped on a month-ago basis since March 2012 and are now at their highest level since June 2008.
Housing starts Consensus Forecast for February 13: 0.919 million-unit rate
Range: 0.872 million to 0.970 million-unit rate
Housing permits Consensus Forecast for February 13: 0.925 million-unit rate
Range: 0.910 million to 0.950 million-unit rate
The FOMC announcement at 2:00 p.m. ET (revised release time) for the March 19-20 FOMC policy meeting is expected to leave policy rates unchanged. Also, the Fed will release its quarterly forecast at the same time as the statement.
FOMC Consensus Forecast for 3/20/12 policy vote on fed funds target range: unchanged at a range zero to 0.25 percent
Chairman press conference after the FOMC meeting statement is scheduled for 2:30 p.m. ET. Fed Chairman Ben Bernanke conducts a press conference after FOMC meetings in which participants present their quarterly economic forecasts. Bernanke is expected to comment on the forecast and take Q&A.
Initial jobless claims fell 10,000 in the March 9 week to 332,000. The week's total was the second lowest of the recovery. There were no special factors skewing the report. The four-week average is now at its lowest level of the recovery, down 2,750 from the prior week to a 346,750 level that is a bit below the 350,000 trend of the month-ago comparison in what is an early positive indication for the March employment report. Continuing claims are also moving lower, down 89,000 in data for the March 2 week to 3.024 million which is another recovery low as is the 4-week average at 3.098 million.
Jobless Claims Consensus Forecast for 3/16/13: 340,000
Range: 325,000 to 352,000
The Markit PMI manufacturing index (final) slowed a bit the last half of February to 54.3 from the mid-month flash reading of 55.2. The final reading versus the flash reading points to a PMI in the low 53 area during the last two weeks. The comparison with the final January reading is 55.8 which is a brisker pace of monthly growth. Slower growth in orders was the standout detail with new orders down one full point from the flash reading to 55.4 which however is still a very respectable rate of monthly growth.
Markit PMI manufacturing flash index Consensus Forecast for March 13: 55.0
Range: 54.0 to 56.0
The FHFA purchase only house price index for December gained 0.6 percent, following a rise of 0.4 percent the prior month. The December advance was led by the East South Central region, increasing 2.3 percent, with the Middle Atlantic region down 0.1 percent. The year-on-year rate posted at plus 5.8 percent versus 5.4 percent in November.
FHFA purchase only house price index Consensus Forecast for January 13: +0.7 percent
Range: +0.5 to +1.2 percent
Existing home sales in January gained 0.4 percent to an annual rate of 4.92 million. December's rate was revised slightly lower to 4.90 million. Sales are being held back by limited supply of homes on the market—which is a negative now but a positive looking forward. Supply on the market for January was at 4.2 months which was down sharply from 4.5 and 4.8 months in the two prior months and was the lowest rate since the bubble days of 2005. The actual number of homes on the market, at 1.74 million, was the lowest in 14 years.
Existing home sales Consensus Forecast for February 13: 5.01 million-unit rate
Range: 4.85 to 5.15 million-unit rate
The general business conditions index of the Philadelphia Fed's Business Outlook Survey, going against the national trend for February, fell to minus 12.5 from minus 5.8 in January. Forward momentum remains in contraction mode as the new orders index declined from a reading of minus 4.3 in January to minus 7.8 in February.
Philadelphia Fed survey Consensus Forecast for March 13: -1.5
Range: -5.0 to 8.5
The Conference Board's index of leading indicators was up 0.2 percent in January, down from a 0.5 percent rise in December but up from no change in November. Interest rate and credit components were strong pluses for the outlook as was the rally in the stock market. Two very important components were also on the plus side, unemployment claims and building permits with the former pointing to strength in the jobs market and the latter to strength in housing. A negative was consumer expectations which appeared to be depressed by higher payroll taxes, uncertainty over future income, and higher gasoline prices. The coincident index in January rose a solid 0.4 percent, which points to a respectable rate of current growth.
Leading indicators Consensus Forecast for February 13: +0.4 percent
Range: 0.0 to +0.8 percent
R. Mark Rogers is the author of The Complete Idiot’s Guide to Economic Indicators, Penguin Books.
Econoday Senior Writer Mark Pender contributed to this article.
|
