|
We still cannot find a boring week. Sequestration kicks in Friday night, March 1. But the economy is still improving slowly. And the Fed seems to be choosing to take actions to keep the recovery in motion despite fiscal debt impasse. For now—emphasis on for now—the Fed’s loose monetary policy is overriding concern about pending tighter fiscal policy from sequestration.
 Most major equity indexes ended the week up despite the pending sequestration deadline of March 1. However, sequestration impact will lag as key potential effects require notice—such as for pending furloughs for certain civilian federal employees. And there is some probability of compromise on sequestration after furlough notices are sent out along with other notices of spending cuts. Most major equity indexes ended the week up despite the pending sequestration deadline of March 1. However, sequestration impact will lag as key potential effects require notice—such as for pending furloughs for certain civilian federal employees. And there is some probability of compromise on sequestration after furlough notices are sent out along with other notices of spending cuts.
 But for the week, the biggest move was on Monday. This was due to worries about partial election results in Italy pointing a hung parliament with no elected leader. Testimony from Fed Chairman Ben Bernanke defended the Fed's bond buying stimulus before Congress while better than expected economic data soothed growth worries. Notably, home prices were up in FHFA and Case-Shiller reports. But for the week, the biggest move was on Monday. This was due to worries about partial election results in Italy pointing a hung parliament with no elected leader. Testimony from Fed Chairman Ben Bernanke defended the Fed's bond buying stimulus before Congress while better than expected economic data soothed growth worries. Notably, home prices were up in FHFA and Case-Shiller reports.
The biggest gain of the week was Wednesday as worries about Europe faded and Bernanke’s second day of testimony emphasized the Fed’s intention of keeping monetary policy loose until unemployment drops notably. Also, pending home sales spiked and durables orders excluding transportation gained. Equities were little changed Thursday. There were modest gains Friday on a rise in consumer sentiment.
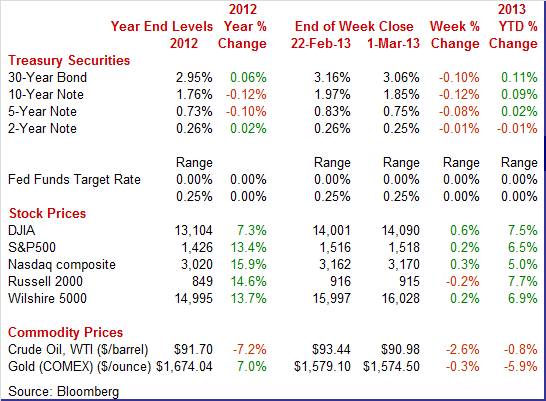
Equities mostly were up this past week. The Dow was up 0.6 percent; the S&P 500, up 0.2 percent; the Nasdaq, up 0.3 percent; percent; and the Wilshire 5000, up 0.2 percent. The Russell 2000 was down 0.2 percent.
Equities were up for February. The Dow was up 1.4 percent; the S&P 500, up 1.1 percent; the Nasdaq, up 0.6 percent; the Russell 2000, up 1.0 percent; and the Wilshire 5000, up 1.1 percent.
For the year-to-date, major indexes are up as follows: the Dow, up 7.5 percent; the S&P 500, up 6.5 percent; the Nasdaq, up 5.0 percent; the Russell 2000, up 7.7 percent; and the Wilshire 5000, up 6.9 percent.
Weekly percent change column reflects percent changes for all components except interest rates. Interest rate changes are reflected in simple differences.
 Treasury yields eased somewhat this past week. It was almost entirely due to a drop in rates on Monday on news of Italian elections leaving the Italian parliament with divided results—no majority party. After little change the next three day, rates nudged down on modest flight to safety on concern about sequestration. Treasury yields eased somewhat this past week. It was almost entirely due to a drop in rates on Monday on news of Italian elections leaving the Italian parliament with divided results—no majority party. After little change the next three day, rates nudged down on modest flight to safety on concern about sequestration.
For this past week Treasury rates were down as follows: 3-month T-bill, down 2 basis points; the 2-year note, down 1 basis point; the 5-year note, down 8 basis points; the 7-year note, down 10 basis points; the 10-year note, down 12 basis points; and the 30-year bond, down 10 basis points.
 Crude prices continued a moderate retreat this past week. Monday saw West Texas Intermediate spot decline almost a dollar a barrel on Italian election results that indicated that the Eurozone debt crisis could worsen. After very slim gains on Tuesday and Wednesday, WTI decreased Thursday on a below-than-expected GDP number for the U.S. and on a drop in the euro against the dollar. Oil fell Friday on news of further contraction in manufacturing in Europe and on less-than-expected growth in manufacturing in China. Crude prices continued a moderate retreat this past week. Monday saw West Texas Intermediate spot decline almost a dollar a barrel on Italian election results that indicated that the Eurozone debt crisis could worsen. After very slim gains on Tuesday and Wednesday, WTI decreased Thursday on a below-than-expected GDP number for the U.S. and on a drop in the euro against the dollar. Oil fell Friday on news of further contraction in manufacturing in Europe and on less-than-expected growth in manufacturing in China.
Net for the week, the spot price for West Texas Intermediate dropped $2.46 per barrel to settle at $90.98.
Economic news was mixed but mostly positive—especially for housing. Fed Chairman Bernanke’s testimony before Congress helped to lift equities and sooth markets in general.
Fed Chairman Ben Bernanke delivered his two days semi-annual testimony before the Senate Banking Committee and then the House of Representative’s Financial Services Committee. He indicated that the benefits of quantitative easing outweigh the risks. Being more forceful than usual, he stated that the impact of sequester could be significant, taking into account that economic growth is only moderate. Adding to his view that monetary policy is going to remain loose for a while, Bernanke noted that the jobs market remains weak while inflation is likely to stay at or below the Fed’s target rate of 2 percent. He noted that the fourth quarter pause in GDP does not represent a stalling in the recovery but rather weather effects for the most part. Regarding quantitative easing going forward, Bernanke indicated that the Fed likely will unwind slowly in the near term but more substantially in the longer run.
He reaffirmed that policy guidance will focus on unemployment and inflation. He sees that the new guidance gives markets clearer signals on monetary policy. He expects that quantitative easing will continue until there is substantial improvement in the labor market. He noted that quantitative easing has specifically helped boost the housing market and motor vehicle sales. He sees inflation expectations to be well anchored. Regarding the Fed’s impact on the federal deficit, Bernanke indicated that remittances to the Treasury could decline but said that long term reductions in the federal deficit from a budget perspective would dwarf the impact of Fed remittances.
Bernanke noted that according to a Congressional Budget Office study, economic growth would be reduced this year by 1-1/2 percent by sequestration. He sees differences between short run and long run issues on fiscal issues. The Fed chairman would prefer that fiscal solutions not be front loaded but that long-term issues be addressed.
 Real GDP growth for the fourth quarter was revised up to an annualized rate of plus 0.1 percent from the initial estimate of minus 0.1 percent and compared to a third quarter gain of 3.1 percent. As expected, net exports were less negative. However, inventory growth was revised down notably. Government purchases also were bumped down. Real GDP growth for the fourth quarter was revised up to an annualized rate of plus 0.1 percent from the initial estimate of minus 0.1 percent and compared to a third quarter gain of 3.1 percent. As expected, net exports were less negative. However, inventory growth was revised down notably. Government purchases also were bumped down.
 Final sales of domestic product were revised up, to 1.7 percent from the advance estimate of 1.1 percent. Final sales to domestic purchasers posted at 1.4 percent versus the initial estimate of 1.4 percent. Final sales of domestic product were revised up, to 1.7 percent from the advance estimate of 1.1 percent. Final sales to domestic purchasers posted at 1.4 percent versus the initial estimate of 1.4 percent.
Headline inflation for the GDP price index showed a 0.9 percent annualized inflation rate versus the initial estimate of 0.6 percent and 2.7 percent in the third quarter. When excluding food and energy, inflation was revised to 1.2 percent, compared to the advance estimate of 1.1 percent and 1.3 percent in the third quarter.
Two key points stand out from the GDP numbers. First, inventory investment was held back—and even more than originally believed. This may have been due to hesitation by businesses about fiscal cliff issues. Odds are that there will be inventory rebuild in the first half, adding to growth. Second, inflation is low—allowing the Fed to keep a loose monetary policy. While the fourth quarter numbers were disappointing, forward momentum appears to have improved.
 Personal income fell as expected in January due to fiscal cliff effects but fell more than expected. However, spending held up. Personal income fell as expected in January due to fiscal cliff effects but fell more than expected. However, spending held up.
Personal income dropped a monthly 3.6 percent, following a 2.6 percent surge in December. December was boosted by attempts to avoid January income and payroll tax increases. Market expectations were for a 2.1 percent drop in income. The wages & salaries component declined 0.6 percent in January after a 0.7 percent jump the month before. Weakness in January income was led by a monthly 34.8 percent plunge in dividend income after a 32.8 percent spike in December. This reflected fiscal cliff effects.
Personal spending rose 0.2 percent, following a 0.1 percent rise in December. Strength was in the services component. Analysts expected a 0.2 percent gain.
 Turning to inflation, the headline PCE price index was flat in January, matching the pace the month before. The core rate in January edged up 0.1 percent, following no change in December. Turning to inflation, the headline PCE price index was flat in January, matching the pace the month before. The core rate in January edged up 0.1 percent, following no change in December.
Year-on-year, headline prices were up 1.2 percent in January versus 1.4 percent in December. The core was up 1.3 percent, following 1.4 percent the month before.
Overall, it is still early to evaluate the effects of higher income and payroll taxes. Spending remains moderately positive but that is still a question mark, given the higher taxes.
On the inflation front, the Fed still has flexibility on monetary policy as rates remain below target.
 Motor vehicle sales have been very strong the last four months, above a 15 million annual unit rate compared to low 14 million rates through much of last year. The February-to-January comparison is marginally favorable, at 15.4 million versus 15.3 million. Motor vehicle sales have been very strong the last four months, above a 15 million annual unit rate compared to low 14 million rates through much of last year. The February-to-January comparison is marginally favorable, at 15.4 million versus 15.3 million.
Sales of domestics held steady at 12.1 million units.
The numbers could improve in March once income tax refunds return to normal after the IRS recognized fiscal cliff tax legislation at the last minute of 2012.
Apparently the economy is looking somewhat better to the consumer. Yes, the bar for “better” may be low, but confidence is improving.
 Consumer confidence according to the Conference Board is back up to 69.6 for a more than 10 point gain from January which was deeply depressed by the rise in payroll taxes. Income expectations were hit especially in January and show a very strong rebound with 15.7 percent seeing an increase six months out, up from 13.5 percent in January. Those seeing a decrease fell to 19.6 percent from 23.3 percent. These are big moves which largely reflect home-price appreciation and which take these readings back to where they were in October before the year-end gloom in Washington set in. Consumer confidence according to the Conference Board is back up to 69.6 for a more than 10 point gain from January which was deeply depressed by the rise in payroll taxes. Income expectations were hit especially in January and show a very strong rebound with 15.7 percent seeing an increase six months out, up from 13.5 percent in January. Those seeing a decrease fell to 19.6 percent from 23.3 percent. These are big moves which largely reflect home-price appreciation and which take these readings back to where they were in October before the year-end gloom in Washington set in.
Improvement is reflected in a lack of worry about rising gas prices which are not down holding income expectations. Job readings were mixed with six-month expectations, like they were for income, very strong. But in a negative, the assessment of the current jobs market shows a rise in those who say jobs are hard to get, to 37.0 percent for a four-tenth increase and the highest level since November.
The Reuters/Michigan reading on consumer sentiment also improved. All the negative headlines from sequestration to higher oil prices did not hold down consumer sentiment which rose smartly to 77.6 from a mid-month reading of 76.3. The implied pace for the last half of the month is about 79 which is well above January's 73.8 when the payroll tax shock first struck.
Both expectations, at 70.2 versus a mid-month 68.7, and current conditions, at 89.0 versus 88.0, showed gains. Interestingly, inflation expectations were stable despite the rise in gas prices, unchanged from mid-month at 3.3 percent for the one-year outlook and 3.0 percent for the five-year outlook.
 The economy is looking good-at least for housing. Low mortgage rates have supported sales but a caveat is that large seasonal factors can exaggerate housing numbers during winter months. New home sales in January surged a monthly 15.6 percent to an annualized 437 thousand from an upwardly revised 378 thousand for December. The latest number well topped market expectations for 381 thousand. The economy is looking good-at least for housing. Low mortgage rates have supported sales but a caveat is that large seasonal factors can exaggerate housing numbers during winter months. New home sales in January surged a monthly 15.6 percent to an annualized 437 thousand from an upwardly revised 378 thousand for December. The latest number well topped market expectations for 381 thousand.
As with existing home sales, it looks like supply is constraining sales. Monthly supply dipped to 4.9 months at the current sales pace from 5.6 months in December.
The median sales price unexpectedly dropped to $226,400 from $249,800 in December. But the data do not reflect repeat transactions. Both the Case-Shiller and FHFA home price reports indicated further gains but for December.
Overall, home sales are trending up slowly. Low mortgage rates are a positive as well as a stabilized jobs market. The remaining constraints are tight credit conditions and modest employment growth.
 Existing home sales got off to a slow start in January but the pending home sales report for January points to strong improvement for February. The number of contracts signed to purchase an existing home jumped 4.5 percent in January. Existing home sales got off to a slow start in January but the pending home sales report for January points to strong improvement for February. The number of contracts signed to purchase an existing home jumped 4.5 percent in January.
Available homes on the market are scarce and sales are increasingly draining what inventory there is, shifting the balance in the favor of sellers. But lack of supply is good for prices where growth is at a seven-year high.
 Home prices continue to recover, rising gradually. The FHFA price index for December gained 0.6 percent, following a rise of 0.4 percent the prior month. The December advance was led by the East South Central region, increasing 2.3 percent, with the Middle Atlantic region down 0.1 percent. Home prices continue to recover, rising gradually. The FHFA price index for December gained 0.6 percent, following a rise of 0.4 percent the prior month. The December advance was led by the East South Central region, increasing 2.3 percent, with the Middle Atlantic region down 0.1 percent.
The year-on-year rate posted at plus 5.8 percent versus 5.4 percent in November.
 The FHFA report, as well as a favorable Case-Shiller report, point to further progress in restoring home prices toward pre-recession levels. Recent numbers on supply shortages of homes on the market have indicated upward pressure on prices. The FHFA report, as well as a favorable Case-Shiller report, point to further progress in restoring home prices toward pre-recession levels. Recent numbers on supply shortages of homes on the market have indicated upward pressure on prices.
The Case-Shiller home price index was up a very strong 0.9 percent for December's 20-city. This rate is the best since last year's second quarter when monthly gains averaged a recovery best 1.0 percent. The adjusted year-on-year rate for December is plus 6.9 percent which is the highest since the giant housing bubble back in 2006.
The latest numbers from both reports point to building momentum for home prices going into this year, a year when the best news on the economy may likely be found in home price appreciation.
 Durables orders are living up to their reputation as one of the U.S.'s most volatile monthly indicators. But there still were positives. New orders for durables in January reversed back down 5.2 percent, following a spike of 3.7 percent in December. The transportation component was the key culprit behind the drop, which plunged 19.8 percent after a 9.9 percent gain in December. Excluding transportation, durables orders increased a healthy 1.9 percent in January after a 1.0 percent rise the month before. Durables orders are living up to their reputation as one of the U.S.'s most volatile monthly indicators. But there still were positives. New orders for durables in January reversed back down 5.2 percent, following a spike of 3.7 percent in December. The transportation component was the key culprit behind the drop, which plunged 19.8 percent after a 9.9 percent gain in December. Excluding transportation, durables orders increased a healthy 1.9 percent in January after a 1.0 percent rise the month before.
Outside of transportation, component increases were led by machinery, up 13.5 percent; electrical equipment, up 1.4 percent; and "other," up 1.3 percent. On the downside, weakness was led by computers & electronics, down 5.3 percent, and primary metals, down 3.6 percent.
Nondefense capital goods orders excluding aircraft rebounded a robust 6.3 percent (monthly) in January, following a 0.3 percent dip the month before. However, shipments for this series declined 1.0 percent in January, following no change in December.
Apparently, the manufacturing sector cannot wait for the government to decide on how to resolve fiscal issues. Despite some gloom seen in surveys, the actual national numbers are moderately positive at the core. And business investment in equipment may be back on a modest uptrend. The negative-still to be seen-is that this investment may be a substitute for labor.
In contrast to some regional surveys, the latest national surveys on manufacturing show positive growth. However, the Markit and ISM readings diverged as Markit showed some deceleration while ISM pointed to a faster growth rate in February.
Growth slowed a bit the last half of February based on the PMI manufacturing index which slowed to 54.3 from the mid-month flash reading of 55.2. The final reading versus the flash reading points to a PMI in the low 53 area during the last two weeks. The comparison with the final January reading is 55.8 which is a brisker pace of monthly growth.
Slower growth in orders was the standout detail in today's report, with new orders down one full point from the flash reading to 55.4 which however is still a very respectable rate of monthly growth. But a separate new orders reading on exports is a concern, at 48.5 which is down two tenths from the flash. This is the first contraction in export orders in four months and reflects weakness in Europe and slowing in Asia.
 The ISM's manufacturing report for February offered very good news, accelerating monthly growth for general activity, reflected in a 1.1 point gain for the headline index to 54.2, and acceleration in new orders which jumped 4.5 points to a very strong 57.8. The ISM's manufacturing report for February offered very good news, accelerating monthly growth for general activity, reflected in a 1.1 point gain for the headline index to 54.2, and acceleration in new orders which jumped 4.5 points to a very strong 57.8.
A plus in this report was strength in new orders for exports, which accelerated to 53.5 for a 3-1/2 point gain. Total backlogs were especially strong in the ISM report, at 55.0 for a big 7-1/2 point gain.
There was plenty of economic news this past week. Some numbers were volatile due to special factors, including personal income. But after averaging the volatile series and including other news, the economy is making gradual progress—especially in housing. And manufacturing is regaining strength. It still is not robust, but the recovery is gaining traction. The big question is whether a sequestration fix will happen soon enough to keep it that way.
The highlight is the February numbers for the employment situation on Friday. This will give the Fed an update on progress on unemployment—one of its new goalposts for guidance on rates. Earlier in the week, the Beige Book will hint on whether the Fed might move up unwinding easy policy.
The composite index from the ISM non-manufacturing survey eased five-tenths in January to 55.2 to nevertheless signal still healthy monthly growth in general business conditions. The breakeven point between growth and contraction is 50. Growth in new orders slowed but still showed strength as did business activity which in this report is equivalent to a production index. New orders posted at 54.4, compared to 58.3 in December. Business activity eased to 56.4 from 60.8.
ISM non-manufacturing composite index Consensus Forecast for February 13: 55.0
Range: 53.5 to 56.3
ADP private payroll employment posted a 192,000 gain for January private payrolls versus its revised total for December of 185,000. The BLS figure for January was a 166,000 increase.
ADP private payrolls Consensus Forecast for February 13: 173,000
Range: 140,000 to 210,000
Factory orders swung 1.8 percent higher in December following a downwardly revised November which showed a 0.3 percent decline. New orders for durable goods, reflecting aircraft orders including those for the Boeing 787, rose 4.3 percent which seems like a big spike but not compared to a 9.2 percent surge in September that followed a 13.1 percent plunge in September. The more recent durables orders report in January reversed back down 5.2 percent, following a spike of 3.7 percent in December.
Factory orders Consensus Forecast for January 13: -2.2 percent
Range: -4.5 to +0.5 percent
The Beige Book being prepared for the March 19-20 FOMC meeting is released mid-afternoon ET. Labor market conditions will likely be the key focus, given recent emphasis in policy guidance on the unemployment rate.
The U.S. international trade gap in December unexpectedly narrowed sharply. The shrinkage was broad based and reflected in part a reversal of the iPhone impact in November plus other factors. The trade deficit shrank to $38.5 billion from $48.6 billion in November. Exports jumped 2.1 percent, following a 1.0 percent rebound in November. Imports declined 2.7 percent after rebounding 3.7 percent in November.
International trade balance Consensus Forecast for January 13: -$43.0 billion
Range: -$45.4 billion to -$40.0 billion
Initial jobless claims for the February 23 week fell 22,000 to a better-than-expected level of 344,000, but the decline followed a big and upwardly revised 24,000 spike in the prior week. The four-week average was down 6,750 in the week but the 355,000 level was slightly higher, not lower, than a month ago.
Jobless Claims Consensus Forecast for 3/2/13: 355,000
Range: 335,000 to 362,000
Nonfarm business productivity in the initial report for the fourth quarter fell an annualized 2.0 percent, following a gain of 3.2 percent in the third quarter. Unit labor costs growth jumped an annualized 4.5 percent, following a 2.3 percent decrease in the third quarter. Market expectations were for a 3.1 percent increase. The drop in fourth quarter productivity reflected a deceleration in growth nonfarm business output to an annualized 0.1 percent after a 4.7 percent boost in the quarter before. Hours worked, however, accelerated to a gain of 2.2 percent, following a rise of 1.5 percent in the prior quarter.
Nonfarm Business Productivity Consensus Forecast for revised Q4 12: -1.6 percent annual rate
Range: -1.8 to -1.4 percent annual rate
Unit Labor Costs Consensus Forecast for revised Q4 12: +4.4 percent annual rate
Range: +3.8 to +5.1 percent annual rate
Consumer credit outstanding rose $14.6 billion in December versus a revised $15.9 billion in November. But the revolving credit component has been very flat, up a little bit one month and then down a little bit the next and is down $3.6 billion in the latest data. What is going up is non-revolving credit where vehicle sales come into play, and they have been very strong, but where also student loans are tracked. And student loans continue to climb straight up without much monthly variation.
Consumer credit Consensus Forecast for January 13 +$15.0 billion
Range: +$12.0 billion to +$18.0 billion
Nonfarm payroll employment in January continued to grow at a moderate pace, advancing 157,000, following a gain of 196,000 in December and an increase of 247,000 in November. Private payrolls posted a gain of 166,000 in January after increasing 202,000 the month before. Average hourly earnings rose 0.2 percent in January, following a boost of 0.3 percent December. The average workweek held steady at 34.4 hours. Expectations were for 34.5 hours. However, the unemployment rate reversed course a bit, rising to 7.9 percent in January from 7.8 percent the month before.
Nonfarm payrolls Consensus Forecast for February 13: 171,000
Range: 130,000 to 225,000
Private payrolls Consensus Forecast for February 13: 195,000
Range: 160,000 to 235,000
Unemployment rate Consensus Forecast for February 13: 7.8 percent
Range: 7.7 to 7.9 percent
Average workweek Consensus Forecast for February 13: 34.4 hours
Range: 34.3 to 34.5 hours
Average hourly earnings Consensus Forecast for February 13: +0.2 percent
Range: +0.1 to +0.4 percent
Wholesale inventories for December fell 0.1 percent against no change for wholesale sales, keeping the stock-to-sales ratio in the sector at 1.19 for a second month versus a run of 1.21 and 1.20 readings going back to June. Wholesalers especially worked down their inventories of vehicles amid what was very strong year-end demand at the retail level. Wholesale supplies of farm products were also worked down. Wholesale inventories of metals rose in the month, an area where some companies reported low year-end availability.
Wholesale inventories Consensus Forecast for January 13: +0.4 percent
Range: +0.1 to +0.9 percent
R. Mark Rogers is the author of The Complete Idiot’s Guide to Economic Indicators, Penguin Books.
Econoday Senior Writer Mark Pender contributed to this article.
|
