|
No one has argued that the economy moves in a straight line. And early data from January and prior months make that point. Some key indicators slowed after robust increases in November and December. Importantly, there are early signs of improvement in February.
 Equities were mixed this past week. The Dow was down for a second week in a row. But the broader market edged forward with small caps being the standout positive. Equities were mixed this past week. The Dow was down for a second week in a row. But the broader market edged forward with small caps being the standout positive.
On Monday, on an indicator free day and with little corporate news, stocks dipped marginally, essentially pausing from gains the week before. Company earnings headlined on Tuesday and were mostly favorable with housing shares among the strongest of the day. Also, Avon Products advanced after the company reversed sales declines and cut costs. Still, investors awaited President Obama’s State of the Union speech Tuesday night.
 At mid-week, equities were mixed but mostly positive. However, the Dow dipped after US President Obama Tuesday night called for raising the federal minimum wage to $9 an hour with McDonald’s a notable decliner. Coke also weighed on the Dow after reporting disappointing results. Retail sales for January were close to expectations and were modestly positive after earlier strong gains. At mid-week, equities were mixed but mostly positive. However, the Dow dipped after US President Obama Tuesday night called for raising the federal minimum wage to $9 an hour with McDonald’s a notable decliner. Coke also weighed on the Dow after reporting disappointing results. Retail sales for January were close to expectations and were modestly positive after earlier strong gains.
Stocks again were mixed on Thursday with the Dow easing and other indexes posting modest gains. Initial jobless claims were down notably but news from overseas weighed on stocks. Gross domestic product for the Eurozone declined at a faster than expected rate. The German and French economies also contracted more than forecast in the fourth quarter. Equities mostly declined modestly on Friday despite a boost in consumer sentiment and unexpected boost in Empire State manufacturing. National industrial production was weaker than expected and a leaked internal email on supposedly negative Wal-Mart sales pushed equities down.
Overall, stocks are in somewhat of a pause mode but still with mostly an upward inclination.
Equities were mixed this past week. The Dow was down 0.1 percent; the S&P 500, up 0.1 percent; the Nasdaq, down 0.1 percent; the Russell 2000, up 1.0 percent; and the Wilshire 5000, up o.2 percent.
For the year-to-date, major indexes are up as follows: the Dow, up 6.7 percent; the S&P 500, up 6.6 percent; the Nasdaq, up 5.7 percent; the Russell 2000, up 8.7 percent; and the Wilshire 5000, up 7.2 percent.
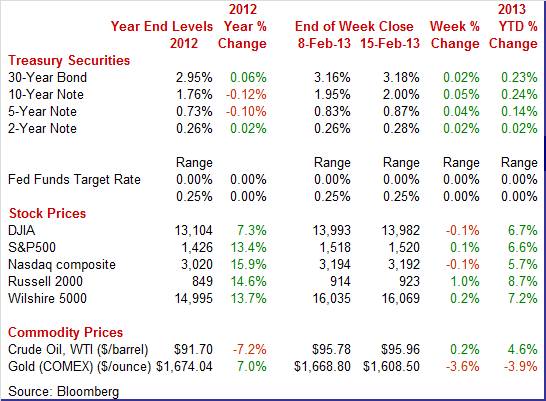
Weekly percent change column reflects percent changes for all components except interest rates. Interest rate changes are reflected in simple differences.
 Treasury yields showed modest movement this past week, firming slightly. Rates were little changed Monday on little economic news and only marginally firmer Tuesday and Wednesday. Tuesday’s rise in rates was merely drifting after the Treasury auction for 3-year notes resulted in record high direct bids and record low indirect bids. Rates nudged up Wednesday on concern that Treasuries are an increasingly risky investment over the long term. Treasury yields showed modest movement this past week, firming slightly. Rates were little changed Monday on little economic news and only marginally firmer Tuesday and Wednesday. Tuesday’s rise in rates was merely drifting after the Treasury auction for 3-year notes resulted in record high direct bids and record low indirect bids. Rates nudged up Wednesday on concern that Treasuries are an increasingly risky investment over the long term.
There was some offset Thursday as rates dipped on increased demand, likely due to negative news on growth in Europe. Yields were little changed Friday.
For this past week Treasury rates were up as follows: 3-month T-bill, up 2 basis points; the 2-year note, up 2 basis points; the 5-year note, up 4 basis points; the 7-year note, up 3 basis points; the 10-year note, up 5 basis points; and the 30-year bond, up 2 basis points.
 Crude oil prices ended the week essentially where they started. There were two moderate daily swings on Monday and Friday. The spot price of West Texas Intermediate rose a little more than a dollar a barrel on Monday on comments by a European Central Bank council member that the euro is not seriously overvalued and indicated that governments should not try to weaken it. Crude oil prices ended the week essentially where they started. There were two moderate daily swings on Monday and Friday. The spot price of West Texas Intermediate rose a little more than a dollar a barrel on Monday on comments by a European Central Bank council member that the euro is not seriously overvalued and indicated that governments should not try to weaken it.
Spot crude declined a little more than a dollar a barrel on Friday after a sluggish report on U.S. industrial production, a report showing a decline in Euro-area exports, and on news of an internal memo from Wal-Mart indicating soft retail sales on increased payroll taxes.
Net for the week, the spot price for West Texas Intermediate edged up 18 cents per barrel to settle at $95.96.
January is turning out to be sluggish on the economic front but followed strong months for December and November for some key economic indicators—notably retail sales and industrial production. But there are signs of improving momentum.
 In the first month since the reduced payroll taxes expired and rose back to traditional rates, retail sales slowed but followed strength in November and December. Retail sales edged up 0.1 percent, following a gain of 0.5 percent in both November and December. Analysts projected a 0.1 percent rise for the latest month. In the first month since the reduced payroll taxes expired and rose back to traditional rates, retail sales slowed but followed strength in November and December. Retail sales edged up 0.1 percent, following a gain of 0.5 percent in both November and December. Analysts projected a 0.1 percent rise for the latest month.
Motor vehicle sales eased 0.1 percent but followed a robust 1.2 percent jump in December. Ex-auto sales in January advanced 0.2 percent after increasing 0.3 percent in December (originally up 0.3 percent).
 Gasoline sales were up a modest 0.2 percent in January, following a 1.7 percent drop the month before. Excluding both autos and gasoline components, sales gained 0.2 percent after increasing 0.7 percent in December (originally up 0.6 percent) and following a 0.8 percent boost in November. Gasoline sales were up a modest 0.2 percent in January, following a 1.7 percent drop the month before. Excluding both autos and gasoline components, sales gained 0.2 percent after increasing 0.7 percent in December (originally up 0.6 percent) and following a 0.8 percent boost in November.
Strength for January was scattered. Importantly, component declines followed sizeable increases in December. Gains were led by general merchandise (up 1.1 percent), nonstore retailers (up 0.9 percent), and building materials & garden supplies (up 0.3 percent). Weakness was led by miscellaneous store retailers (down 2.6 percent), health & personal care (down 1.0 percent), and clothing & accessories (down 0.3 percent).
Clearly the pace of spending slowed in January. However, it is hard to discern the impact of higher taxes given that January came off a strong December. Pullback is normal after prior strength. Higher payroll taxes have cut into disposable income but spending habits change slowly. It is going to take additional reports to determine the impact of higher payroll and income taxes on retail sales.
 The consumer's economic assessment continues to improve but remains below where it was going into year end. Consumer sentiment rose a solid 2.5 points to 76.3 for the mid-month February reading but was still well below the low 80 readings in October and November which were the recovery's best. The consumer's economic assessment continues to improve but remains below where it was going into year end. Consumer sentiment rose a solid 2.5 points to 76.3 for the mid-month February reading but was still well below the low 80 readings in October and November which were the recovery's best.
The assessment of current conditions, which offers one of the earliest looks at February, is up a solid three points to 88.0, but the level is still below the low 90s readings of November. Still, the reading does indicate monthly improvement which is an early positive signal for February's economic data.
 The expectations component was also higher, up 2.1 points to 68.7. This was well up from a low of 62.7 in January's mid-month reading but is noticeably below the 79 and 80 readings of November and October. The expectations component was also higher, up 2.1 points to 68.7. This was well up from a low of 62.7 in January's mid-month reading but is noticeably below the 79 and 80 readings of November and October.
Improvement in the jobs market appears to be a key factor in the improved mood of the consumer. Worries about layoffs have diminished, likely reflecting lower readings for jobless claims. Households expecting more unemployment over the next 12 months slipped to 24 percent in February, notably below December’s 15-month high of 35 percent.
Gas prices are on the rise but are not yet having much impact on inflation expectations. One-year expectations are unchanged at 3.3 percent with five-year expectations up one tenth to 3.0 percent.
The consumer apparently is adapting to higher gasoline prices, higher payroll taxes, and slow progress on the political front related to the federal budget. But the rebound in sentiment still leaves the mood less positive than in autumn 2012.
 Manufacturing in January fell back but after strong gains in December and November. Industrial production in January slipped 0.1 percent, following an advance of 0.4 percent the month before (originally up 0.3 percent) and a 1.4 percent jump in November. Manufacturing in January fell back but after strong gains in December and November. Industrial production in January slipped 0.1 percent, following an advance of 0.4 percent the month before (originally up 0.3 percent) and a 1.4 percent jump in November.
 In January, the manufacturing component declined 0.4 percent, following a boost of 1.1 percent in December and an increase of 1.7 percent in November. The median market forecast was for a 0.3 percent boost. Motor vehicle production decreased 3.2 percent after a gain of 2.9 percent in December and rise of 5.9 percent in November. Other industries were mixed. Excluding motor vehicles, manufacturing output dipped 0.1 percent, following a 0.9 percent increase in December and a 1.3 percent jump in November. In January, the manufacturing component declined 0.4 percent, following a boost of 1.1 percent in December and an increase of 1.7 percent in November. The median market forecast was for a 0.3 percent boost. Motor vehicle production decreased 3.2 percent after a gain of 2.9 percent in December and rise of 5.9 percent in November. Other industries were mixed. Excluding motor vehicles, manufacturing output dipped 0.1 percent, following a 0.9 percent increase in December and a 1.3 percent jump in November.
The output of utilities gained 3.5 percent in January while production at mines fell 1.0 percent.
Capacity utilization for total industry eased to 79.1 percent from 79.3 percent in December. Expectations were for 78.9 percent.
Manufacturing eased in January but followed two very strong months. In this context, the slippage is not so disconcerting. Plus, the most recent manufacturing survey for February—Empire State—shows notable improvement.
 The first indication on manufacturing conditions in February is resoundingly positive. The Empire State index surged 18 points to 10.04 for the first positive reading since July. A positive reading for this index indicates month-to-month growth in general business conditions. And note that a level of 10 is an especially strong rate of growth. The first indication on manufacturing conditions in February is resoundingly positive. The Empire State index surged 18 points to 10.04 for the first positive reading since July. A positive reading for this index indicates month-to-month growth in general business conditions. And note that a level of 10 is an especially strong rate of growth.
Details showed a similar surge in new orders which is very good news for future shipments and employment. Shipments and employment this month already show strong monthly growth. Inventories, which had been in long contraction, show no monthly change which suggests New York manufacturers are building their inventories relative to sales in what is a sign of business confidence. The six-month outlook for general conditions, at 33.07, is very upbeat.
 Businesses brought down their inventories relative to sales in the fourth quarter, setting up what should be a rebuilding for the first quarter and possibly second quarter of this year. Business inventories rose a modest 0.1 percent in December which made for a 1.4 percent sequential gain from the third quarter. The sequential gain for business sales was slightly higher, at 1.5 percent which brings down the stock-to-sales ratio very slightly to 1.278 versus the third quarter's 1.283. Businesses brought down their inventories relative to sales in the fourth quarter, setting up what should be a rebuilding for the first quarter and possibly second quarter of this year. Business inventories rose a modest 0.1 percent in December which made for a 1.4 percent sequential gain from the third quarter. The sequential gain for business sales was slightly higher, at 1.5 percent which brings down the stock-to-sales ratio very slightly to 1.278 versus the third quarter's 1.283.
Wholesalers are showing the leanest trend for inventories with factories right behind. Wholesaler inventories are largely imported autos and the low stocks are likely due to relatively strong motor vehicle sales. Inventories at retailers were stable with inventories up for furniture & appliances but down for building materials.
Several private reports in January, including the ISM manufacturing report, showed inventory builds in the month, suggesting that businesses, having to meet orders, may now be building up their stocks, which is a solid plus for both output and employment. This adds to the argument that inventory investment will add to first quarter GDP, compared to subtracting from fourth quarter GDP.
 Import prices rose a sharp 0.6 percent in January, pulled higher by a 2.9 percent monthly jump in petroleum prices. This reflects the recent run up in crude oil prices. Most likely, this will translate into a bump up in the headline CPI for January (and the PPI for January), based on higher energy costs. However, import prices also suggest modest gains for goods outside of energy. Import prices rose a sharp 0.6 percent in January, pulled higher by a 2.9 percent monthly jump in petroleum prices. This reflects the recent run up in crude oil prices. Most likely, this will translate into a bump up in the headline CPI for January (and the PPI for January), based on higher energy costs. However, import prices also suggest modest gains for goods outside of energy.
 Excluding petroleum, import prices inched only 0.1 percent higher in the month with the year-on-year rate at only plus 0.2 percent. Prices of imported finished goods remain mostly dormant: capital goods unchanged for a year-on-year rate of minus 0.4 percent, consumer goods at plus 0.1 percent for a year-on-year rate of plus 0.2 percent; vehicles up 0.1 percent for a year-on-year that shows a little life at plus 1.5 percent. Excluding petroleum, import prices inched only 0.1 percent higher in the month with the year-on-year rate at only plus 0.2 percent. Prices of imported finished goods remain mostly dormant: capital goods unchanged for a year-on-year rate of minus 0.4 percent, consumer goods at plus 0.1 percent for a year-on-year rate of plus 0.2 percent; vehicles up 0.1 percent for a year-on-year that shows a little life at plus 1.5 percent.
Taking the longer view, the January gain in overall import prices followed declines of 0.5 percent (revised) and 0.7 percent in the two prior months and did little to raise the year-on-year rate which remained in the deflationary column at minus 1.3 percent. However, import prices are heavily based on commodities and these negative numbers will not carry over to readings on consumer prices.
The export side likewise shows only scattered pressure. Total export prices rose an as-expected 0.3 percent in the month, which followed two prior months of declines, with the year-on-year rate at only plus 1.1 percent. Agricultural prices eased 1.3 percent but the year-on-year, reflecting the Midwest drought, continues to show major pressure at plus 10.7 percent in a reading that confirms the strength in the nation's farm incomes. Industrial supplies also showed some pressure, up 0.4 percent and reflecting the month's gain in petroleum inputs. Finished prices are mixed on the export side with consumer products and vehicles showing no pressure but with capital goods showing a spike, up 0.8 percent for a year-on-year rate that is still very benign at plus 1.0 percent.
The latest national economic news reports that retail sales and industrial production are sluggish. But soft numbers should not be surprising given the robust gains in November and December. There still is a question mark about how much of the softness in sales is related to a rise in payroll taxes which reduced disposable income. However, weak inventory numbers very likely point to rebuilding in the next few months—a positive for industrial production.
This week provides key updates on housing, manufacturing, and inflation. Housing starts and existing home sales will provide data on whether the moderate rebound in housing continues. Manufacturing has been oscillating—but more on the positive side. The Markit flash PMI will provide the earliest national data on manufacturing for February while Philly Fed reflects a key manufacturing region. Crude oil prices have risen recently and the January CPI and PPI will indicate how much consumers and businesses have been hit by higher energy costs.
U.S. Holiday: Presidents’ Day. Bond, Equity Markets Closed
The NAHB housing market index for January showed the new home market stalling a bit but following eight prior months of dramatic improvement. The housing market index was unchanged in January at 47, still three points short of the 50 level above which would indicate that more builders describe conditions as good than bad. But one region, the West, is now over 50 at 51. A second region, the Midwest, is right at 50 while the South, at 49, is almost there. The Northeast is dragging the data down, at 36 though the region was up two points in the month. Two of three of the index's components are also in the 50 area with current sales unchanged at 51 and future sales at 49 for a one point dip. Traffic is lagging but at 37 it did gain one point in the month.
NAHB housing market index Consensus Forecast for February 13: 48
Range: 47 to 50
Housing starts in December rebounded a sharp 12.1 percent, following a dip of 4.3 percent the month before. The December starts pace of 0.954 million units was up 36.9 percent on a year-ago basis. The jump in starts was led by the multifamily component although single-family starts also were up notably. Multifamily starts jumped 20.3 percent after a 6.3 percent decline in November. The single-family component gained 8.1 percent in December after decreasing 3.2 percent the prior month. Forward momentum continues as housing permits gained 0.3 percent to an annual pace of 0.903 million units. Market expectations for housing permits for December were for 0.910 million units.
Housing starts Consensus Forecast for January 13: 0.914 million-unit rate
Range: 0.890 million to 0.965 million-unit rate
Housing permits Consensus Forecast for January 13: 0.920 million-unit rate
Range: 0.905 million to 0.939 million-unit rate
The producer price index in December dipped 0.2 percent in December, following a 0.8 percent drop in in November. The core rate, which excludes both food and energy, rose 0.1 percent, following a rebound of 0.1 percent in November. Food inflation posted at down 0.9 percent after jumping 1.3 percent in November. Over one-third of the December decrease was traced to the index for beef and veal, which moved down 4.8 percent. Energy costs in December slipped 0.3 percent after a sharp monthly plunge of 4.6 percent in November. Gasoline declined 1.7 percent after falling 10.1 percent in November. Within the core, upward pressure was seen in passenger cars and tobacco. Partially offsetting were declines in computers and light trucks.
PPI Consensus Forecast for January 13: +0.3 percent
Range: -0.1 to +1.1 percent
PPI ex food & energy Consensus Forecast for January 13: +0.2 percent
Range: 0.0 to +0.5 percent
The Minutes of the January 29-30 FOMC meeting are scheduled for release at 2:00 p.m. ET. The Fed continues its internal debate on the timing of guidance on how long rates will remain exceptionally low and on when to start unwinding balance sheet expansion. While guidance suggests low rates into 2015, details on the debate could affect investment strategies.
The consumer price index in December was unchanged after declining 0.3 percent in November. Excluding food and energy, the CPI edged up 0.1 percent, following a modest 0.1 percent rise in November. By major components, energy declined 1.2 percent after a drop of 4.1 percent in November. Gasoline decreased 2.3 percent after falling a monthly 7.4 percent in November. Food prices gained 0.2 percent in December, following an increase of 0.2 percent in November. Within the core, price pressure was led by airline fares, increasing a monthly 1.2 percent, and tobacco, gaining 0.5 percent.
CPI Consensus Forecast for January 12: +0.1 percent
Range: 0.0 to +0.4 percent
CPI ex food & energy Consensus Forecast for January 12: +0.2 percent
Range: +0.1 to +0.2 percent
Initial jobless claims fell 27,000 in the February 9 week to a 341,000 level. The four-week average, at 352,500, was about 10,000 below the month-ago trend which offers an early indication of strength for the February employment report. Continuing claims in data for the February 2 week were down 130,000 to 3.187 million, a very sizable drop that takes the unemployment rate for insured workers to a new recovery low of 2.4 percent.
Jobless Claims Consensus Forecast for 2/16/13: 358,000
Range: 335,000 to 375,000
The Markit PMI manufacturing index (final) for January edged back but only very slightly from mid-month, to 55.8 from the flash reading of 56.1. The 55.8 reading is well above 50 to indicate sizable month-to-month growth and was above December's reading of 54.0 to indicate a faster rate of monthly growth. Growth in new orders and output both remained very strong though both slipped fractionally from mid-month, ending January at 57.4 for new orders and at 56.8 for output.
Markit PMI manufacturing flash index Consensus Forecast for February 13: 55.5
Range: 55.0 to 57.0
Existing home sales were down 1.0 percent in December, but followed a 4.8 percent surge in November. December’s annual rate of 4.94 million was still up 12.8 percent on a year-ago basis. Supply was severely constrained at 4.4 months at the current sales rate versus 4.8 months in November and compared to 6.4 months in December 2011. Low supply may be bad for sales but it is good for prices which rose 0.8 percent in the month to a median $180,800. The year-on-year gain in the median price, at 11.5 percent in December, trended in the low double digits through the fourth quarter.
Existing home sales Consensus Forecast for January 13: 4.90 million-unit rate
Range: 4.83 to 5.01 million-unit rate
The general business conditions index of the Philadelphia Fed's Business Outlook Survey for January was back in contraction at minus 5.8 versus December's revised plus 4.6. New orders swung back below zero to minus 4.3 which was the seventh negative reading of the last 10 months. Unfilled orders, at minus 1.0, were below zero for the ninth time in 10 months. There was one notable positive—the six-month outlook where optimism, despite current weakness, is building.
Philadelphia Fed survey Consensus Forecast for February 13: 1.1
Range: -2.0 to 10.0
The Conference Board's index of leading indicators showed a strong gain in December but it likely reflected both the special impact of Hurricane Sandy and moderate forward momentum in general. Seasonal distortions and distortions from Hurricane Sandy made for violent swings in jobless claims and, in turn, the index of leading indicators. The index was up a sharp 0.5 percent in December following a revised no change reading in November. But a fall in jobless claims from inflated November levels was by far the largest positive contributor—adding a 0.44 percentage point contribution in December, following a negative 0.36 in November. The report's interest rate measure and credit measure were also positive with the latter hinting at a freeing up of credit. The stock market is another positive. The reading on consumer expectations was December's largest negative. Finally, the coincident index posted a 0.2 percent rise, which indicates a respectable rate of ongoing growth, and a very strong 0.7 percent rate for the lagging index which points to stronger-than-expected growth in prior periods.
Leading indicators Consensus Forecast for January 13: +0.3 percent
Range: +0.2 to +0.7 percent
R. Mark Rogers is the author of The Complete Idiot’s Guide to Economic Indicators, Penguin Books.
Econoday Senior Writer Mark Pender contributed to this article.
|
