|
It was not a standout week. There was limited economic news. But as earnings season is winding down, earnings for the most part continue to somewhat beat expectations and economic indicators point toward further but moderate economic growth. It was not a standout week, but it was a mostly good week.
 Equities ended the week mostly up. However, the Dow broke a streak of five weekly gains, dipping slightly. The biggest daily decline was on Monday with most major indexes dropping over one percent. Selling pressure on the economic front came from a downward revision to durables orders and renewed worries over the Eurozone debt crisis as Spanish and Italian bond yields climbed. More likely, the downdraft in stocks was led by profit taking as insider trading was heard to have picked up on the sell side. Equities ended the week mostly up. However, the Dow broke a streak of five weekly gains, dipping slightly. The biggest daily decline was on Monday with most major indexes dropping over one percent. Selling pressure on the economic front came from a downward revision to durables orders and renewed worries over the Eurozone debt crisis as Spanish and Italian bond yields climbed. More likely, the downdraft in stocks was led by profit taking as insider trading was heard to have picked up on the sell side.
 But on Tuesday, favorable earnings led stocks back up, almost recouping Monday’s declines. Techs were on the forefront with Dell announcing a leveraged buyout. Topping expectations were Archer Daniels Midland, Estee Lauder, and Computer Sciences. Also, ISM non-manufacturing was positive. At mid-week, major indexes were mostly little changed with no notable news on the economy. Better-than-expected earnings essentially offset concern over Europe’s debt crisis before a gathering of euro-area leaders the next day. Also, some traders went to the sidelines, awaiting Thursday’s monetary policy announcements from the Bank of England and the European Central Bank. But on Tuesday, favorable earnings led stocks back up, almost recouping Monday’s declines. Techs were on the forefront with Dell announcing a leveraged buyout. Topping expectations were Archer Daniels Midland, Estee Lauder, and Computer Sciences. Also, ISM non-manufacturing was positive. At mid-week, major indexes were mostly little changed with no notable news on the economy. Better-than-expected earnings essentially offset concern over Europe’s debt crisis before a gathering of euro-area leaders the next day. Also, some traders went to the sidelines, awaiting Thursday’s monetary policy announcements from the Bank of England and the European Central Bank.
Stocks fell moderately Thursday despite a decline in initial jobless claims and despite strong results by U.S. retailers. Comments by the European Central Bank President Mario Draghi on the euro raised worries about Europe's outlook and sent many traders into flight to safety toward Treasuries and away from equities. European policy makers warned the euro’s advance could hamper the region’s recovery. Also, corporate earnings largely disappointed on the day with standouts including Green Mountain Coffee Roasters, Limited Brands, and Sprint.
Equities were up moderately strong at week’s close with lift coming from favorable earnings and after European Union leaders agreed to a seven-year budget that reduces spending for the first time. The S&P 500 and Nasdaq were up for the sixth week in a row.
Equities were mostly up this past week. The S&P 500 was up 0.3 percent; the Nasdaq, up 0.5 percent; the Russell 2000, up 0.3 percent; and the Wilshire 5000, up 0.3 percent. The Dow edged down 0.1 percent.
For the year-to-date, major indexes are up as follows: the Dow, up 6.8 percent; the S&P 500, up 6.4 percent; the Nasdaq, up 5.8 percent; the Russell 2000, up 7.6 percent; and the Wilshire 5000, up 6.9 percent.
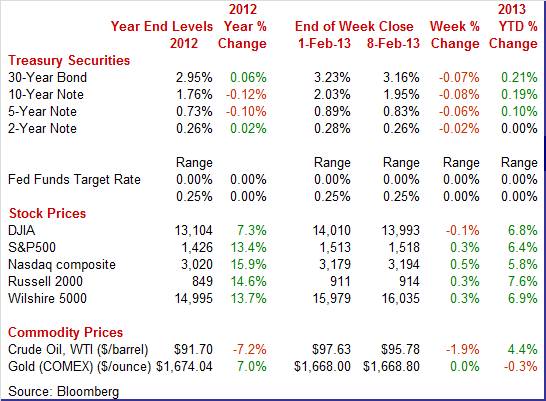
Weekly percent change column reflects percent changes for all components except interest rates. Interest rate changes are reflected in simple differences.
 Treasury yields ended the week down moderately. The largest daily swing was Monday as the prior week’s rise in rates attracted investors—notably the 10-year bond topping a 2 percent yield. The decline in stocks also sent some traders to safety. However, rates headed back up Tuesday on news of improving economic conditions in Europe. Purchasing manager indexes showed better numbers for manufacturing and services sectors for the Eurozone overall and for Germany. France remained in contraction. The U.S. non-manufacturing report also helped yields to firm. Treasury yields ended the week down moderately. The largest daily swing was Monday as the prior week’s rise in rates attracted investors—notably the 10-year bond topping a 2 percent yield. The decline in stocks also sent some traders to safety. However, rates headed back up Tuesday on news of improving economic conditions in Europe. Purchasing manager indexes showed better numbers for manufacturing and services sectors for the Eurozone overall and for Germany. France remained in contraction. The U.S. non-manufacturing report also helped yields to firm.
At mid-week, rates eased as many traders headed to safety ahead of Thursday’s policy decisions by the ECB and Bank of England. The 10-year note dipped below 2 percent. Rates essentially were unchanged as a decline in initial jobless claims was offset by comments by ECB president Mario Draghi on a potential downgrade to the Eurozone economy. Rates were little changed Friday despite a narrower trade deficit adding to GDP and favorable news out of Europe.
For this past week Treasury rates were down as follows: the 2-year note, down 2 basis points; the 5-year note, down 6 basis points; the 7-year note, down 8 basis points; the 10-year note, down 8 basis points; and the 30-year bond, down 7 basis points. The 3-month T-bill firmed 2 basis points.
 Spot WTI broke a string of eight consecutive weekly gains. The biggest move was a drop on Monday of about $1-1/2 per barrel. Crude dropped on concerns about political uncertainty in Spain and Italy and potential impact on European sovereign debt. Also, the possibility of an easing of tensions with Iran softened crude. U.S. Vice President Joe Biden offered for the U.S. to negotiate directly with Iran over its nuclear program. On Tuesday, spot West Texas Intermediate rebounded somewhat on a positive ISM non-manufacturing report. Also, China’s services PMI hit its highest level in four months. Spot WTI broke a string of eight consecutive weekly gains. The biggest move was a drop on Monday of about $1-1/2 per barrel. Crude dropped on concerns about political uncertainty in Spain and Italy and potential impact on European sovereign debt. Also, the possibility of an easing of tensions with Iran softened crude. U.S. Vice President Joe Biden offered for the U.S. to negotiate directly with Iran over its nuclear program. On Tuesday, spot West Texas Intermediate rebounded somewhat on a positive ISM non-manufacturing report. Also, China’s services PMI hit its highest level in four months.
Crude was flat on Wednesday. On Thursday, WTI fell on the ECB president’s comments on downside risks to Eurozone growth from a stronger euro. Spot WTI was unchanged Friday despite better-than-expected trade data from China. Cushing prices continue to be weighed down by reduced capacity in the Seaway Pipeline to the U.S. Gulf Coast.
Net for the week, the spot price for West Texas Intermediate dropped $1.85 per barrel to settle at $95.78.
While news was limited, the latest indicator news suggests the fourth quarter ended with a positive month and that 2013 is getting off to a moderately healthy start.
 The U.S. trade balance in December unexpectedly narrowed sharply. The shrinkage was broad based and reflected in part a reversal of the iPhone impact in November plus other factors. The trade deficit shrank to $38.5 billion from $48.6 billion in November. Exports jumped 2.1 percent, following a 1.0 percent rebound in November. Imports declined 2.7 percent after rebounding 3.7 percent in November. The U.S. trade balance in December unexpectedly narrowed sharply. The shrinkage was broad based and reflected in part a reversal of the iPhone impact in November plus other factors. The trade deficit shrank to $38.5 billion from $48.6 billion in November. Exports jumped 2.1 percent, following a 1.0 percent rebound in November. Imports declined 2.7 percent after rebounding 3.7 percent in November.
 The improvement in the trade gap was led by both the petroleum balance and goods excluding petroleum balance. The petroleum deficit narrowed to $18.7 billion from $23.4 billion in November. The goods excluding petroleum balance decreased to a $36.9 billion shortfall versus $41.5 billion in November. Finally, the services surplus expanded to $17.7 billion in December from $17.0 billion the month before. The improvement in the trade gap was led by both the petroleum balance and goods excluding petroleum balance. The petroleum deficit narrowed to $18.7 billion from $23.4 billion in November. The goods excluding petroleum balance decreased to a $36.9 billion shortfall versus $41.5 billion in November. Finally, the services surplus expanded to $17.7 billion in December from $17.0 billion the month before.
Exports were led by industrial supplies and civilian aircraft. The boost in industrial supplies included a rise in exports of nonmonetary gold.
The drop in imports was led by crude oil and automotive. Looking ahead, the decline in oil imports may merely have been an issue of timing. Also, with healthy demand for autos, the decrease in the import component is almost certainly to be short lived.
On a mildly positive note, imports of consumer goods edged up after a strong gain in November, suggesting that businesses still see consumer demand as moderately healthy. Also, the consumer goods gain was soft, coming off the November spike from imports of iPhones. The iPhone effect had a significant role in the sharp widening in the overall trade gap to $48.6 billion in November from $42.2 billion in October. The December dip in capital goods excluding autos may have been due to uncertainty over the fiscal cliff and there may be improvement after partial resolution of this issue.
December’s sharp drop in the trade deficit suggests a notable upward revision to fourth quarter GDP, almost certainly bumping the number back into positive territory. The real trade deficit for goods posted at $44.1 billion in December, compared to $51.8 billion in November and $46.0 billion in October.
 The ISM nonmanufacturing composite index eased five-tenths in January to 55.2 to nevertheless signal still healthy monthly growth in general business conditions. The breakeven point between growth and contraction is 50. Growth in new orders slowed but still showed strength as did business activity which in this report is equivalent to a production index. New orders posted at 54.4, compared to 58.3 in December. Business activity eased to 56.4 from 60.8. The ISM nonmanufacturing composite index eased five-tenths in January to 55.2 to nevertheless signal still healthy monthly growth in general business conditions. The breakeven point between growth and contraction is 50. Growth in new orders slowed but still showed strength as did business activity which in this report is equivalent to a production index. New orders posted at 54.4, compared to 58.3 in December. Business activity eased to 56.4 from 60.8.
Strong gains for employment were tallied in the ISM's non-manufacturing report which offers an indication of rising momentum for the bulk of the nation's jobs market. The report's employment index jumped 2.2 points in January to 57.5 which was the strongest rate of monthly growth since February 2006. This index surged nearly five points in the prior month in what is one of the strongest monthly gains in the 15-year history of the report.
Overall, the ISM non-manufacturing survey points to moderate growth for the economy in the first quarter.
 Productivity took a hit in the fourth quarter, largely reflecting weakness in output, earlier seen in the dip in fourth quarter GDP. Nonfarm business productivity fell an annualized 2.0 percent, following a gain of 3.2 percent in the third quarter. Unit labor costs growth jumped an annualized 4.5 percent, following a 2.3 percent decrease in the third quarter. Market expectations were for a 3.1 percent increase. Productivity took a hit in the fourth quarter, largely reflecting weakness in output, earlier seen in the dip in fourth quarter GDP. Nonfarm business productivity fell an annualized 2.0 percent, following a gain of 3.2 percent in the third quarter. Unit labor costs growth jumped an annualized 4.5 percent, following a 2.3 percent decrease in the third quarter. Market expectations were for a 3.1 percent increase.
 The drop in fourth quarter productivity reflected a deceleration in growth nonfarm business output to an annualized 0.1 percent after a 4.7 percent boost in the quarter before. Hours worked, however, accelerated to a gain of 2.2 percent, following a rise of 1.5 percent in the prior quarter. The drop in fourth quarter productivity reflected a deceleration in growth nonfarm business output to an annualized 0.1 percent after a 4.7 percent boost in the quarter before. Hours worked, however, accelerated to a gain of 2.2 percent, following a rise of 1.5 percent in the prior quarter.
Adding to growth in unit labor costs was a 2.4 percent boost in fourth quarter compensation—an acceleration from 0.8 percent the quarter before.
Year-on-year, productivity was up 0.6 percent in the fourth quarter, down from 1.8 percent the quarter before. Year-ago unit labor costs were up 1.9 percent versus unchanged in the third quarter. Hourly compensation was up 2.6 percent versus 1.8 percent in the third quarter.
The fourth quarter productivity and costs report was not pretty. However, there may have been special factors. On the output side, production may have been held back by fiscal cliff uncertainty and there likely will be improvement in 2013. As was the case with personal income, the fourth quarter compensation number likely includes accelerated income payments (including bonuses) from 2013 to December and even November 2012. Improvement in labor costs is likely in the first half.
 The consumer continues to take on new debt at a steady and strong clip but whether it points to rising demand is uncertain. Consumer credit rose $14.6 billion in December versus a revised $15.9 billion in November and compared to $14.0 billion in October. The consumer continues to take on new debt at a steady and strong clip but whether it points to rising demand is uncertain. Consumer credit rose $14.6 billion in December versus a revised $15.9 billion in November and compared to $14.0 billion in October.
Strength was in the non-revolving component which gained $18.2 billion—the strongest monthly boost since 2001 after discounting a sharp definitional break in the series in December 2010. Non-revolving credit primarily includes auto loans and student loans. In recent quarters, student loans have been rising sharply, partially reflecting government agency purchases of existing loans from private lenders. Also, with parental income sluggish, students have had to rely more on loans to fund education.
The revolving credit component (primarily credit card balances) declined $3.6 billion in December. Given the healthy retail sales figures for December, consumers are still relying on cash. This may be due to consumers continuing to mend their credit and/or due to credit card companies keeping credit tight.
The latest ISM non-manufacturing survey indicates a moderately good start for 2013 while the international trade report was complex. Overall, growth in early 2013 is moderately positive
The highlight this week is retail sales—the first reading since consumers were hit with higher payroll taxes. The preliminary consumer sentiment survey for February may indicate whether the consumer is gaining or losing momentum. The key manufacturing sector is updated with industrial production. Finally, December business inventories likely will get extra attention as a healthy figure could translate into stronger fourth quarter GDP. The inventory component was notably weak in the advance GDP report.
The NFIB Small Business Optimism Index edged 1/2 point higher in December to a still very low and recessionary 88.0. Taxes and regulations were the sample's top two business problems followed closely by poor sales. But sales expectations nevertheless did improve as did earnings trends. Employment in the sample remained flat with demand for credit weak. The bulk of the sample believes it is a bad time right now to expand.
NFIB Small Business Optimism Index Consensus Forecast for January 13: 89.5
Range: 88.3 to 90.0
The U.S. Treasury monthly budget report showed a December deficit of only $0.3 billion, compared to the median market forecast for a shortfall of $20.0 billion. But December's favorable number was affected by timing factors. Excluding special factors, the December deficit was $17 billion versus $70 billion for December 2011. Excluding special factors, the FYTD13 posted at $286, compared to $336 for FYTD12 in December. Looking ahead, the month of January typically shows a deficit for the month. Over the past 10 years, the average deficit for the month of January has been $8.9 billion and $33.1 billion over the past 5 years. The January 2012 deficit came in at $27.4 billion. On February 7, the Congressional Budget Office announced its estimate for the January deficit at $2.0 billion.
Treasury Statement Consensus Forecast for January 13: -$2.0 billion
Range: -$2.0 billion to -$2.0 billion.
Retail sales in December gained 0.5 percent after a 0.4 percent rebound the month before. In contrast to unit new motor vehicle sales, auto sales were up notably in the retail sales report—either due to differences in the survey sample or price changes. Motor vehicle sales were up 1.6 percent in December after a 2.7 percent boost the prior month. Ex-auto sales in December posted a 0.3 percent rise, following a 0.1 percent dip in November. But gasoline prices weighed down on gasoline station sales which declined 1.6 percent, following a 4.5 percent drop in November. Excluding both autos and gasoline components, sales advanced a healthy 0.6 percent, matching the prior month’s pace.
Retail sales Consensus Forecast for January 13: +0.1 percent
Range: -0.8 to +0.6 percent
Retail sales excluding motor vehicles Consensus Forecast for January 13: +0.2 percent
Range: -1.0 to +0.6 percent
Less motor vehicles & gasoline Consensus Forecast for January 13: +0.3 percent
Range: -0.1 to +0.8 percent
Import prices were down 0.1 percent in December for a minus 1.5 percent year-on-year rate. Petroleum prices, down 0.8 percent on the month, pulled the year-on-year rate into the minus column for the seventh time in the last eight months. Petroleum prices were down 7.1 percent year-on-year. Prices for imported finished goods remained dormant, down 0.2 percent for a second month for capital goods and down 0.1 percent for a second month for consumer goods. Year-on-year, capital goods prices are unchanged with consumer prices down 0.1 percent. Though unchanged on the month, vehicle imports are showing some pressure with a 1.9 percent year-on-year rate. The export side is more of the same with total prices down 0.1 percent following a 0.7 percent decline in the prior month. The year-on-year rate is plus 1.1 percent.
Import prices Consensus Forecast for January 13: +0.8 percent
Range: +0.1 to +1.2 percent
Export prices Consensus Forecast for January 13: +0.3 percent
Range: -0.2 to +0.4 percent
Business inventories rose 0.3 percent in November, well below a 1.0 percent rise for sales. The inventory-to-sales ratio, at 1.28, did not show change out to two decimals but it did out to three, at 1.275 versus 1.285 in October for the lowest ratio since May.
Business inventories Consensus Forecast for December 12: +0.3 percent
Range: 0.0 to +0.4 percent
Initial jobless claims declined 5,000 in the February 2 week to 366,000. The four-week average was down 2,250 to 350,500 and was down more than 15,000 compared with early January. Improvement in continuing claims has stalled a bit with the count up 8,000 in data for the January 26 week to 3.224 million. The four-week average of 3.211 million was virtually unchanged from the month-ago trend.
Jobless Claims Consensus Forecast for 2/9/13: 360,000
Range: 350,000 to 375,000
The Empire State manufacturing index was little changed in the January reading, at minus 7.78 versus a revised minus 7.30 to indicate monthly contraction at a slightly deeper rate than December. Data on orders were especially soft. New orders were at minus 7.18 versus the prior month's minus 3.44. Unfilled orders posted at minus 7.53, compared to minus 6.45 in December to extend a long run of contraction.
Empire State Manufacturing Survey Consensus Forecast for February 13: -1.75
Range: -6.40 to +4.00
Industrial production in December advanced 0.3 percent, following a 1.0 percent rebound in November. The November spike was largely due to recovering from Hurricane Sandy. More importantly, in December, the manufacturing component jumped 0.8 percent, following an increase of 1.3 percent the prior month. Motor vehicle production was strong with a 2.6 percent rise after a 5.8 percent boost in November. But other industries were strong. Excluding motor vehicles, manufacturing output increased 0.7 percent after a 0.9 percent rebound in November. Capacity utilization for total industry rose to 78.8 percent from 78.7 percent in November. Analysts forecast a rate of 78.5 percent. Looking ahead, production worker hours in manufacturing were flat for the month, suggesting a sluggish manufacturing component for January industrial production.
Industrial production Consensus Forecast for January 13: +0.3 percent
Range: -0.3 to +0.5 percent
Manufacturing production component Consensus Forecast for January 13: +0.2 percent
Range: -0.4 to +0.7 percent
Capacity utilization Consensus Forecast for January 13: 78.9 percent
Range: 78.5 to 79.3 percent
The Reuter's/University of Michigan's consumer sentiment index improved to 73.8 for the final January reading versus 71.3 at mid-month. The reading implies that sentiment is a bit over 75 for the second half of the month, which is off from the low 80s in October and November but is otherwise back in trend. Current conditions were little changed from mid-month at 85.0 with the improvement centered in expectations, at 66.6 for the final reading versus 62.7 at mid-month.
Consumer sentiment Consensus Forecast for preliminary February 13: 75.0
Range: 73.0 to 77.0
R. Mark Rogers is the author of The Complete Idiot’s Guide to Economic Indicators, Penguin Books.
Econoday Senior Writer Mark Pender contributed to this article.
|
