|
The standout reports for this past week were fourth quarter GDP and January employment. GDP disappointed while payroll employment advanced not far from expectations. But the big news was the vast array of other indicators that lined up in the positive column. Plus corporate earnings were mostly favorable.
 It was a somewhat bumpy week for equities but a strong finish ended with moderate net gains. Stocks were mixed as an unexpected drop in pending home sales offset a strong durable goods report. Yahoo! and Apple helped techs end slightly positive while Caterpillar helped to stem losses in the blue chips. On Tuesday, the focus largely was on favorable earnings with a few standouts including Pfizer, Eli Lilly, Boston Scientific, and Valero Energy. Notably, a healthy Case-Shiller report also added to lift. It was a somewhat bumpy week for equities but a strong finish ended with moderate net gains. Stocks were mixed as an unexpected drop in pending home sales offset a strong durable goods report. Yahoo! and Apple helped techs end slightly positive while Caterpillar helped to stem losses in the blue chips. On Tuesday, the focus largely was on favorable earnings with a few standouts including Pfizer, Eli Lilly, Boston Scientific, and Valero Energy. Notably, a healthy Case-Shiller report also added to lift.
 Stocks dipped at mid-week. Early in the day, traders shrugged off a dip in fourth quarter GDP. But in the afternoon, traders apparently were hoping for more from the Fed as equities dipped following the FOMC statement—even though it continued prior policy and even had encouraging remarks about economic growth in upcoming quarters. Stocks dipped at mid-week. Early in the day, traders shrugged off a dip in fourth quarter GDP. But in the afternoon, traders apparently were hoping for more from the Fed as equities dipped following the FOMC statement—even though it continued prior policy and even had encouraging remarks about economic growth in upcoming quarters.
On Thursday, equities were mostly down. Favorable news on personal income & spending and the Chicago PMI were offset by a significant climb in initial jobless claims. Earnings news was mixed with standouts Qualcomm up and Facebook down. At week’s close, equities posted strong gains on a string of favorable economic news. The January jobs report was not far from expectations but afterwards better-than-expected economic news included Markit PMI, consumer sentiment, ISM manufacturing, and construction spending. The Friday news made the GDP report a thing of the past.
The Dow closed Friday above 14,000 for the first time since October 12, 2007.
Equities were up this past week. The Dow was up 0.8 percent; the S&P 500, up 0.7 percent; the Nasdaq, up 0.9 percent; the Russell 2000, up 0.7 percent; and the Wilshire 5000, up 0.7 percent.
 For the month of January, major indexes were up as follows: the Dow, up 5.8 percent; the S&P 500, up 5.0 percent; the Nasdaq, up 4.1 percent; the Russell 2000, up 6.2 percent; and the Wilshire 5000, up 5.5 percent. For the month of January, major indexes were up as follows: the Dow, up 5.8 percent; the S&P 500, up 5.0 percent; the Nasdaq, up 4.1 percent; the Russell 2000, up 6.2 percent; and the Wilshire 5000, up 5.5 percent.
For the year-to-date, major indexes are up as follows: the Dow, up 6.9 percent; the S&P 500, up 6.1 percent; the Nasdaq, up 5.3 percent; the Russell 2000, up 7.3 percent; and the Wilshire 5000, up 6.6 percent.
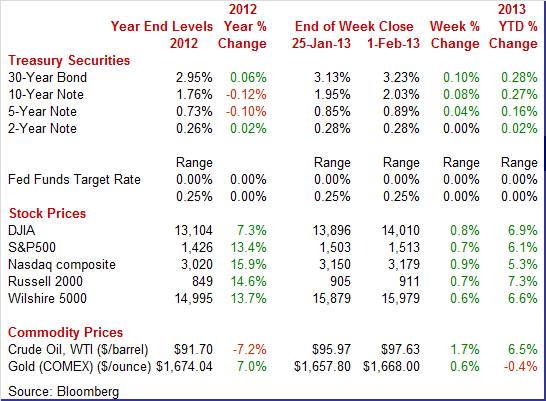
Weekly percent change column reflects percent changes for all components except interest rates. Interest rate changes are reflected in simple differences.
 Except on the short end, Treasury rates were up moderately for the week. On Monday, bond traders had a little different focus than equity traders. Rates nudged up on the strong durables orders and the decline in in pending home sales was not seen as worrisome. The 10-year note hit 2 percent in intraday trading for the first time since April. Rates nudged up Tuesday with the 10-year note closing at 2 percent on better-than-expected Case-Shiller home prices. Except on the short end, Treasury rates were up moderately for the week. On Monday, bond traders had a little different focus than equity traders. Rates nudged up on the strong durables orders and the decline in in pending home sales was not seen as worrisome. The 10-year note hit 2 percent in intraday trading for the first time since April. Rates nudged up Tuesday with the 10-year note closing at 2 percent on better-than-expected Case-Shiller home prices.
Rates were little changed Wednesday and Thursday. Yields rose moderately on the spate of strong economic news.
For this past week Treasury rates mostly were up as follows: the 5-year note, up 4 basis points; the 7-year note, up 8 basis points; the 10-year note, up 8 basis points; and the 30-year bond, up 9 basis points. The 3-month T-bill was down 2 basis points while the 2-year note was unchanged.
 The spot prices of West Texas Intermediate rose somewhat this past week. However, the only notable daily change was on Tuesday. Crude rose almost a dollar a barrel on the strong report on home prices. The spot prices of West Texas Intermediate rose somewhat this past week. However, the only notable daily change was on Tuesday. Crude rose almost a dollar a barrel on the strong report on home prices.
The upward trend in oil prices continues. Crude is at its highest level since May 7, 2012.
Net for the week, the spot price for West Texas Intermediate advanced $1.12 per barrel to settle at $97.63.
The economic data actually were lopsided this past week. Yes, fourth quarter GDP was disappointing. But the overwhelming majority of news was positive and more recent than fourth quarter GDP.
 The fourth quarter GDP number was shockingly low. The economy weakened in the fourth quarter, posting a minus 0.1 percent annualized pace, following a third quarter gain of 3.1 percent. The latest GDP number fell far short of the consensus forecast of 1.0 percent. It was the first GDP decline since 2009. The fourth quarter GDP number was shockingly low. The economy weakened in the fourth quarter, posting a minus 0.1 percent annualized pace, following a third quarter gain of 3.1 percent. The latest GDP number fell far short of the consensus forecast of 1.0 percent. It was the first GDP decline since 2009.
 Much of the slowing in growth was largely due to a sharp slowing in inventory investment and a drop in government purchases. Demand figures were not quite as weak as overall GDP but still sluggish. Final sales of domestic product rose 1.1 percent, following an increase of 2.4 percent in the third quarter. Final sales to domestic producers (which exclude net exports) posted a modest 1.3 percent gain after rising 1.9 percent the quarter before. Much of the slowing in growth was largely due to a sharp slowing in inventory investment and a drop in government purchases. Demand figures were not quite as weak as overall GDP but still sluggish. Final sales of domestic product rose 1.1 percent, following an increase of 2.4 percent in the third quarter. Final sales to domestic producers (which exclude net exports) posted a modest 1.3 percent gain after rising 1.9 percent the quarter before.
By components, positive contributions came from personal consumption, nonresidential investment (the equipment & software component), and residential investment. PCEs growth actually improved to an annualized 2.2 percent, following a 1.6 percent rise in the third quarter.
Weakness was led by the government component. Government purchases fell an annualized 6.6 percent after a 3.9 percent rise in the third quarter. The drop in this component was led by national defense purchases which fell an annualized 22.2 percent. Next, the inventory change component grew at one-third the pace in the prior quarter. The government component cut GDP growth by 1.33 percentage points while inventories reduced GDP growth by 1.27 percentage points. Net exports were a modest negative.
Headline inflation for the GDP price index showed a 0.6 percent annualized inflation rate versus 2.7 percent in the third quarter. When excluding food and energy, inflation pressure came in at 1.1 percent, compared to 1.3 percent the prior quarter.
The latest numbers clearly are disappointing. There are probably three key points. First, final sales were somewhat improved—especially in the private sector—and the latest monthly data are more positive overall. Second, inventory growth fell sharply and likely was due to a large degree to uncertainty over fiscal policy. There is significant upside potential for inventory growth in 2013 if fiscal issues are resolved. Finally, the defense sector in the government component is at risk if current sequestration rules are not changed and this could weigh on overall growth.
Turning to labor market news, the latest employment situation report suggests that the economy was not as weak in the fourth quarter as indicated by the modest decline in GDP.
 Jobs growth for January fell short of expectations but continued at a moderate pace. However, The unemployment rate reversed course a bit, rising to 7.9 percent in January from 7.8 percent the month before. Jobs growth for January fell short of expectations but continued at a moderate pace. However, The unemployment rate reversed course a bit, rising to 7.9 percent in January from 7.8 percent the month before.
Payroll jobs in January continued to grow at a moderate pace, advancing 157,000, following a gain of 196,000 in December (originally up 155,000) and an increase of 247,000 in November (previously up 161,000). The net revisions for November and December were up 156,000.
The upward revisions are from annual revisions and indicate that job growth has been somewhat stronger than earlier believed. In 2012, employment growth averaged 181,000 per month. Most of the upward revisions were in the latter part of the year. Prior to the annual revisions, monthly gains averaged 153,000 for 2012. Overall, the annual revisions showed that the economy added 335,000 more jobs in 2012 than originally reported.
Private payrolls posted a gain of 166,000 in January after increasing 202,000 the month before. The consensus expected a 185,000 increase.
In the private sector, relative strength was in the service-providing sector which posted a gain of 130,000, following a rise of 158,000 in December. January’s gains were led by retail trade, up 33,000; professional & business services, up 25,000; and health care up 23,000.
Goods-producing jobs advanced 36,000 after a 44,000 boost in December. Construction jumped 28,000 in the latest month with mining up 6,000 and manufacturing up 4,000.
Government jobs dipped 9,000 in January after a 6,000 decrease the prior month.
Earnings are continuing moderately healthy gains but at a slower pace in January. Average hourly earnings rose 0.2 percent in January, following a boost of 0.3 percent December. The market consensus was for a 0.1 percent gain. The average workweek held steady at 34.4 hours. Expectations were for 34.5 hours.
Turning to detail for the household survey, the rise in the unemployment rate reflected a 143,000 boost in the labor force while household employment edged up only 17,000.
Looking ahead to the personal income report, private aggregate weekly earnings rose 0.4 percent in January, pointing to a moderate rise in private wages & salaries. Production worker hours in manufacturing were flat for the month, suggesting a sluggish manufacturing component for January industrial production.
The good news is that annual revisions to payroll employment suggest that the end of the year was not really as bad as the decline in GDP for the fourth quarter. The bad news is that job growth is still subpar. Equities rose on the employment release. This may have been due to upward revisions to 2012 or belief that moderate growth keeps the Fed loose or both.
 The fiscal cliff and January tax increases actually had a positive impact on some economic news in December—and with huge magnitude on personal income. Personal income soared a monthly 2.6 percent, following a 1.0 percent jump in November. The huge gain for December was due to special dividends that were paid by many companies late in the quarter in anticipation of changes in individual income tax rates, as well as some acceleration in wages and salaries. The wages and salaries component rose 0.6 percent, following a 0.9 percent boost in November. November was strong due to recovering from Hurricane Sandy. The fiscal cliff and January tax increases actually had a positive impact on some economic news in December—and with huge magnitude on personal income. Personal income soared a monthly 2.6 percent, following a 1.0 percent jump in November. The huge gain for December was due to special dividends that were paid by many companies late in the quarter in anticipation of changes in individual income tax rates, as well as some acceleration in wages and salaries. The wages and salaries component rose 0.6 percent, following a 0.9 percent boost in November. November was strong due to recovering from Hurricane Sandy.
According to the BEA, personal income in November and December was boosted by accelerated and special dividend payments to persons and by accelerated bonus payments and other irregular pay in private wages and salaries in anticipation of changes in individual income tax rates. Personal income in December was also boosted by lump-sum social security benefit payments. In October, personal income reflected work interruptions caused by Hurricane Sandy. Excluding these special factors, disposable personal income increased $44.1 billion, or 0.4 percent, in December, following an increase of $66.5 billion, or 0.6 percent, in November.
Personal spending was a little soft, coming in with a 0.2 percent rise after a 0.4 percent gain in November. Nondurables were negative while durables were strong. Nondurables were held down by gasoline while durables were supported by healthy motor vehicle sales.
Real PCEs rose 0.2 percent, following a 0.6 percent surge in November.
Turning to inflation, the headline PCE price index was flat in December after slipping 0.2 percent the prior month. Market expectations were for no change. The core rate in December was unchanged in both December and November.
Year-on-year, headline prices were up 1.3 percent in December versus 1.4 percent in November. The core was up 1.4 percent, following 1.5 percent the month before.
The latest personal income report is messy with special factors, including price effects. But on average over the last two months—after discounting special factors—both income and spending have been moderately healthy. However, at the headline level, look for pullback in January numbers. Analysis of the January report also will require some discounting of special factors and averaging.
 The Conference Board’s and the Reuters/University of Michigan measures of the consumer mood headed in opposite directions in January. The Conference Board’s and the Reuters/University of Michigan measures of the consumer mood headed in opposite directions in January.
According to the Conference Board measure, consumer confidence was down a surprising 8.1 points in January to 58.6. This is the lowest level since the debt limit fiasco of 2011, and though risk of a similar fiasco this year seems to be easing, concern over another impasse may still be weighing, at least slightly, on the consumer.
The consumer's assessment of the jobs market was unfavorable for January, belying what was really strong improvement in weekly jobless claims. Those saying jobs are currently hard to get rose a sizable 1.6 percentage points to 37.7 percent. Moving once again to the outlook, there was a steep decline, down 3.6 percentage points to a very small 14.3 percent, for those who see more jobs opening up six months from now.
According to the Reuters/University of Michigan measure, consumer sentiment has really picked up the last two weeks, at 73.8 for the final January reading versus 71.3 at mid-month. The reading implies that sentiment is a bit over 75 for the second half of the month, which is off from the low 80s in October and November but is otherwise back in trend.
Current conditions were little changed from mid-month at 85.0 with the improvement centered in expectations, at 66.6 for the final reading versus 62.7 at mid-month. This reading conflicts with the consumer confidence report posted where income expectations were being depressed by the paycheck tax hike.
Readings on the consumer's plight are mixed but the recent dip may have been temporary with spirits perhaps already bouncing back. While the jobs picture is slowly improving by some measures, the consumer still will be watching and evaluating the impact of the rise in payroll taxes not to mention higher gas prices.
 Manufacturing may be regaining momentum. While civilian aircraft added huge lift to December durables orders, gains were broad based. New factory orders for durables in December jumped a monthly 4.6 percent, following a boost of 0.7 percent in November. The transportation component spiked 11.9 percent after a 0.5 percent dip in November. Excluding transportation, durables orders increased 1.3 percent, following a rise of 1.2 percent in November. Manufacturing may be regaining momentum. While civilian aircraft added huge lift to December durables orders, gains were broad based. New factory orders for durables in December jumped a monthly 4.6 percent, following a boost of 0.7 percent in November. The transportation component spiked 11.9 percent after a 0.5 percent dip in November. Excluding transportation, durables orders increased 1.3 percent, following a rise of 1.2 percent in November.
Outside of transportation, component increases were led by primarily metals, up 3.6 percent, and computers & electronics, up 3.3 percent. Also rising were fabricated metals, machinery, and "other." The only negative component was electrical equipment, down 2.4 percent.
Nondefense capital goods orders rebounded 3.8 percent in December after a 2.4 percent drop the prior month. But the improvement was mostly civilian aircraft (Boeing), up a monthly 34.7 percent. Core investment orders in the private sector were sluggish as nondefense capital goods orders excluding aircraft edged up 0.2 percent in December, following a 3.0 percent boost the month before. Core investment orders likely were held back by uncertainty over fiscal cliff issues.
Overall, manufacturing is doing better than suggested by some recent surveys. And there is upside potential for equipment investment if remaining fiscal cliff issues are resolved soon.
 National manufacturing surveys continue to show somewhat greater strength than most regional surveys. Growth for the final manufacturing PMI for January edged back but only very slightly from mid-month, to a final 55.8 from the flash reading of 56.1. The 55.8 reading is well above 50 to indicate sizable month-to-month growth and is above December's reading of 54.0 to indicate a faster rate of monthly growth. National manufacturing surveys continue to show somewhat greater strength than most regional surveys. Growth for the final manufacturing PMI for January edged back but only very slightly from mid-month, to a final 55.8 from the flash reading of 56.1. The 55.8 reading is well above 50 to indicate sizable month-to-month growth and is above December's reading of 54.0 to indicate a faster rate of monthly growth.
There was very little change between this month's flash and final reports. Growth in new orders and output both remained very strong though both slipped fractionally from mid-month, ending January at 57.4 for new orders and at 56.8 for output. Employment growth is solid and unchanged from mid-month at 55.6. A special positive in the latest report is a build in backlog orders, which rose eight tenths from the flash reading to 50.3.
Growth is now appearing in the ISM manufacturing sample with the PMI at 53.1 for the best rate of monthly growth since May. Growth was very convincing with all five components of the composite over 50.
The new orders index is key and it was up, 3.6 points higher to 53.3. Employment was up more than two points to 54.0 which is a solid growth rate for this index. Inventories were up in a special sign that manufacturers are upbeat on the outlook.
Overall, signs are that manufacturing is regaining momentum. And the latest regional survey is showing improvement.
 Business in January was very strong for the Chicago area judging by the Chicago PMI which surged 5.6 points to 55.6. December's revised reading at 50.0 indicates no change in conditions that month and was in line with a long run of flat readings going back to September. Business in January was very strong for the Chicago area judging by the Chicago PMI which surged 5.6 points to 55.6. December's revised reading at 50.0 indicates no change in conditions that month and was in line with a long run of flat readings going back to September.
New orders highlight the details, surging 7.8 points to 58.2 which was the strongest rate of monthly growth since March. Production was up 8.5 points to 60.9, also the strongest since March. Businesses in the area, after running down their inventories late in the year, restocked aggressively in the month in what may be, however, a one-time build tied to pent-up need.
Perhaps the biggest reading in the report was employment, up 11.2 points to 58.0, which showed the fastest rate of labor expansion since June. A double-digit gain in this index is very rare and points to improvement in the overall economy.
 Limited supply of homes for sale is increasingly taking the steam out of the housing market. Pending sales of existing homes fell 4.3 percent in December to pull the year-ago comparison, which had been trending in the double digits, down to plus 6.9 percent. Limited supply of homes for sale is increasingly taking the steam out of the housing market. Pending sales of existing homes fell 4.3 percent in December to pull the year-ago comparison, which had been trending in the double digits, down to plus 6.9 percent.
Regional data showed wide declines especially in the West where the National Association of Realtors is stressing that a lack of supply of homes below $100,000 is a special factor constraining sales.
The December results point to a bumpy path for home sales going into this year. But the good news is that if prices continue to rise, supply will increase and allow for stronger sales.
 Home prices are steadily rising, up 0.6 percent in November for S&P Case-Shiller's adjusted composite index of 20 major cities. Monthly growth rates have been trending in the 1/2 percent range for this report, which is down a bit from last spring but still near the best of the recovery. The year-on-year rate, moving above 5 percent, is now above rates during the stimulus of 2010 and is the highest since the bubble days of 2006. Monthly gains sweep nearly every city led by San Francisco and other West Coast spots. Atlanta and Minneapolis also showed stand-out strength. Home prices are steadily rising, up 0.6 percent in November for S&P Case-Shiller's adjusted composite index of 20 major cities. Monthly growth rates have been trending in the 1/2 percent range for this report, which is down a bit from last spring but still near the best of the recovery. The year-on-year rate, moving above 5 percent, is now above rates during the stimulus of 2010 and is the highest since the bubble days of 2006. Monthly gains sweep nearly every city led by San Francisco and other West Coast spots. Atlanta and Minneapolis also showed stand-out strength.
Rising home prices should give a boost to the new home market, bringing in additional supply and boosting home equity which allows more existing homeowners to qualify for a new purchase. Higher home prices also boost consumer confidence.
 Construction posted a nice gain in December as construction spending jumped 0.9 percent, following a revised rise of 0.1 percent in November (originally down 0.3 percent). Analysts forecast a 0.8 percent boost. Construction posted a nice gain in December as construction spending jumped 0.9 percent, following a revised rise of 0.1 percent in November (originally down 0.3 percent). Analysts forecast a 0.8 percent boost.
The increase in December was led by a 2.2 percent gain in residential outlays after a 0.6 percent increase in November. Most of the latest improvement was from multifamily construction although single-family outlays also advanced. Public construction declined in the latest month.
On a year-ago basis, overall construction was up 7.8 percent in December versus 9.1 percent in November.
Construction continues to add to the recovery’s momentum. But a caveat is that large seasonal factors during winter months can cause sizeable swings in seasonally adjusted data.
 To no one’s surprise, the Fed left policy rates unchanged with the fed funds rate target at a range of zero to 0.25 percent. On the issue of quantitative easing, Fed is retaining its prior plan for QE4--that of $85 billion monthly asset purchases. And pay down on mortgage-backed securities and Treasuries will continue to be rolled over. The Fed sees the economy as having “paused” but largely due to special factors. To no one’s surprise, the Fed left policy rates unchanged with the fed funds rate target at a range of zero to 0.25 percent. On the issue of quantitative easing, Fed is retaining its prior plan for QE4--that of $85 billion monthly asset purchases. And pay down on mortgage-backed securities and Treasuries will continue to be rolled over. The Fed sees the economy as having “paused” but largely due to special factors.
The Fed’s guidance on how long policy rates will remain exceptionally low is complicated but was unchanged from the prior FOMC meeting. The Fed is focusing on whether the unemployment rate is still above 6.5 percent and whether inflation expectations remain low—that is, below 2.5 percent which is one-half percent above the Fed’s goal of 2 percent inflation.
The FOMC acknowledged recent weakness in the economy but pointed to special factors—“weather-related disruptions and other transitory factors.” Almost certainly the first is Hurricane Sandy and there is a good chance the second means concern about the then pending fiscal cliff issues at year’s end.
On detail on the economy, the Fed noted that employment has expanded at a moderate pace but the unemployment rate remains elevated. Positives were pointed to for household spending, business fixed investment, and housing. On inflation, the Fed stated that it has been running below the Fed’s long-term objective.
Importantly, the Fed is remaining calm and is cautiously optimistic about economic growth.
�The Committee expects that, with appropriate policy accommodation, economic growth will proceed at a moderate pace and the unemployment rate will gradually decline toward levels the Committee judges consistent with its dual mandate.�
As caveat, the Fed said there still are downside risks, pointing to global financial markets.
Overall, the Fed was not rattled by the fourth-quarter GDP report and there are ample indications that Fed policy is going to remain loose for quite some time.
Fourth quarter GDP posted a surprising although mild decline. Importantly, a big part of the weakness was slower inventory growth—meaning there is upside potential from inventory rebuild. Also, most recent data suggest that overall growth is stronger, including employment, personal income, consumer sentiment, motor vehicle sales, construction spending, durables orders, and national manufacturing surveys.
The Chicago PMI last week showed unexpected strength across all sectors. This week’s ISM non-manufacturing survey will confirm—or not—strength outside of manufacturing. Consumer spending has been moderate and the consumer credit report will show how willing consumers are to buy on credit. Finally, global trade has been soft and markets may react favorably to gains in both exports and imports.
Factory orders in November were unchanged. Non-durable orders, where fuel components are classified, fell a sharp 0.6 percent for the steepest decline since June. On the plus side, durable orders rose a solid 0.8 percent which is one tenth higher than the advanced reading. Under durables, strength was in the key capital goods category which suggests businesses are optimistic on their outlooks. More recently, new factory orders for durables in December jumped a monthly 4.6 percent, following a revised boost of 0.7 percent in November.
Factory orders Consensus Forecast for December 12: +2.4 percent
Range: -0.3 to +2.9 percent
The composite index from the ISM non-manufacturing survey for December posted at 56.1 for a 1.4 point gain and the strongest rate of monthly growth since February. Business activity, which is an equivalent of a production index on the manufacturing side, showed especially strong growth rates at just over 60 as are new orders which are near 60. Employment gains are picking up for the best rates of gain since March. This report—which covers the services, construction, and mining sectors—points to what may be surprisingly healthy growth for the bulk of the nation's economy.
ISM non-manufacturing composite index Consensus Forecast for January 13: 55.1
Range: 53.4 to 56.5
Initial jobless claims for the January 26 week posted a big 38,000 increase to 368,000 in initial jobless claims. But a look at the four-week average, which helps smooth out big swings, does hint at slight improvement. The latest average of 352,000 is down about 7,000 from a month ago which points to a favorable January-to-December comparison. Continuing claims also moved higher, up 22,000 in data for the January 19 week to 3.197 million. Here the four-week average also points to improvement, at 3.192 million which is down about 30,000 from the month-ago comparison.
Jobless Claims Consensus Forecast for 2/2/13: 360,000
Range: 350,000 to 365,000
Nonfarm business productivity for the third quarter was revised up, consistent with the recent upward revision to third quarter GDP. Nonfarm business productivity rose an annualized 2.9 percent in the third quarter, compared to the initial estimate of a 1.9 percent gain and compared to a 1.9 percent gain in the second quarter. Unit labor costs were revised down to an annualized 1.9 percent decrease, compared to the original estimate of down 0.1 percent, and following a 0.5 percent decline in the second quarter.
Nonfarm Business Productivity Consensus Forecast for initial Q4 12: -1.3 percent annual rate
Range: -3.5 to +0.8 percent annual rate
Unit Labor Costs Consensus Forecast for initial Q4 12: +3.1 percent annual rate
Range: +1.0 to +5.8 percent annual rate
Consumer credit outstanding in November was bumped up by student loans, driving another big gain for consumer credit, up $16.0 billion in November versus a revised $14.1 billion increase in October. The non-revolving component of the total jumped $15.2 billion which is the fourth double-digit increase in a row and the eighth double-digit increase since November last year. The increase not only includes another big increase in student loans but also reflects strong vehicle sales. The revolving side of the picture, where credit-card debt is tracked, has been up and down and shows much less robust demand, with a modest gain of $0.8 billion in November. This was only the third increase for revolving credit of the last eight months.
Consumer credit Consensus Forecast for December 12: +$14.5 billion
Range: +$9.0 billion to +$20.0 billion
The U.S. international trade gap in November widened sharply even as exports gained. Imports surged with new iPhones playing a key role. The trade deficit expanded to $48.7 billion from $42.1 billion in October. Exports rebounded 1.0 percent, following a 3.5 percent drop in October. Imports rebounded 3.8 percent in November, following a 2.1 percent decline the prior month. The worsening in the trade gap was led by the goods balance that excludes petroleum which grew to a $41.5 billion shortfall versus $33.8 billion in October. The services surplus slipped marginally but rounded to $17.0 billion in both November and October. The petroleum deficit actually shrank to $23.5 billion from $24.6 billion in October.
International trade balance Consensus Forecast for December 12: -$46.0 billion
Range: -$48.5 billion to -$43.3 billion
Wholesale inventories in November jumped 0.6 percent but were outpaced by a 2.3 percent surge in sales. This combination led to the stock-to-sales ratio dipping two notches to 1.19. All sales components showed gains in the month. In light of the strong sales, wholesale inventories appear to be too low.
Wholesale inventories Consensus Forecast for December 12: +0.4 percent
Range: +0.2 to +0.6 percent
R. Mark Rogers is the author of The Complete Idiot’s Guide to Economic Indicators, Penguin Books.
Econoday Senior Writer Mark Pender contributed to this article.
|
