|
Much of this week’s housing news reflected sizeable swings over the last two months—as is common during the off season. But downgrades to earnings expectations appear to have been premature as profits and revenues generally are topping lowered forecasts. There are key exceptions, however, on the downside.
 In a shortened trading week for Monday's Martin Luther King, Jr. Day, equities generally posted net weekly gains for the fourth week in a row. The week got off to a good start on Tuesday due to better than anticipated earnings and on indications that Republican leaders in the U.S. House of Representatives planned to pass a nearly four-month extension of the U.S. debt limit. These outweighed slippage in December existing home sales but from a relatively strong pace in November. On Wednesday, equities gained on news after Tuesday's close of stronger-than-expected profits for IBM and Google. Also, the economic news was favorable with a notable gain in the FHFA home price index. Also, helping to lift stocks, the U.S. House of Representatives actually did pass a plan to suspend the country's debt ceiling until May 19th with Senate and presidential approval expected early this coming week. In a shortened trading week for Monday's Martin Luther King, Jr. Day, equities generally posted net weekly gains for the fourth week in a row. The week got off to a good start on Tuesday due to better than anticipated earnings and on indications that Republican leaders in the U.S. House of Representatives planned to pass a nearly four-month extension of the U.S. debt limit. These outweighed slippage in December existing home sales but from a relatively strong pace in November. On Wednesday, equities gained on news after Tuesday's close of stronger-than-expected profits for IBM and Google. Also, the economic news was favorable with a notable gain in the FHFA home price index. Also, helping to lift stocks, the U.S. House of Representatives actually did pass a plan to suspend the country's debt ceiling until May 19th with Senate and presidential approval expected early this coming week.
 Equities were mixed Thursday even on an unexpected and large drop in initial jobless claims and a moderately healthy Markit flash PMI for U.S. manufacturing. Apple weighed the Nasdaq down on missed revenues and disappointing sales of iPhones. Equities gained notably at week’s end despite a drop in new home sales in December which followed a strong and upwardly revised November. The Friday gains were due to corporate earnings that topped expectations, notably for Proctor & Gamble and for Microsoft. Apple continued to decline, however, and slipped to second place behind Exxon Mobil as the world’s largest company in terms of market value. The bottom line is that economic news is somewhat volatile during winter months while earnings are topping expectations. Equities were mixed Thursday even on an unexpected and large drop in initial jobless claims and a moderately healthy Markit flash PMI for U.S. manufacturing. Apple weighed the Nasdaq down on missed revenues and disappointing sales of iPhones. Equities gained notably at week’s end despite a drop in new home sales in December which followed a strong and upwardly revised November. The Friday gains were due to corporate earnings that topped expectations, notably for Proctor & Gamble and for Microsoft. Apple continued to decline, however, and slipped to second place behind Exxon Mobil as the world’s largest company in terms of market value. The bottom line is that economic news is somewhat volatile during winter months while earnings are topping expectations.
Equities were up this past week. The Dow was up 1.8 percent; the S&P 500, up 1.1 percent; the Nasdaq, up 0.5 percent; the Russell 2000, up 1.4 percent; and the Wilshire 5000, up 1.3 percent.
For the year-to-date, major indexes are up as follows: the Dow, up 6.0 percent; the S&P 500, up 5.4 percent; the Nasdaq, up 4.3 percent; the Russell 2000, up 6.6 percent; and the Wilshire 5000, up 5.9 percent.
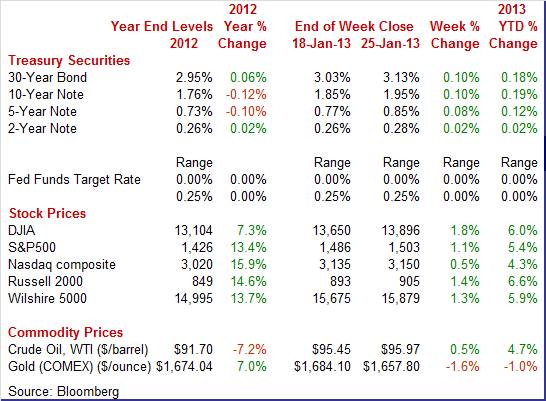
Weekly percent change column reflects percent changes for all components except interest rates. Interest rate changes are reflected in simple differences.
 Economic indicator news had next to no impact on Treasury yields this past week. But rates for the week were up moderately with the only notable move taking place Friday. Two factors came into play. Traders re-evaluated equities as a better bet as the S&P 500 topped the 1,500 mark. Also, yields rose on reversal of flight to safety on news from the European Central Bank that banks will repay €137.2 billion ($184.4 billion) of €489.2 billion outstanding in early repayment of the first 3-year Longer-Term Refinancing Operations, a total that topped median market expectations. Traders ignored the decline in new home sales for December as an aberration in the underlying trend for improvement in housing. Economic indicator news had next to no impact on Treasury yields this past week. But rates for the week were up moderately with the only notable move taking place Friday. Two factors came into play. Traders re-evaluated equities as a better bet as the S&P 500 topped the 1,500 mark. Also, yields rose on reversal of flight to safety on news from the European Central Bank that banks will repay €137.2 billion ($184.4 billion) of €489.2 billion outstanding in early repayment of the first 3-year Longer-Term Refinancing Operations, a total that topped median market expectations. Traders ignored the decline in new home sales for December as an aberration in the underlying trend for improvement in housing.
For this past week Treasury rates were up as follows: the 2-year note, up 2 basis points; the 5-year note, up 8 basis points; the 7-year note, up 9 basis points; the 10-year note, up 10 basis points; and the 30-year bond, up 10 basis points. The 3-month T-bill was unchanged.
Longer-term rates have firmed a little over some reversal of flight to safety and gradually increased concern that the Fed may end quantitative easing (focusing on purchases of longer-term maturity bonds) sooner than recently believed.
 It has become a gradual but steady trend. The spot price of West Texas Intermediate has risen seven weeks in a row. For this past week the net gain was not large but it added to the cumulative. The big daily swing was on Tuesday with a boost of about a buck and a quarter. This was due to a gain in German investor confidence. Prices slipped marginally on Wednesday and Thursday on temporary lowered capacity of the Seaway pipeline (running from Cushing, Oklahoma to the Gulf Coast). This led to supply backing up a bit at Cushing. Prices were essentially unchanged Friday. It has become a gradual but steady trend. The spot price of West Texas Intermediate has risen seven weeks in a row. For this past week the net gain was not large but it added to the cumulative. The big daily swing was on Tuesday with a boost of about a buck and a quarter. This was due to a gain in German investor confidence. Prices slipped marginally on Wednesday and Thursday on temporary lowered capacity of the Seaway pipeline (running from Cushing, Oklahoma to the Gulf Coast). This led to supply backing up a bit at Cushing. Prices were essentially unchanged Friday.
Net for the week, the spot price for West Texas Intermediate firmed 52 cents per barrel to settle at $95.97.
The focus this week was on housing. Progress was uneven during the off season for housing but the trend still appears to be up.
 Lack of homes for sale, especially at the low end, are holding down sales of existing homes which were down 1.0 percent in December, but followed a 4.8 percent surge in November. December’s annual rate of 4.94 million was still up 12.8 percent on a year-ago basis. Lack of homes for sale, especially at the low end, are holding down sales of existing homes which were down 1.0 percent in December, but followed a 4.8 percent surge in November. December’s annual rate of 4.94 million was still up 12.8 percent on a year-ago basis.
Supply was severely constrained at 4.4 months at the current sales rate versus 4.8 months in November and compared to 6.4 months in December 2011.
Low supply may be bad for sales but it is good for prices which rose 0.8 percent in the month to a median $180,800. The year-on-year gain in the median price, at 11.5 percent in December, trended in the low double digits through the fourth quarter.
But mortgage rates are definitely supporting sales. According to the Federal Home Loan Mortgage Corporation, rates on 30-year conventional loans averaged 3.35 percent in December. This is sharply lower than the roughly 6-1/2 percent seen during the height of the last housing bubble. The Fed’s Operation Twist (which ended in December) clearly had impact on lowering rates. The Fed’s QE4 is acting as a substitute for Operation Twist and is keeping downward pressure on rates.
 Home sales are showing typical volatility during off season months. A huge upward revision to November made for an unexpected and very outsized comparison with December. New home sales in December plunged 7.3 percent to an annual rate of 369,000. But this followed a spike the month before. November is now revised 22,000 higher for a 9.3 percent monthly surge to 398,000 which is by far the highest rate since the housing stimulus of April 2010. October was even revised upward, by 3,000 to 364,000. Home sales are showing typical volatility during off season months. A huge upward revision to November made for an unexpected and very outsized comparison with December. New home sales in December plunged 7.3 percent to an annual rate of 369,000. But this followed a spike the month before. November is now revised 22,000 higher for a 9.3 percent monthly surge to 398,000 which is by far the highest rate since the housing stimulus of April 2010. October was even revised upward, by 3,000 to 364,000.
Again, lower supply is appearing to be holding sales down. New homes were in short supply though December's adjusted number of homes on the market, at 151,000, was up 2,000 from November and up 4,000 from October. The fall in December's sales rate really brought up supply at the current sales rate, from a seven-year low of 4.5 months to 4.9 months which however is still lean.
The best news in the report, aside from November's revision, was prices which continued to move higher, up 1.3 percent to $248,900 for the highest median price in more than five years. The price data in this report are very volatile and are not based on repeat transactions which make them hard to read. But hard to read or not, year-on-year gains for both the median and average price percentage increases are in the mid-teens. This is good news for bringing in supply in coming months and adding to consumer wealth.
 The strongest sign that housing is posting a moderate recovery is the rise in home prices over the last year and a half. It is important that sales not just be up but that sales rise with prices up. Distressed sales do not reflect a healthy housing sector. The strongest sign that housing is posting a moderate recovery is the rise in home prices over the last year and a half. It is important that sales not just be up but that sales rise with prices up. Distressed sales do not reflect a healthy housing sector.
The latest Federal Housing Finance Agency (FHFA) price index gained 0.6 percent in November, matching the pace in October. Gains in the month were led by the Mountain region, surging 2.1 percent, with the East North Central lagging, down 1.0 percent.
The year-on-year rate of plus 5.6 percent is at its highest pace since the bubble days of 2006.
FHFA home prices have been on a moderate uptrend since mid-2011. This trend is helping the economy. Consumers are regaining housing wealth and higher prices eventually will add to supply. Many homeowners have been unwilling to put their house on the market at too low of a price.
Nonetheless, home prices still have a ways to go for full recovery. The November FHFA index level was still 15.2 percent below the high set in April 2007. FHFA prices are based on a specific segment of the housing market—home sales that are repeat transactions and are either financed by federal agencies or bundled by federal agencies.
Forget about the very weak readings so far this month in the regional manufacturing reports. The PMI manufacturing flash, which is a national index, improved to 56.1 this month from a final December reading of 54.0. The flash was well above 50 to indicate healthy monthly growth and was well over December to indicate an even faster rate of growth in general activity.
Details were mostly positive led by a three point jump in new orders which were at a very strong 57.7. Output showed similar strength and similar acceleration at 57.2 for a 2.7 point gain. Employment rose to 55.6 for a 1.1 point gain.
New export orders, at a plus 50 level of 51.3, do show monthly growth but at a slower pace than December's 52.6. Total backlog orders showed a slight contraction in the month.
A special sign of strength in the report comes from inventory data which show a build for raw materials and a slowing draw for finished goods. Manufacturers were drawing down their inventories going into year end, but today's data suggest that rebuilding may now be underway which underscores confidence in the economic outlook and points to further strength for output and employment.
Markit Economics' PMI report has been consistently showing greater strength than other survey reports and even some hard government data as well. The two exceptions for government data have been the Fed’s national industrial production and BLS’s production worker hours—which have shown comparable strength.
 Some regional Fed manufacturing reports continue to undershoot national numbers. Based on a number of Fed regional reports, the early outlook for the January manufacturing sector is decidedly negative. First the Empire State report, and then the Philly report, and this past week, the Richmond report along with the Kansas City report point to monthly contraction. Some regional Fed manufacturing reports continue to undershoot national numbers. Based on a number of Fed regional reports, the early outlook for the January manufacturing sector is decidedly negative. First the Empire State report, and then the Philly report, and this past week, the Richmond report along with the Kansas City report point to monthly contraction.
The Richmond District showed notable weakness for January, dropping to minus 12 for the overall manufacturing index from plus 5 in December.
New orders also were way down in the Richmond region to minus 17 versus plus 10 in December. Similarly, backlog orders dropped to minus 19 but had already stood at minus 11 in December. An absence of orders points to future weakness for shipments and employment.
 For the Kansas City Fed District, manufacturing activity contracted modestly again in January, but factories’ production expectations remained relatively optimistic for the months ahead. Many contacts blamed still-unresolved fiscal policy issues for caution in hiring and spending plans. For the Kansas City Fed District, manufacturing activity contracted modestly again in January, but factories’ production expectations remained relatively optimistic for the months ahead. Many contacts blamed still-unresolved fiscal policy issues for caution in hiring and spending plans.
The month-over-month composite index was minus 2 in January, largely unchanged from readings of minus 1 in December and minus 3 in November. Manufacturing activity declined at most durable goods-producing plants, while nondurable producers noted a slight increase overall. Most other month-over-month indexes were below zero but higher than in December.
The production index inched higher from minus 5 to minus 3, and the shipments, new orders, and order backlog indexes also rose somewhat but stayed in negative territory. In contrast, the employment index fell from minus 1 to minus 8, its lowest level since mid-2009, and the new orders for exports index also declined.
Future factory indexes were mixed, although most indexes remained at favorable levels. The future composite index was unchanged at 7, and the future shipments index also stayed flat from the previous month.
The latest number for the index of leading indicators looks very good at the headline. But the strong gain in December reflected both the special impact of Hurricane Sandy and moderate forward momentum in general.
 Seasonal distortions and distortions from Hurricane Sandy made for violent swings in jobless claims that are making for a bumpy ride in the index of leading economic indicators. The index was up a sharp 0.5 percent in December following a revised no change reading in November. But a fall in jobless claims from inflated November levels was by far the largest positive contributor—adding a 0.44 percentage point contribution in December, following a negative 0.36 in November. Though jobless claims are making for noise in this report, claims may very well prove to be a big plus for this report next month given the enormous improvement in claims over the last two weeks. Seasonal distortions and distortions from Hurricane Sandy made for violent swings in jobless claims that are making for a bumpy ride in the index of leading economic indicators. The index was up a sharp 0.5 percent in December following a revised no change reading in November. But a fall in jobless claims from inflated November levels was by far the largest positive contributor—adding a 0.44 percentage point contribution in December, following a negative 0.36 in November. Though jobless claims are making for noise in this report, claims may very well prove to be a big plus for this report next month given the enormous improvement in claims over the last two weeks.
The report's interest rate measure and credit measure were also positive with the latter hinting at a freeing up of credit. The stock market is another positive. On a technical note, the interest rate measure (the 10-year Treasury rate minus the fed funds rate) is the least positive in a while due to the Fed’s Operation Twist (bumping down long rates) and still some flight to safety. This component of the leading index almost certainly is underestimating its impact on pending economic growth. The differential measure of rates is based on the traditional view of the yield curve. When the Fed lowers short rates, this boosts the differential and the economy. This component does not take into account the Fed’s focus on bringing down long-term interest rates which is supporting the recovery—especially housing.
The reading on consumer expectations was December's largest negative which is likely to remain a negative given last week's soft consumer sentiment report and recently soft Bloomberg consumer comfort readings.
But overall, more factors than not are looking favorable. This includes building permits which were flat in the latest reading but which may begin picking up steam given rising home prices and very scarce supply of new homes for sale.
Finally, the coincident index posted a 0.2 percent rise, which indicates a respectable rate of ongoing growth, and a very strong 0.7 percent rate for the lagging index which points to stronger-than-expected growth in prior periods.
Housing sales have been volatile on a monthly basis but making net gains and likely remaining on an uptrend with price gains a notable positive. Manufacturing news has been mixed but with national data tending to be more positive than regional data.
This week is loaded with key news. The all-important employment situation for January hits Friday and could affect Fed thinking on quantitative easing in coming months. The first estimate for fourth quarter GDP indicates forward momentum as does personal income for the consumer sector. The Fed’s policy decision on Wednesday posts well before the employment report but will be heavily parsed for possible changes in policy. Key updates on manufacturing and housing also hit the wires.
Durable goods orders in November rose 0.8 percent in November, following a 1.1 percent gain in October. The very volatile transportation component was down slightly on aircraft subcomponents. Excluding transportation, orders increased 1.6 percent, following a boost of 1.8 percent in October. The transportation component fell 1.0 percent after a 0.6 percent dip in October. Weakness in the latest month was in subcomponents for nondefense aircraft, down 13.8 percent, and defense aircraft, down 12.3 percent. New orders for motor vehicles were up 2.8 percent. Outside of transportation, healthy gains were seen in primary metals, machinery, and electrical equipment. Computers & electronics saw a modest rise while “other” durables edged down. Numbers reflect revisions from the more recent total factory orders report.
New orders for durable goods Consensus Forecast for December 12: +1.6 percent
Range: -0.5 percent to +3.5 percent
New orders for durable goods, ex-trans., Consensus Forecast for December 12: +0.4 percent
Range: -2.5 percent to +2.4 percent
The pending home sales index for November rose a solid 1.6 points to 106.4. Aside from gains during the tax credit year of 2010, the current reading is the highest since the bubble days of 2007. Fewer distressed properties on the market and very low interest rates are boosting the sector. The latest index figures translate to a 1.7 percent rise in November, following a 5.0 percent jump the month before.
Pending home sales Consensus Forecast for December 12: -0.3 percent
Range: -1.5 to +2.5 percent
The Dallas Fed general business activity index in December emerged from negative territory, rising sharply to 6.8 as a result of a drop in the share of contacts reporting that conditions worsened. The production index, a key measure of state manufacturing conditions, rose from 1.7 to 2.7, which was consistent with slow growth-somewhat over the breakeven point of zero. However, the new orders index remained near zero, slipping from plus 0.4 in November to minus 0.9 in December.
Dallas Fed general business activity index Consensus Forecast for January 13: 4.0
Range: 3.0 to 8.0
The S&P/Case-Shiller 20-city home price index (SA) gained 0.7 percent in October, following a 0.4 percent increase the prior month. On an unadjusted basis the composite 20 index slipped 0.1 percent, following a 0.2 percent rise in September. On an unadjusted basis, demand typically eases in the autumn and winter months. On a year-ago basis, the unadjusted 20-city composite was up an improved 4.3 percent versus 3.0 percent in September. The bottom line is that the housing sector is gradually regaining health and homeowners are beginning to regain housing wealth lost over the past recession and early recovery months.
The S&P/Case-Shiller 20-city HPI (SA, m/m) Consensus Forecast for November 12: +0.7 percent
Range: +0.5 to +0.9 percent
The S&P/Case-Shiller 20-city HPI (NSA, m/m) Consensus Forecast for November 12: -0.1 percent
Range: -0.2 to +0.3 percent
The S&P/Case-Shiller 20-city HPI (NSA, y/y) Consensus Forecast for November 12: +5.8 percent
Range: +4.8 to +6.4 percent
The Conference Board's consumer confidence index in December fell 6.4 points this month to 65.1 with weakness centered in the expectations component which plunged nearly 15 points to 66.5. The assessment of the present situation actually was up, rising nearly 5-1/2 points to 62.8 which is by far the best reading of the recovery. And the assessment of the current jobs market was a highlight of the report with only 35.6 percent describing jobs as hard to get which is down sizably, nearly two percentage points from the prior month. More also describe current business conditions as good and fewer describe conditions as bad.
Consumer confidence Consensus Forecast for January 13: 65.1
Range: 61.6 to 70.0
ADP private payroll employment for December came in at an estimate of a 215,000 gain. This compared to the Bureau of Labor Statistics estimate in the employment report at up168,000.
ADP private payrolls Consensus Forecast for January 13: 172,000
Range: 140,000 to 235,000
GDP for its final estimate for the third quarter got a notable upgrade. Real GDP growth for the third quarter was revised up to 3.1 percent annualized, compared to the second estimate of 2.7 percent annualized and to the advance estimate of 2.0 percent. Demand figures also got a boost. Final sales of domestic product increased 2.4 percent versus the second estimate of 1.9 percent and second quarter growth of 1.7 percent. Final sales to domestic producers (which exclude net exports) were revised to 1.9 percent, compared to the second estimate of 1.7 percent and compared to the prior quarter's 1.4 percent. By components, the upward revision to GDP was primarily due to higher estimates for personal consumption, nonresidential fixed investment, exports, and government purchases. Imports were bumped down. Cutting into the upward revision were lower estimates for residential investment and inventory investment. Headline inflation for the GDP price index was left unrevised at an annualized 2.7 percent for the second estimate versus 1.6 percent in the second quarter. But when excluding food and energy, inflation pressure was not nearly as strong with the third quarter figure posting at 1.3 percent, matching the prior estimate of 1.3 percent and compared to the second quarter's 1.4 percent.
Real GDP Consensus Forecast for the advance estimate Q4 12: +1.0 percent annual rate
Range: +0.5 to +2.6 percent annual rate
GDP price index Consensus Forecast for the advance estimate Q4 12: +1.7 percent annual rate
Range: +1.0 to +2.5 percent annual rate
The FOMC announcement at 2:15 p.m. ET for the January 29-30 FOMC policy meeting is expected to leave policy rates unchanged. Traders will likely focus on any language in the statement on whether quantitative easing might end early. The Fed is paying more attention to unemployment currently than to inflation. So, comments on the labor market could move financial markets.
FOMC Consensus Forecast for 1/30/12 policy vote on fed funds target range: unchanged at a range of zero to 0.25 percent
Initial jobless claims for the January 19 week unexpectedly declined 5,000 to a pace of 330,000, hitting a five-year low. The four-week average was nearly at a five-year low, down a sizable 8,250 to 351,750 and is trending more 10,000 below the month-ago level. Continuing claims, at 3.157 million for a 71,000 decrease in the January 12 week, are at a 4-1/2 year low.
Jobless Claims Consensus Forecast for 1/26/13: 350,000
Range: 340,000 to 390,000
Personal income got some lift in November as businesses in the Northeast re-opened and employees returned to work after Hurricane Sandy. Personal income gained 0.6 percent in November, following a 0.1 percent increase in October. Importantly, the wages & salaries component rebounded 0.6 percent in November after decreasing 0.3 percent in October. Consumer spending rebounded 0.4 percent after slipping 0.1 percent in October. Turning to inflation, the headline PCE price index fell 0.2 percent in November after edging up 0.1 percent the month before. Looking ahead, private aggregate earnings jumped 0.7 percent in December, suggesting a significant rise in the private wages & salaries component in personal income. Personal spending may be moderate based on retail sales and unit new motor sales. PCE price inflation is likely to be soft December, reflected no change in the headline CPI and a modest 0.1 percent rise in the core CPI.
Personal income Consensus Forecast for December 12: +0.7 percent
Range: +0.4 to +1.5 percent
Personal consumption expenditures Consensus Forecast for December 12: +0.3 percent
Range: +0.1 to +0.5 percent
PCE price index Consensus Forecast for December 12: 0.0 percent
Range: 0.0 to +0.1 percent
Core PCE price index Consensus Forecast for December 12: +0.1 percent
Range: 0.0 to +0.2 percent
The employment cost index nudged down in the third quarter, posting at a quarterly 0.4 percent gain, following a 0.5 percent rise in the second quarter. Turning to components, wages & salaries softened to a 0.3 percent rise in the third quarter after a 0.4 percent gain the prior period. Benefits inflation worsened to a 0.8 percent increase, following a 0.6 percent rise in the second quarter.
Employment cost index Consensus Forecast for Q4 12: +0.5 percent
Range: +0.4 to +0.6 percent
The Chicago PMI in December came in at 51.6 for a 1.2 point gain from November to indicate accelerating growth in month-to-month business activity. But the employment index, down a huge 9.3 points to a sub-50 level of 45.9, was suddenly at its lowest point in three years. The contraction does follow three prior months of weakness in orders, but the approach of the fiscal cliff is definitely not a positive. The report includes commentary that a fiscal cliff hiring freeze may be on. Other readings in the report are solidly positive led by new orders which surged nearly 9 points to 54.0, in a gain that's a plus for future hiring.
Chicago PMI Consensus Forecast for January 13: 50.5
Range: 46.7 to 52.5
Sales of total light motor vehicles held strong in December at an annualized 15.4 million units versus 15.5 million units in November. Sales were helped in part by replacement needs from damage from Hurricane Sandy. Domestics posted at 12.0 million units—matching the November pace.
Motor vehicle domestic sales Consensus Forecast for January 13: 12.0 million-unit rate
Range: 11.7 to 12.1 million-unit rate
Motor vehicle total sales Consensus Forecast for January 13: 15.3 million-unit rate
Range: 14.8 to 15.5 million-unit rate
Nonfarm payroll employment gained 155,000 in December, following an increase of 161,000 in November and a rise of 137,000 in October. Private payrolls rose 168,000 in December after increasing 171,000 the prior month. Workers may be finally benefitting from moderate improvement in the labor market. Average hourly earnings increased 0.3 percent in December, following a 0.3 percent gain in November. The average workweek nudged up to 34.5 hours from 34.4 hours in November. Analysts projected 34.4 hours. Turning to the household survey, the unemployment rate actually rose almost one-tenth—but just not on a rounded basis. The more detailed rate was 7.849 percent in December (just missing being rounded up to 7.9 percent) versus 7.753 percent in November.
Nonfarm payrolls Consensus Forecast for January 13: 175,000
Range: 131,000 to 200,000
Private payrolls Consensus Forecast for January 13: 185,000
Range: 138,000 to 210,000
Unemployment rate Consensus Forecast for January 13: 7.7 percent
Range: 7.6 to 7.9 percent
Average workweek Consensus Forecast for January 13: 34.5 hours
Range: 34.4 to 34.5 hours
Average hourly earnings Consensus Forecast for January 13: +0.1 percent
Range: 0.0 to +0.3 percent
The Markit PMI manufacturing flash index for January improved to 56.1 from a final December reading of 54.0. The flash was well above 50 to indicate healthy monthly growth and was well over December to indicate an even faster rate of growth in general activity. Details were mostly positive led by a three point jump in new orders which were at a very strong 57.7. Output showed similar strength and similar acceleration at 57.2 for a 2.7 point gain. Employment rose to 55.6 for a 1.1 point gain.
Markit PMI manufacturing index (final) Consensus Forecast for January 13: 55.5
Range: 52.0 to 56.1
The Reuters/University of Michigan's consumer sentiment index mid-month reading of 71.3 was down 1.6 points from the full month reading for December and compares with a low 70s trend during the latter part of December. Expectations continued to slip, down 1.1 points to 62.7 which was the lowest reading for this component since the aftermath of the debt-ceiling battle in 2011. Current conditions, which had been holding up better than expectations, showed noticeable weakness, falling 3.7 points in December and another 2.2 points so far this month to 84.8.
Consumer sentiment index Consensus Forecast for final January 13: 71.5
Range: 70.7 to 75.9
The composite index from the ISM manufacturing survey in December improved to 50.7 from November's sub-50 reading of 49.5. New orders were flat and unchanged at 50.3 though new export orders were suddenly showing growth at 51.5 for the first plus 50 reading since May. Employment was a plus, up nearly 4.3 points to 52.7 for the best reading since June.
ISM manufacturing composite index Consensus Forecast for January 13: 50.7
Range: 49.3 to 52.0
Construction spending in November declined 0.3 percent, following a 0.7 percent gain the month before. The dip in November was led by a 0.7 percent drop in private nonresidential construction. Public construction decreased 0.4 percent in the latest month. On the upside, private residential outlays gained 0.4 percent in November, following a 1.3 percent jump the prior month. For the latest month, new one-family outlays gained 1.3 percent while new multifamily construction spending rose 0.5 percent. Outlays on private residential excluding new homes dipped 0.7 percent in November.
Construction spending Consensus Forecast for December 12: +0.8 percent
Range: +0.2 to +1.3 percent
R. Mark Rogers is the author of The Complete Idiot’s Guide to Economic Indicators, Penguin Books.
Econoday Senior Writer Mark Pender contributed to this article.
|
