|
There has been much talk about a stalling recovery and sluggishness in earnings. This past week showed notable gains in several sectors of the economy—the consumer, housing, and industrial production. Earnings have mostly been coming in ahead of expectations. And politicians in Washington have even been talking with each other about resolving the debt ceiling issue.
 Key indexes hit five-year highs at week’s close—including the Dow and S&P 500. The first three days of trading showed minor oscillations overall even though some company stocks drew attention. On Monday, Apple declined on market talk about weaker than expected demand for the iPhone 5. But the decline mostly was offset by Dell on word that the company may go private. Apple again dragged on markets Tuesday but was offset by favorable news on retail sales. Key indexes hit five-year highs at week’s close—including the Dow and S&P 500. The first three days of trading showed minor oscillations overall even though some company stocks drew attention. On Monday, Apple declined on market talk about weaker than expected demand for the iPhone 5. But the decline mostly was offset by Dell on word that the company may go private. Apple again dragged on markets Tuesday but was offset by favorable news on retail sales.
At mid-week, a drop in Boeing shares offset strong bank results and gains in technology stocks. Both Goldman Sachs and JPMorgan advanced after reporting earnings. Helping to support equities was a healthy report on industrial production. The Fed’s Beige Book was somewhat positive but as expected and had no surprises.
 Economic news lifted stocks significantly Thursday on a strong gain in housing starts and a sizeable drop in initial jobless claims. Equities rose further on Friday despite a dip in consumer sentiment. General Electric posted earnings and an outlook that topped expectations. Also, House Republicans announced that they would vote this coming week on a temporary increase in the debt ceiling. Economic news lifted stocks significantly Thursday on a strong gain in housing starts and a sizeable drop in initial jobless claims. Equities rose further on Friday despite a dip in consumer sentiment. General Electric posted earnings and an outlook that topped expectations. Also, House Republicans announced that they would vote this coming week on a temporary increase in the debt ceiling.
Equities were up this past week. The Dow was up 1.2 percent; the S&P 500, up 0.9 percent; the Nasdaq, up 0.3 percent; the Russell 2000, up 1.4 percent; and the Wilshire 5000, up 1.0 percent.
For the year-to-date, major indexes are up as follows: the Dow, up 4.2 percent; the S&P 500, up 4.2 percent; the Nasdaq, up 3.8 percent; the Russell 2000, up 5.1 percent; and the Wilshire 5000, up 4.5 percent.
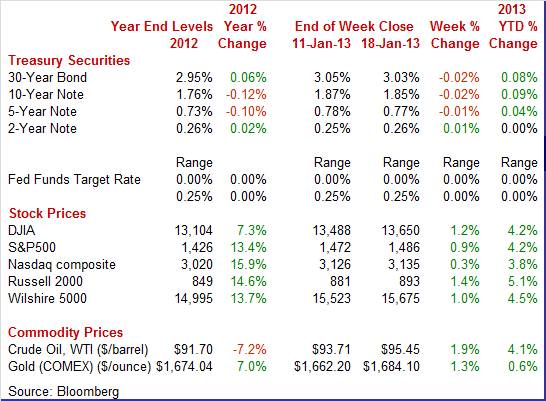
Weekly percent change column reflects percent changes for all components except interest rates. Interest rate changes are reflected in simple differences.
 It was a largely quiet week for Treasuries. Daily swings were modest at the most. The only noticeable swings were on Thursday and Friday. Yields firmed moderated Thursday on healthy housing starts and a sharp drop in initial jobless claims. FedSpeak by Atlanta Fed president Dennis Lockhart also contributed to the rise as he stated that he was concerned about the long-term impact of additional purchases by the Fed of mortgage-backed bonds and Treasuries. It was a largely quiet week for Treasuries. Daily swings were modest at the most. The only noticeable swings were on Thursday and Friday. Yields firmed moderated Thursday on healthy housing starts and a sharp drop in initial jobless claims. FedSpeak by Atlanta Fed president Dennis Lockhart also contributed to the rise as he stated that he was concerned about the long-term impact of additional purchases by the Fed of mortgage-backed bonds and Treasuries.
 Yields slipped Friday after a disappointing consumer sentiment report. Also, bond traders took a more pessimistic view of debt ceiling maneuvers—not liking the temporary nature of proposed legislation allegedly coming up for a vote this week. Word from House officials is that the debt ceiling would be raised for three months under proposed legislation and that a long-term solution would depend on spending cuts. Clearly, there is uncertainty on whether the Senate would agree on the temporary legislation. Yields slipped Friday after a disappointing consumer sentiment report. Also, bond traders took a more pessimistic view of debt ceiling maneuvers—not liking the temporary nature of proposed legislation allegedly coming up for a vote this week. Word from House officials is that the debt ceiling would be raised for three months under proposed legislation and that a long-term solution would depend on spending cuts. Clearly, there is uncertainty on whether the Senate would agree on the temporary legislation.
Rates were essentially little changed net for the week. For this past week Treasury rates up or down as follows: 3-month T-bill, up 1 basis point; the 2-year note, up 1 basis point; the 5-year note, down 1 basis point; the 7-year note, down 2 basis points; the 10-year note, down 2 basis points; and the 30-year bond, down 2 basis points.
However, longer-term rates have been firming due to increased traction for the U.S. recovery and over increased awareness that the Fed eventually will have to unwind its balance sheet by selling assets—including Treasuries.
 The spot price of West Texas Intermediate continued to rise this past week. Daily swings generally were marginal. The largest dip (though minimal) was on Tuesday and under a dollar a barrel. Crude slipped on a disappointing Empire State manufacturing survey and on worries about lack of progress on federal debt ceiling negotiations. The spot price of West Texas Intermediate continued to rise this past week. Daily swings generally were marginal. The largest dip (though minimal) was on Tuesday and under a dollar a barrel. Crude slipped on a disappointing Empire State manufacturing survey and on worries about lack of progress on federal debt ceiling negotiations.
The biggest gain was a little over a buck a barrel on Thursday on favorable economic reports on housing and jobless claims.
The bottom line is that oil prices have been on a notable uptrend since early December—rising from just under $86 per barrel to over $95.
Net for the week, the spot price for West Texas Intermediate gained $1.74 per barrel to settle at $95.45.
Economic news was mostly positive this past week. Importantly, the consumer is spending despite being in a sour mood.
 The results are in. Despite handwringing in advance about expectations of a disappointing holiday sales season, the numbers on average turned out to be healthy. According to the Commerce Department, consumer spending was moderately strong in December. Retail sales gained 0.5 percent after a 0.4 percent rebound the month before The results are in. Despite handwringing in advance about expectations of a disappointing holiday sales season, the numbers on average turned out to be healthy. According to the Commerce Department, consumer spending was moderately strong in December. Retail sales gained 0.5 percent after a 0.4 percent rebound the month before
In contrast to unit new motor vehicle sales, auto sales were up notably in the retail sales report—either due to differences in the survey sample or price changes. Motor vehicle sales were up 1.6 percent in December after a 2.7 percent boost the prior month.
 Ex-auto sales in December posted a 0.3 percent rise, following a 0.1 percent dip in November. But gasoline prices weighed down on gasoline station sales which declined 1.6 percent, following a 4.5 percent drop in November. Excluding both autos and gasoline components, sales advanced a healthy 0.6 percent, matching the prior month’s pace. Ex-auto sales in December posted a 0.3 percent rise, following a 0.1 percent dip in November. But gasoline prices weighed down on gasoline station sales which declined 1.6 percent, following a 4.5 percent drop in November. Excluding both autos and gasoline components, sales advanced a healthy 0.6 percent, matching the prior month’s pace.
Moderate strength in the core was broad based. Gains were led by furniture & home furnishings, food services & drinking places, and health & personal care. A decline was seen in electronics & appliance stores.
Overall, consumer spending was moderately healthy in December and likely will lead many economists to bump up their fourth quarter GDP forecast (which had been nudged down last week from a negative international trade report).
While consumers (at least those with jobs) are spending, consumers still are in a bad mood. Based on the Reuters/University of Michigan consumer sentiment index, the mood actually got moodier in mid-January.
 January's mid-month reading of 71.3 was down 1.6 points from the full month reading for December and compares with a low 70s trend during the latter part of December. Expectations continued to slip, down 1.1 points to 62.7 which was the lowest reading for this component since the aftermath of the debt-ceiling battle in 2011. January's mid-month reading of 71.3 was down 1.6 points from the full month reading for December and compares with a low 70s trend during the latter part of December. Expectations continued to slip, down 1.1 points to 62.7 which was the lowest reading for this component since the aftermath of the debt-ceiling battle in 2011.
 Current conditions, which had been holding up better than expectations, showed noticeable weakness, falling 3.7 points in December and another 2.2 points so far this month to 84.8. Current conditions, which had been holding up better than expectations, showed noticeable weakness, falling 3.7 points in December and another 2.2 points so far this month to 84.8.
Oil prices have been climbing and the consumer has noticed. One-year inflation expectations are up two tenths to 3.4 percent. The effect has yet to hit the five-year outlook which is unchanged at 2.9 percent.
The approach of the fiscal cliff on income tax rates depressed both consumer and business sentiment late last year. Now, previous and higher payroll taxes are kicking in after expiration of temporary rate cuts. And other fiscal cliff issues remain—with the debt ceiling looming immediately and federal spending cuts also on the horizon.
 Yes, it is important to know when to dig below an indicator’s headline number and this month’s industrial production report was a perfect example. Manufacturing in December was much better than suggested by the headline number for industrial production as utilities output was down sharply, making overall production look moderate. Industrial production in December advanced 0.3 percent, following a 1.0 percent rebound in November. The November spike was largely due to recovering from Hurricane Sandy. Yes, it is important to know when to dig below an indicator’s headline number and this month’s industrial production report was a perfect example. Manufacturing in December was much better than suggested by the headline number for industrial production as utilities output was down sharply, making overall production look moderate. Industrial production in December advanced 0.3 percent, following a 1.0 percent rebound in November. The November spike was largely due to recovering from Hurricane Sandy.
More importantly, in December, the manufacturing component jumped 0.8 percent, following an increase of 1.3 percent the prior month. Motor vehicle production was strong with a 2.6 percent rise after a 5.8 percent boost in November. But other industries were strong. Excluding motor vehicles, manufacturing output increased 0.7 percent after a 0.9 percent rebound in November.
 The auto industry has made a notable comeback since the recession. Light motor vehicles have trended upward from the recession low of 3.6 million annualized units in January 2009. The December 2012 pace hit 10.5 million units annualized. The auto recovery has been a relatively quiet but important part of helping the economy to improve. The auto industry has made a notable comeback since the recession. Light motor vehicles have trended upward from the recession low of 3.6 million annualized units in January 2009. The December 2012 pace hit 10.5 million units annualized. The auto recovery has been a relatively quiet but important part of helping the economy to improve.
Headline production was held down by utilities production as atypically warm weather lowered demand in December. The output of utilities dropped a monthly 4.8 percent in December, following a 0.2 percent rise in November. Production at mines gained 0.6 percent after a 0.3 percent advance in November.
Capacity utilization for total industry rose to 78.8 percent from 78.7 percent in November. Analysts forecast a rate of 78.5 percent.
The bottom line is that manufacturing is faring better than suggested by various manufacturing surveys. While gains are broad-based, auto production is playing a key role in the rebound in manufacturing.
 The first two Fed regional surveys in 2013 on manufacturing are not favorable and mildly in contraction territory. First, the Empire State general conditions index was little changed in the January reading, at minus 7.78 versus a revised minus 7.30 to indicate monthly contraction at a slightly deeper rate than December. The first two Fed regional surveys in 2013 on manufacturing are not favorable and mildly in contraction territory. First, the Empire State general conditions index was little changed in the January reading, at minus 7.78 versus a revised minus 7.30 to indicate monthly contraction at a slightly deeper rate than December.
Data on orders were especially soft. New orders were at minus 7.18 versus the prior month's minus 3.44. Unfilled orders posted at minus 7.53, compared to minus 6.45 in December to extend a long run of contraction. Other details show monthly contraction for shipments and employment as well as continuing destocking of inventories.
One positive in the report was a gain for the six-month outlook, optimism that belies weakness in current conditions.
 Next, the Philly Fed’s manufacturing index which showed a December's increase to be a one-month wonder. For January, this index was back in contraction at minus 5.8 versus December's revised plus 4.6. New orders swung back below zero to minus 4.3 which was the seventh negative reading of the last 10 months. Unfilled orders, at minus 1.0, were below zero for the ninth time in 10 months. Next, the Philly Fed’s manufacturing index which showed a December's increase to be a one-month wonder. For January, this index was back in contraction at minus 5.8 versus December's revised plus 4.6. New orders swung back below zero to minus 4.3 which was the seventh negative reading of the last 10 months. Unfilled orders, at minus 1.0, were below zero for the ninth time in 10 months.
There was one notable positive—the six-month outlook where optimism, despite current weakness, is building.
A notable point about recent Empire State and Philly Fed readings is that they have been more negative than national numbers. In contrast, Dallas and Richmond Fed data have been a little more in line with overall U.S. data. Kansas City Fed numbers have tended to be mildly negative recently. Overall, regional activity varies and which regions are close to the national trend will vary from time to time.
 Housing is still recovering and is at a moderate level of activity. But December starts suggest that recovery is moving somewhat faster than earlier believed. Housing starts in December rebounded a sharp 12.1 percent, following a dip of 4.3 percent the month before. The December starts pace of 0.954 million units was up 36.9 percent on a year-ago basis. Housing is still recovering and is at a moderate level of activity. But December starts suggest that recovery is moving somewhat faster than earlier believed. Housing starts in December rebounded a sharp 12.1 percent, following a dip of 4.3 percent the month before. The December starts pace of 0.954 million units was up 36.9 percent on a year-ago basis.
November was revised to 0.851 million units from the initial estimate of 0.861 million.
The jump in starts was led by the multifamily component although single-family starts also were up notably. Multifamily starts jumped 20.3 percent after a 6.3 percent decline in November. The single-family component gained 8.1 percent in December after decreasing 3.2 percent the prior month.
By region, starts in December were led up by the Midwest region which posted a monthly 24.7 percent jump in starts. Also rising were the Northeast, up 21.4 percent; the West, up 18.7 percent; and the South, up 3.8 percent.
 Forward momentum continues as housing permits gained 0.3 percent to an annual pace of 0.903 million units. Market expectations for housing permits for December were for 0.910 million units. Forward momentum continues as housing permits gained 0.3 percent to an annual pace of 0.903 million units. Market expectations for housing permits for December were for 0.910 million units.
Housing is adding to the recovery with moderately positive growth although still from relatively low levels of activity. A caveat about the numbers is that seasonal factors are large during winter months and this may be coming into play. Nonetheless, the gains in starts and permits are in line with the uptrend in home builder expectations as reflected in improvement in that National Association of Home Builders housing market index.
 Still lower energy costs in December kept the headline CPI soft. The consumer price index in December was unchanged after declining 0.3 percent in November. Excluding food and energy, the CPI edged up 0.1 percent, following a modest 0.1 percent rise in November. Still lower energy costs in December kept the headline CPI soft. The consumer price index in December was unchanged after declining 0.3 percent in November. Excluding food and energy, the CPI edged up 0.1 percent, following a modest 0.1 percent rise in November.
By major components, energy declined 1.2 percent after a drop of 4.1 percent in November. Gasoline decreased 2.3 percent after falling a monthly 7.4 percent in November. Food prices gained 0.2 percent in December, following an increase of 0.2 percent in November.
 Within the core, price pressure was led by airline fares, increasing a monthly 1.2 percent, and tobacco, gaining 0.5 percent. The shelter index rose a modest 0.1 percent as did medical care. In contrast to these increases, the recreation index declined in December, falling 0.2 percent. The index for household furnishings and operations also fell 0.2 percent, while the index for used cars and trucks declined 0.4 percent, its sixth consecutive decrease. The indexes for apparel and personal care both declined 0.1 percent in December. Within the core, price pressure was led by airline fares, increasing a monthly 1.2 percent, and tobacco, gaining 0.5 percent. The shelter index rose a modest 0.1 percent as did medical care. In contrast to these increases, the recreation index declined in December, falling 0.2 percent. The index for household furnishings and operations also fell 0.2 percent, while the index for used cars and trucks declined 0.4 percent, its sixth consecutive decrease. The indexes for apparel and personal care both declined 0.1 percent in December.
Year-on-year, overall CPI inflation softened to 1.7 percent in December, compared to 1.8 percent in November (seasonally adjusted). The core rate held steady at 1.9 percent in December. On an unadjusted year-ago basis, the headline CPI was up 1.7 percent, compared to 1.8 percent in November. The core was up 1.9 percent versus 1.9 percent in November, not seasonally adjusted.
The latest CPI report shows inflation constrained, leaving the Fed the option to focus on bringing down unemployment. However, recent gains in oil prices indicate that the headline CPI for January may not be so favorable.
 Energy, food, and capital goods pulled down on the PPI in December. The producer price index dipped 0.2 percent in December, following a 0.8 percent drop in in November. The core rate, which excludes both food and energy, rose 0.1 percent, following a rebound of 0.1 percent in November. Energy, food, and capital goods pulled down on the PPI in December. The producer price index dipped 0.2 percent in December, following a 0.8 percent drop in in November. The core rate, which excludes both food and energy, rose 0.1 percent, following a rebound of 0.1 percent in November.
 Food inflation posted at down 0.9 percent after jumping 1.3 percent in November. Over one-third of the December decrease can be traced to the index for beef and veal, which moved down 4.8 percent. Energy costs in December slipped 0.3 percent after a sharp monthly plunge of 4.6 percent in November. Gasoline declined 1.7 percent after falling 10.1 percent in November. Food inflation posted at down 0.9 percent after jumping 1.3 percent in November. Over one-third of the December decrease can be traced to the index for beef and veal, which moved down 4.8 percent. Energy costs in December slipped 0.3 percent after a sharp monthly plunge of 4.6 percent in November. Gasoline declined 1.7 percent after falling 10.1 percent in November.
Within the core, upward pressure was seen in passenger cars and tobacco. Partially offsetting were declines in computers and light trucks.
For the overall PPI, the year-ago rate in December posted at 1.3 percent versus 1.4 percent the month before (seasonally adjusted). The core rate was up 2.0 percent, compared to 2.2 percent in November. On a not seasonally adjusted basis for December, the year-ago headline PPI was up 1.3 percent, while the core was up 2.0 percent.
Depending on your interpretation of Fed word choice, the economy is improving according to today's Beige Book. Reports from the twelve Federal Reserve Districts indicated that economic activity has expanded since the previous Beige Book report, with all twelve Districts characterizing the pace of growth as either modest or moderate. The prior Beige Book emphasized growth "at a measured pace."
Since the previous Beige Book, activity in the New York and Philadelphia Districts rebounded from the immediate impacts of Hurricane Sandy. Growth in the Boston, Richmond, and Atlanta Districts appears to have increased slightly, while the St. Louis District reports some slowing.
All 12 districts reported some growth in consumer spending. Overall, holiday sales were reported as being modestly higher than in 2011, though sales were below expectations for contacts in many of the Districts. Auto sales were reported as steady or stronger in 10 Districts. But the apparently even consumers are concerned about fiscal cliff issues as reported by the Beige Book. Citing concerns that consumers will spend cautiously due to ongoing fiscal uncertainty, retail contacts and auto dealers reported a slightly dimmer, though positive, outlook for future sales.
Construction continues to be a modest positive. Since the previous Beige Book, real estate activity has expanded or held steady in 11 Districts for existing home sales and leasing; eight Districts for residential construction; 11 Districts for nonresidential sales and leasing; and nine Districts for nonresidential construction.
Trends in wages, prices, and employment conditions were relatively unchanged in the Federal Reserve Districts. Input price pressures were reported to be steady overall with mixed reports for specific commodity prices in various Districts. Employment conditions were also little changed since the last report. However, hiring plans were more cautious for firms doing business in Europe or in the defense sector.
Overall, the Beige Book likely leaves Fed policy unchanged—including for guidance. The economy is improving but with the caveat that consumers are actually paying attention to how politicians in Washington are addressing fiscal cliff issues. If anything, the Beige Book is more of a warning shot across the bow by consumers that fiscal cliff issues need to be resolved and without delay.
The economy at the end of 2012 turned out to be better than many had feared. While not meeting the definition of robust, growth still has improved and is broad based in sectors for the consumer, housing, and manufacturing. Inflation is modest—although rising energy costs puts that at risk. Meanwhile, the Fed appears to be prepared for continued loose policy while Washington argues over remaining fiscal cliff issues.
The emphasis this week is on housing. After last week’s healthy report on starts, we get updates on momentum from existing home sales, FHFA home prices, and new home sales. December manufacturing was strong according to the Fed monthly report. We get hints for January production from the Markit PMI flash manufacturing report and from the Richmond and Kansas City Feds.
U.S. Holiday, Martin Luther King, Jr. Day. All Markets Closed.
The Chicago Fed National Activity Index in November moved into the plus column to 0.10 from a revised minus 0.64 in October. But November got its bounce from a special event: the industrial sector's snapback from Hurricane Sandy's landfall in October. Components for employment as well as components for sales/orders/inventories moved from the positive side to the negative side in November. The negative pull from consumption and housing components eased.
Chicago Fed National Activity Index Consensus Forecast for December 12: 0.28
Range: 0.10 to 0.50
Existing home sales surged 5.9 percent in November to a 5.04 million annual rate and followed a 1.5 percent rise in October. Existing home sales were up 14.5 percent on a year ago basis, compared to 10.2 percent in October. Hurricane Sandy seems to have had no significant effect on sales where in the Northeast they surged 6.9 percent following a modest decline in October. Sales in the other three regions all showed gains for both November and October as well. Supply fell sharply, to 4.8 months at the current sales rate from 5.3 months in October which was already a multi-year low.
Existing home sales Consensus Forecast for December 12: 5.10 million-unit rate
Range: 4.95 to 5.20 million-unit rate
The Richmond Fed manufacturing index for December lost four points, settling at 5 from November's reading of 9. Among the index's components, shipments fell five points to 6, the gauge for new orders was almost unchanged at 10, and the jobs index turned negative, losing six points to minus 3. Looking forward, assessments of business prospects for the next six months were less optimistic in December as the index of expected shipments lost eight points, ending at a reading of 20, and the new orders index dropped 13 points to finish at 12.
Richmond Fed manufacturing index Consensus Forecast for January 13: 5
Range: 3 to 13
The FHFA purchase only house price index gained 0.5 percent in October after remaining virtually unchanged in September. On the year, the index was up 5.6 percent after increasing 4.1 percent the month before. Regionally prices continue to be mixed. For the nine census divisions, seasonally adjusted monthly price changes on the month ranged from minus 1.3 percent in the Middle Atlantic division to plus 2.0 percent in the Pacific division.
FHFA purchase only house price index Consensus Forecast for November 12: +0.7 percent
Range: +0.3 to +0.9 percent
Initial jobless claims in the January 12 week plunged 37,000 to 335,000 for a recovery low and massively below Econoday expectations for 368,000. Although there were no unusual factors skewing the latest data, seasonal adjustments played the biggest role of the year as claims before adjustments were at their highest point of the year. Effects from Hurricane Sandy continue to distort the monthly comparison of the four-week average which further clouds the data's usefulness as a gauge for the monthly employment report. The four-week average is down 6,750 to 359,250 which is about 10,000 below the mid-December level.
Jobless Claims Consensus Forecast for 1/19/13: 360,000
Range: 328,000 to 375,000
The Markit PMI manufacturing index (final) for December was a very solid 54.0, down two tenths from the flash reading but up a solid 1.2 points from November's 52.8. Any reading over 50 indicates monthly growth in general business activity with December's higher reading indicating a greater rate of growth than November. In fact, 54.0 is the strongest final reading since May.
Markit PMI manufacturing flash index Consensus Forecast for January 13: 54.0
Range: 52.0 to 55.3
The Conference Board's index of leading indicators showed an as-expected 0.2 percent decline in a November reading that was less than convincing. Components were very mixed. A jump in jobless claims was the chief negative in the month, one that was badly skewed by special factors and one in any case that has since been reversed. Overall durables orders for the month were moderately healthy. Housing was a positive in the latest report and is likely to be an increasing positive in future reports as the housing sector appears to be building some steam.
Leading indicators Consensus Forecast for December 12: +0.4 percent
Range: +0.2 to +0.7 percent
The Kansas City Fed manufacturing index declined further in December, though by a smaller amount than in October or November. The month-over-month composite index was minus 2 in December, up slightly from minus 6 in November and minus 4 in October. Manufacturing activity was stable at most durable goods producing plants, while nondurable producers cited further declines. Most other month-over-month indexes also edged up slightly in December but remained below zero. The production index inched higher from minus 6 to minus 5.
Kansas City Fed manufacturing index Consensus Forecast for January 13: +2
Range: -3 to +5
New home sales showed strength in November with sales up 4.4 percent to an annual rate of 377,000. October was revised 7,000 lower to 361,000, weakness largely offset by a 5,000 upward revision to September. New home sales, which started the year near 340,000, have slowly been building up momentum during 2012. Scarcity of supply was a big factor in the home sales market, at 4.7 months at the current sales rate for new homes versus 4.9 months in October.
New home sales Consensus Forecast for December 12: 388 thousand-unit annual rate
Range: 375 thousand to 406 thousand-unit annual rate
R. Mark Rogers is the author of The Complete Idiot’s Guide to Economic Indicators, Penguin Books.
Econoday Senior Writer Mark Pender contributed to this article.
|
