|
Economic news was limited this week. And apparently exhaustion has set in temporarily on addressing fiscal cliff issues (yes, the spending cut issues remain). Focus has largely been on corporate earnings with expectations generally lowered but making it easier to beat. But this coming week, indicator news picks up sharply.
 Despite a weak start, equities ended the week up for the second week in a row. On Monday, profit taking tugged down on stocks after the best weekly gain in more than a year. Boeing declined on news of a fire in a 787 Dreamliner operated by Japan Airlines at Boston’s Logan International Airport. On earnings nervousness, stocks declined Tuesday ahead of the first key earnings report—Alcoa, scheduled for after Tuesday’s close. Alcoa met expectations on earnings but topped on sales--and that was enough to put traders in a positive mood for Wednesday. Gains were broad-based at mid-week with modestly improved optimism about fourth quarter earnings. Despite a weak start, equities ended the week up for the second week in a row. On Monday, profit taking tugged down on stocks after the best weekly gain in more than a year. Boeing declined on news of a fire in a 787 Dreamliner operated by Japan Airlines at Boston’s Logan International Airport. On earnings nervousness, stocks declined Tuesday ahead of the first key earnings report—Alcoa, scheduled for after Tuesday’s close. Alcoa met expectations on earnings but topped on sales--and that was enough to put traders in a positive mood for Wednesday. Gains were broad-based at mid-week with modestly improved optimism about fourth quarter earnings.
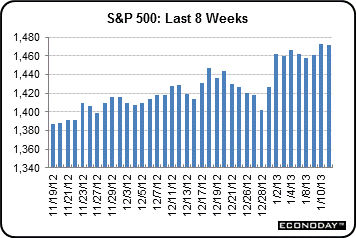 Equities rose sharply on Thursday despite a slight rise in initial jobless claim. Providing upward lift were stronger-than-expected Chinese exports. Equities were mostly little changed Friday as news of higher-than-expected Chinese inflation led traders to believe that stimulus in that country might be notched back. Equities rose sharply on Thursday despite a slight rise in initial jobless claim. Providing upward lift were stronger-than-expected Chinese exports. Equities were mostly little changed Friday as news of higher-than-expected Chinese inflation led traders to believe that stimulus in that country might be notched back.
Equities were up this past week. The Dow was up 0.4 percent; the S&P 500, up 0.4 percent; the Nasdaq, up 0.8 percent; the Russell 2000, up 0.2 percent; and the Wilshire 5000, up 0.5 percent.
For the year-to-date, major indexes are up as follows: the Dow, up 2.9 percent; the S&P 500, up 3.2 percent; the Nasdaq, up 3.5 percent; the Russell 2000, up 3.7 percent; and the Wilshire 5000, up 3.5 percent.

Weekly percent change column reflects percent changes for all components except interest rates. Interest rate changes are reflected in simple differences.
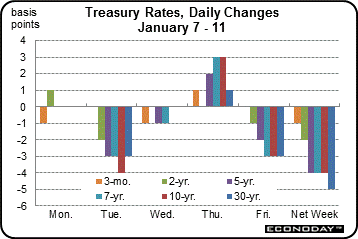 Rate movement was a little different this week relative to equities. For some time, generally when stocks have gone up, money has flowed out of bonds, boosting rates. This week, however, equities were up and Treasury yields were down—but very moderately. Rate movement was a little different this week relative to equities. For some time, generally when stocks have gone up, money has flowed out of bonds, boosting rates. This week, however, equities were up and Treasury yields were down—but very moderately.
After a flat Monday, yields eased as many traders took to the sidelines ahead of key corporate earnings reports. Rates were little changed at mid-week despite notable gains in equities.
But rates rose Thursday even though initial jobless claims nudged up. Positive news on the global economy came from overseas as the European Central Bank posted a more optimistic outlook and growth in China appeared to be improving, based on exports. Treasury rates dipped at week’s close simply because mid and longer-term yields were at their highest since mid-2012 and were attractive.
For this past week Treasury rates were down as follows: 3-month T-bill, down 1 basis point; the 2-year note, down 2 basis points; the 5-year note, down 4 basis points; the 7-year note, down 4 basis points; the 10-year note, down 4 basis points; and the 30-year bond, down 5 basis points.
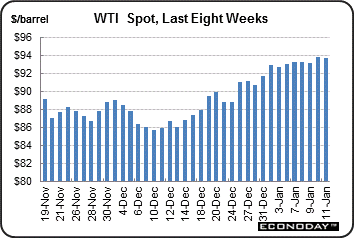 The spot price of crude continued an uptrend of recent weeks based on continued improvement in the U.S. economy, stabilization in Europe, and growth in Asia. But the latest weekly gain was extremely modest. The spot price of crude continued an uptrend of recent weeks based on continued improvement in the U.S. economy, stabilization in Europe, and growth in Asia. But the latest weekly gain was extremely modest.
Daily changes in prices were almost nonexistent. The largest daily swing was a “whopping” (tongue in cheek) 69 cents on Thursday. This gain was in reaction to strong export data from China.
Net for the week, the spot price for West Texas Intermediate firmed 62 cents per barrel to settle at $93.71.
The best news last week was on the inflation front as import prices were soft. Special factors affected the data for international trade and also for consumer credit.
 The U.S. trade balance in November widened sharply even as exports gained. Imports surged with new iPhones playing a key role. The trade deficit expanded to $48.7 billion from $42.1 billion in October. Exports rebounded 1.0 percent, following a 3.5 percent drop in October. Imports rebounded 3.8 percent in November, following a 2.1 percent decline the prior month. The U.S. trade balance in November widened sharply even as exports gained. Imports surged with new iPhones playing a key role. The trade deficit expanded to $48.7 billion from $42.1 billion in October. Exports rebounded 1.0 percent, following a 3.5 percent drop in October. Imports rebounded 3.8 percent in November, following a 2.1 percent decline the prior month.
The worsening in the trade gap was led by the balance that excludes petroleum which grew to a $41.5 billion shortfall versus $33.8 billion in October. Key gains in imports in this category were in cell phones, pharmaceuticals, and autos. Nonpetroleum exports were up, led by telecommunications, machines, aircraft, autos, and nonmonetary gold.
 The services surplus slipped marginally but rounded to $17.0 billion in both November and October. The petroleum deficit actually shrank to $23.5 billion from $24.6 billion in October. The services surplus slipped marginally but rounded to $17.0 billion in both November and October. The petroleum deficit actually shrank to $23.5 billion from $24.6 billion in October.
The November spike in the trade deficit was a one-time event, largely related to iPhone sales. Spikes in imports usually are related to a surge in oil prices. The degree of this non-petroleum worsening is not likely to continue but it will cut into GDP growth estimates for the fourth quarter.
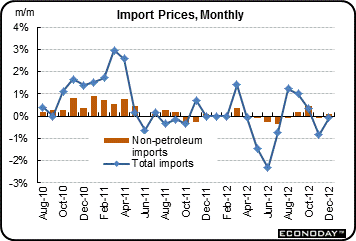 Import prices continue to remain very soft, down 0.1 percent in December for a minus 1.5 percent year-on-year rate. Petroleum prices, down 0.8 percent on the month, pulled the year-on-year rate into the minus column for the seventh time in the last eight months. Petroleum prices are down 7.1 percent year-on-year. Import prices continue to remain very soft, down 0.1 percent in December for a minus 1.5 percent year-on-year rate. Petroleum prices, down 0.8 percent on the month, pulled the year-on-year rate into the minus column for the seventh time in the last eight months. Petroleum prices are down 7.1 percent year-on-year.
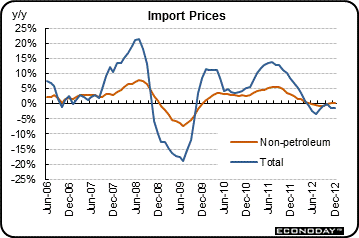 But it's more than just petroleum prices that are soft. Prices for imported finished goods remain dormant, down 0.2 percent for a second month for capital goods and down 0.1 percent for a second month for consumer goods. Year-on-year, capital goods prices are unchanged with consumer prices down 0.1 percent. Though unchanged on the month, vehicle imports are showing some pressure with a 1.9 percent year-on-year rate. But it's more than just petroleum prices that are soft. Prices for imported finished goods remain dormant, down 0.2 percent for a second month for capital goods and down 0.1 percent for a second month for consumer goods. Year-on-year, capital goods prices are unchanged with consumer prices down 0.1 percent. Though unchanged on the month, vehicle imports are showing some pressure with a 1.9 percent year-on-year rate.
The export side is more of the same with total prices down 0.1 percent following a 0.7 percent decline in the prior month. The year-on-year rate is plus 1.1 percent. Here, agricultural prices are pivotal, up 0.1 percent on the month for a year-on-year rate that, reflecting drought effects, does show pressure at plus 12.8 percent. But prices for exported finished goods tell the same story as on the import side -- marginal pressure at the very most.
Looking ahead, however, crude oil prices and gasoline prices have been rising in January. We likely will see favorable CPI numbers in December but not in January.
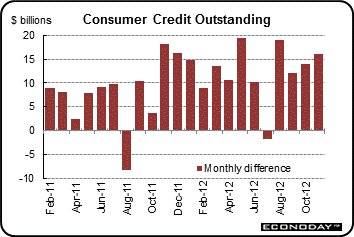 The jobs market is hard and students are borrowing to stay in school. Student loans drove another big gain for consumer credit, up $16.0 billion in November versus a revised $14.1 billion increase in October. The non-revolving component of the total jumped $15.2 billion which is the fourth double-digit increase in a row and the eighth double-digit increase since November last year. The increase includes another big increase in student loans and also reflects strong vehicle sales. The jobs market is hard and students are borrowing to stay in school. Student loans drove another big gain for consumer credit, up $16.0 billion in November versus a revised $14.1 billion increase in October. The non-revolving component of the total jumped $15.2 billion which is the fourth double-digit increase in a row and the eighth double-digit increase since November last year. The increase includes another big increase in student loans and also reflects strong vehicle sales.
The revolving side of the picture, where credit-card debt is tracked, has been up and down and shows much less robust demand, with a modest gain of $0.8 billion in November. This is only the third increase for revolving credit of the last eight months. At this point, consumers are still somewhat reluctant to spend with credit cards.
The economy was basically on cruise control this past week in terms of economic indicators—though special factors needed extra attention. On the earnings front, revenues and profits mostly topped lowered expectations.
A host of Fed speakers are in the spotlight this week including Fed chairman Bernanke on Monday night. With a FOMC meeting just two weeks away, Fed watchers will parse participants’ words carefully. The debate on the strength of holiday sales will be answered with the release of December retail sales data. Manufacturing health is expected to improve given the latest employment numbers on hours worked. The December housing starts report will confirm whether homebuilders really are increasingly optimistic as ancillary data have indicated.
The producer price index in November dropped 0.8 percent after falling 0.2 percent in October. This was largely due to lower energy costs. The core rate, which excludes both food and energy, rebounded a modest 0.1 percent, following a decline of 0.2 percent in October. Food inflation jumped 1.3 percent after rising 0.4 percent in October. Energy costs at the producer level dropped a sharp monthly 4.6 percent in November, following a 0.5 percent rise the prior month. Gasoline declined 10.1 percent, following a decrease of 2.2 percent in October. Within the core, higher prices for passenger cars and light trucks led the November gain, increasing 0.5 percent and 0.2 percent, respectively.
PPI Consensus Forecast for December 12: -0.1 percent
Range: -0.8 to +0.4 percent
PPI ex food & energy Consensus Forecast for December 12: +0.2 percent
Range: 0.0 to +0.2 percent
Retail sales made a moderate comeback in November despite a drop in gasoline prices. Total retail sales in November rebounded 0.3 percent, following a 0.3 percent decline the prior month. Motor vehicle sales rebounded 1.4 percent after a 1.9 percent decrease in October. Ex-auto sales were unchanged, following a flat figure for October. Gasoline sales dropped 4.0 percent in November, following a 1.0 percent rise the prior month. Excluding both autos and gasoline components, sales gained a healthy 0.7 percent, following a 0.1 percent decline in October.
Retail sales Consensus Forecast for December 12: +0.2 percent
Range: 0.0 to +0.8 percent
Retail sales excluding motor vehicles Consensus Forecast for December 12: +0.3 percent
Range: 0.0 to +1.1 percent
Less motor vehicles & gasoline Consensus Forecast for December 12: +0.5 percent
Range: +0.2 to +1.4 percent
The Empire State manufacturing index fell to minus 8.10 for the December reading versus minus 5.22 and minus 6.16 in the prior two months. This report has shown no impact from the landfall of Hurricane Sandy or the aftermath. The report for December was filled with negatives that included contraction for new orders, unfilled orders, and employment. The 12-month outlook was still positive but was far from robust.
Empire State Manufacturing Survey Consensus Forecast for January 13: 0.00
Range: -5.00 to 9.50
Business inventories rose 0.4 percent in October for the lowest rise since June. Business sales, however, fell 0.4 percent to end three straight months of gains. The mismatch pushed the stock-to-sales ratio to 1.29 versus September's 1.28. Nonetheless, the inventory-to-sales ratio is still low and businesses will not require much adjustment to stocks on the shelves. And early evidence is that sales are healthy and will take care of backroom shelves. More recently, factory inventories were unchanged for November.
Business inventories Consensus Forecast for November 12: +0.3 percent
Range: +0.1 to +0.5 percent
The consumer price index dropped in November on lower energy costs and the core rate softened. The consumer price index in November fell 0.3 percent, following a 0.1 percent increase the month before. Excluding food and energy, the CPI rose 0.1 percent, following a boost of 0.2 percent in October. By major components, energy fell a monthly 4.1 percent after dipping 0.2 percent in October. Gasoline dropped a monthly 7.4 percent in November, following a decline of 0.6 percent the prior month. Food prices increased 0.2 percent, matching the pace in October. Within the core, softness was led by declines in prices for apparel and also used cars & trucks.
CPI Consensus Forecast for December 12: 0.0 percent
Range: -0.1 to +0.3 percent
CPI ex food & energy Consensus Forecast for December 12: +0.1 percent
Range: +0.1 to +0.2 percent
Industrial production rebounded in November with notable help from recovering from Hurricane Sandy and a boost in auto assemblies. Industrial production rebounded 1.1 percent, following a decline of 0.7 percent in October. In November, the manufacturing component increased 1.1 percent after dropping 1.0 percent in October. According to the Fed, nearly all the decline in factory output in October was estimated to have been related to Hurricane Sandy, and the increase in November reflected a post-hurricane rebound in production as well as the solid advance in the output of motor vehicles and parts. Within manufacturing, increases were widespread in November across both durable and nondurable goods industries. The bright spot in manufacturing for November was motor vehicles & parts, which jumped 4.5 percent after no change the month before. Excluding motor vehicles, manufacturing output rebounded 0.8 percent after a 1.0 percent drop in October. Capacity utilization for total industry rose to 78.4 percent from 77.7 percent in October. More recently, production worker hours in manufacturing increased 0.4 percent, indicating a likely notable gain in the manufacturing component of industrial production for December.
Industrial production Consensus Forecast for December 12: +0.2 percent
Range: -0.1 to +0.6 percent
Manufacturing production component Consensus Forecast for December 12: +0.4 percent
Range: +0.3 to +0.6 percent
Capacity utilization Consensus Forecast for December 12: 78.5 percent
Range: 78.3 to 78.9 percent
NAHB housing market index made a two point gain in December to 47. This index is up now for eight months in a row and is approaching the breakeven 50 level. A reading over 50 would indicate that more builders describe conditions as good than bad. Two components are now actually over 50 with present sales and six-month sales both at 51. The lagging component is traffic which is still on the sub-50 side at 36. But the report notes a positive about traffic, saying "more serious buyers" are coming forward.
NAHB housing market index Consensus Forecast for January 13: 48
Range: 46 to 50
The Beige Book prepared for the January 29-30 meeting will be released. With the Fed having switched guidance to an indicator basis of the labor market and inflation, more attention will likely be given to news on the employment front.
Housing starts in November declined 3.0 percent, following an increase of 5.3 percent in October and a jump of 12.4 percent in September. The November starts pace of 0.861 million units was up 21.6 percent on a year-ago basis. October was revised to 0.888 million units from the initial estimate of 0.894 million. September was bumped down to 0.843 million annualized units from the prior estimate of 0.863 units. The latest decrease in starts was led by the single-family component while the multifamily component edged down. Home builders still are moderately optimistic about future sales as housing permits rose 3.6 percent to an annual pace of 0.899 million units.
Housing starts Consensus Forecast for December 12: 0.887 million-unit rate
Range: 0.865 million to 0.920 million-unit rate
Housing permits Consensus Forecast for December 12: 0.910 million-unit rate
Range: 0.870 million to 0.945 million-unit rate
Initial jobless claims rose a modest 4,000 for a second week to 371,000 versus a revised 367,000 in the prior week. After swinging severely due to Hurricane Sandy as well as holiday factors, the four-week average may be settling down, up 6,750 to 365,750. This level was down more than 15,000 from early December, but making a comparison is iffy given a very strong storm effect in the month-ago average.
Jobless Claims Consensus Forecast for 1/12/13: 368,000
Range: 345,000 to 385,000
The general business conditions index of the Philadelphia Fed's Business Outlook Survey in December popped back into expansion at 8.1 versus November's minus 10.7. New orders were at plus 10.7, up from minus 4.6 in November and only the third positive reading since April. Unfilled orders were also in positive ground, at plus 2.3 from minus 4.6 in November for the first gain since April.
Philadelphia Fed survey Consensus Forecast for January 13: 6.0
Range: 2.0 to 14.5
The Reuter's/University of Michigan's consumer sentiment index was down nearly 10 points in December to 72.9 versus November's final reading of 82.7. A look at the two-week breakdowns pointed to an even lower 70s reading in the second half of December, which was consistent with fiscal-cliff concerns. Weakness was centered in the expectations index which ended December at 63.8 for a nearly 15 point decline from November. Current conditions were also down but less severely, at 87 for only a 3.7 point loss for the month.
Consumer sentiment Consensus Forecast for preliminary January 12: 75.0
Range: 72.5 to 84.0
R. Mark Rogers is the author of The Complete Idiot’s Guide to Economic Indicators, Penguin Books.
Econoday Senior Writer Mark Pender contributed to this article.
|
