|
Investors were shaken the beginning of the week by the weak U.S. employment report and the results from the Greek and French elections that took place over the weekend. They continued to focus on Europe’s woes during the week as the political parties in Greece tried to form a government — so far to no avail. There were few new earnings reports to distract as the season winds down. There was only a sparse sprinkling of new reports to update investors on the health of the global economy as well. However, that changed when China unleashed its monthly slew of new economic data at week’s end that showed its economy is slowing. An announcement by JPMorgan that it has taken $2 billion in trading losses in the past six weeks stemming from bad derivatives bets sent equities lower on Friday for a time before better than anticipated U.S. consumer sentiment eased some of the pain.
The world has been watching as Greece attempts to form a new government without having to call a new election. The leader of the moderate Democratic Left party appeared to dash hopes for the formation of a coalition government, saying he would not back any coalition that supports the €130 billion EU/IMF bailout. The impasse raises the likelihood that a new general election will have to be held, probably on June 17.
Credit ratings agency Fitch warned that if Greece left the Eurozone it was "likely" to put the sovereign credit ratings of all euro member states on negative ratings watch. Cyprus, France, the Republic of Ireland, Italy, Portugal, Spain, Slovenia and Belgium are already on negative ratings watch and are most at risk of a Fitch credit downgrade if Greece exited the euro.
Francois Hollande defeated French President Nicolas Sarkozy to become the first Socialist in 17 years to control France. He has pledged to push for less austerity and more growth in the region. German Chancellor Angela Merkel said she will welcome Hollande in Germany with “open arms,” while rejecting government stimulus as the way to spur economic growth in Europe.
|
|
2011 |
2012 |
% Change |
|
Index |
Dec 30 |
May 4 |
May 11 |
Week |
Year |
| Asia/Pacific |
|
|
|
|
|
|
| Australia |
All Ordinaries |
4111 |
4459.4 |
4342.7 |
-2.6% |
5.6% |
| Japan |
Nikkei 225 |
8455.35 |
9380.3 |
8953.3 |
-4.6% |
5.9% |
| Hong Kong |
Hang Seng |
18434.39 |
21086.0 |
19964.6 |
-5.3% |
8.3% |
| S. Korea |
Kospi |
1825.74 |
1989.2 |
1917.1 |
-3.6% |
5.0% |
| Singapore |
STI |
2646.35 |
2990.6 |
2883.4 |
-3.6% |
9.0% |
| China |
Shanghai Composite |
2199.42 |
2452.0 |
2395.0 |
-2.3% |
8.9% |
|
|
|
|
|
|
|
| India |
Sensex 30 |
15454.92 |
16831.1 |
16293.0 |
-3.2% |
5.4% |
| Indonesia |
Jakarta Composite |
3821.99 |
4216.7 |
4114.1 |
-2.4% |
7.6% |
| Malaysia |
KLCI |
1530.73 |
1591.0 |
1584.3 |
-0.4% |
3.5% |
| Philippines |
PSEi |
4371.96 |
5297.6 |
5158.1 |
-2.6% |
18.0% |
| Taiwan |
Taiex |
7072.08 |
7701.0 |
7401.4 |
-3.9% |
4.7% |
| Thailand |
SET |
1025.32 |
1227.4 |
1191.0 |
-3.0% |
16.2% |
|
|
|
|
|
|
|
| Europe |
|
|
|
|
|
|
| UK |
FTSE 100 |
5572.28 |
5655.1 |
5575.5 |
-1.4% |
0.1% |
| France |
CAC |
3159.81 |
3162.0 |
3129.8 |
-1.0% |
-1.0% |
| Germany |
XETRA DAX |
5898.35 |
6561.5 |
6579.9 |
0.3% |
11.6% |
| Italy |
FTSE MIB |
15089.74 |
13918.6 |
14045.4 |
0.9% |
-6.9% |
| Spain |
IBEX 35 |
8566.3 |
6876.0 |
6995.6 |
1.7% |
-18.3% |
| Sweden |
OMX Stockholm 30 |
987.85 |
1032.0 |
1032.4 |
0.0% |
4.5% |
| Switzerland |
SMI |
5936.23 |
6056.8 |
5954.9 |
-1.7% |
0.3% |
|
|
|
|
|
|
|
| North America |
|
|
|
|
|
|
| United States |
Dow |
12217.56 |
13038.3 |
12820.6 |
-1.7% |
4.9% |
|
NASDAQ |
2605.15 |
2956.3 |
2933.8 |
-0.8% |
12.6% |
|
S&P 500 |
1257.6 |
1369.1 |
1353.4 |
-1.1% |
7.6% |
| Canada |
S&P/TSX Comp. |
11955.09 |
11871.2 |
11694.7 |
-1.5% |
-2.2% |
| Mexico |
Bolsa |
37077.52 |
39408.6 |
38888.8 |
-1.3% |
4.9% |
 Equities were mixed last week with the FTSE, CAC and SMI down but the DAX along with the Spanish and Italian indexes in positive territory. The indexes steadied at the end of the week as Greece continued to try to form a new government after last weekend’s inconclusive elections. On Friday, shares were hit by the shock revelations of JPMorgan’s losses, but were lifted by better than anticipated U.S. consumer sentiment. The FTSE was down 1.4 percent, the CAC lost 1.0 percent and the SMI was 1.7 percent lower. The DAX edged up 0.3 percent while the IBEX jumped 1.7 percent and the FTSE MIB was up 0.9 percent. Equities were mixed last week with the FTSE, CAC and SMI down but the DAX along with the Spanish and Italian indexes in positive territory. The indexes steadied at the end of the week as Greece continued to try to form a new government after last weekend’s inconclusive elections. On Friday, shares were hit by the shock revelations of JPMorgan’s losses, but were lifted by better than anticipated U.S. consumer sentiment. The FTSE was down 1.4 percent, the CAC lost 1.0 percent and the SMI was 1.7 percent lower. The DAX edged up 0.3 percent while the IBEX jumped 1.7 percent and the FTSE MIB was up 0.9 percent.
According to the European Commission, gross domestic product in the Eurozone is expected to drop 0.3 percent in 2012, basically reiterating its February forecast. Greece will have the deepest contraction —GDP is expected to drop 4.7 percent — while the economies of Spain and Italy are seen contracting 1.8 percent and 1.4 percent. In 2013, the Eurozone economy is expected to expand 1 percent. A gradual recovery is forecast to begin in the second half of the year and gather momentum in 2013. Spain and France have come under intense pressure from the European Commission to take bolder steps to cut their budget deficits.
Bank of England
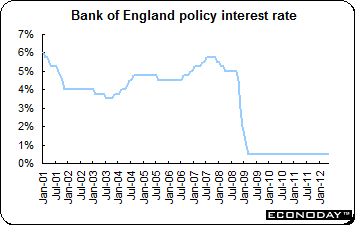 As expected, the Bank of England’s monetary policy committee left its Bank Rate at 0.5 percent where it has been since March 2009. The MPC also left its asset purchase program ceiling unchanged at £325 billion. With the current asset purchase round ending later this month, a minority had anticipated the announcement of another increase. The retention of the status quo suggests that the BoE is retaining its faith in the likes of the PMI and CBI surveys which have typically painted a less downbeat view of the economy than the official data. The input of the Bank's regional agents will also have been especially important this time. As expected, the Bank of England’s monetary policy committee left its Bank Rate at 0.5 percent where it has been since March 2009. The MPC also left its asset purchase program ceiling unchanged at £325 billion. With the current asset purchase round ending later this month, a minority had anticipated the announcement of another increase. The retention of the status quo suggests that the BoE is retaining its faith in the likes of the PMI and CBI surveys which have typically painted a less downbeat view of the economy than the official data. The input of the Bank's regional agents will also have been especially important this time.
Minutes of this month's MPC meeting will be released on May 23rd. However, before that the quarterly Inflation Report will be released on May 16th and Governor Mervyn King may leave the door open to add more stimulus as a flare-up in Europe’s debt crisis and government spending cuts threaten to keep the UK’s recovery at bay. Britain’s recovery remains at risk as Prime Minister David Cameron pushes on with budget cuts to reduce the deficit. The National Institute of Economic and Social Research (NIESR) said yesterday that the economy remains “weak” and the recovery will not take hold until 2013. The tensions in the euro area may add to headwinds.
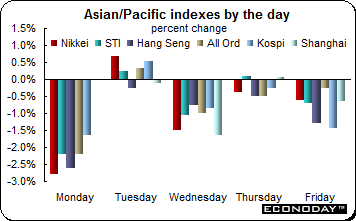 Equities retreated across the board. The biggest declines came on Monday as investors here reacted to the previous Friday’s disappointing US employment report and the weekend elections in France and Greece. On the week, losses ranged from 5.3 percent and 4.6 percent in Hong Kong and Japan respectively to a relatively modest 0.4 percent decline by the KLCI. The week ended on a decidedly dour note after new Chinese data raised fresh concerns about the health of the global economy. Shares were also pressured downward after JP Morgan warned of a surprise $2 billion derivatives trading loss, increasing risk aversion across financial markets. Equities retreated across the board. The biggest declines came on Monday as investors here reacted to the previous Friday’s disappointing US employment report and the weekend elections in France and Greece. On the week, losses ranged from 5.3 percent and 4.6 percent in Hong Kong and Japan respectively to a relatively modest 0.4 percent decline by the KLCI. The week ended on a decidedly dour note after new Chinese data raised fresh concerns about the health of the global economy. Shares were also pressured downward after JP Morgan warned of a surprise $2 billion derivatives trading loss, increasing risk aversion across financial markets.
Bank of Korea
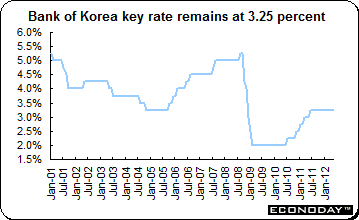 The Bank of Korea kept its policy interest rate at 3.25 percent for the 11th straight month after inflation eased and policy makers cut their forecasts for economic growth. The decision was unanimous. Officials did not discuss a rate cut and indicated they do not see Europe’s woes derailing growth yet. In its statement the BoK said that the economy is expected to maintain a moderate growth trend for now, influenced by the global economic slowdown, especially in Europe. Monetary policy will focus on stabilizing consumer prices at the midpoint of its 2 percent to 4 percent inflation target range over the medium term. The Bank of Korea reduced its 2012 growth forecast to 3.5 percent from 3.7 percent. Inflation moderated to a 21-month low of 2.5 percent in April. The Bank of Korea kept its policy interest rate at 3.25 percent for the 11th straight month after inflation eased and policy makers cut their forecasts for economic growth. The decision was unanimous. Officials did not discuss a rate cut and indicated they do not see Europe’s woes derailing growth yet. In its statement the BoK said that the economy is expected to maintain a moderate growth trend for now, influenced by the global economic slowdown, especially in Europe. Monetary policy will focus on stabilizing consumer prices at the midpoint of its 2 percent to 4 percent inflation target range over the medium term. The Bank of Korea reduced its 2012 growth forecast to 3.5 percent from 3.7 percent. Inflation moderated to a 21-month low of 2.5 percent in April.
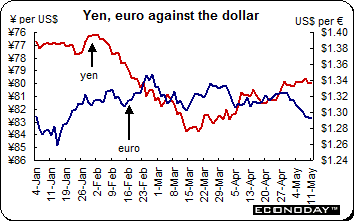 The U.S. dollar was up against all of its major counterparts last week — with the exception of the yen, which treaded water. The euro was down for a second week and in the process, touched a three month low against the dollar, as concerns build that Greece may be forced to withdraw from the currency union given the inability of the country’s politicians to form a government. The euro also weakened after the EU’s gloomy semi-annual economic forecasts. The U.S. dollar was up against all of its major counterparts last week — with the exception of the yen, which treaded water. The euro was down for a second week and in the process, touched a three month low against the dollar, as concerns build that Greece may be forced to withdraw from the currency union given the inability of the country’s politicians to form a government. The euro also weakened after the EU’s gloomy semi-annual economic forecasts.
The euro fell below $1.30 level as Europe returned to the forefront of investor concerns. Greece’s political impasse following an inconclusive May 6th election has raised the possibility that another ballot will have to be held as early as next month, threatening the implementation of austerity pledges. The standoff has reignited European concerns over Greece’s ability to hold to the terms of its two bailouts negotiated since May 2010 and stoked speculation it will have to leave the currency union.
On Friday, both the U.S. dollar and yen were higher against most of their peers after JPMorgan Chase said it made a surprise $2 billion trading loss, boosting demand for safer assets. Higher yielding currencies, including the Australian dollar, dropped after China’s industrial production and retail sales rose less than forecast.
Selected currencies — weekly results
|
|
2011 |
2012 |
% Change |
|
|
Dec 30 |
May 4 |
May 11 |
Week |
2012 |
| U.S. $ per currency |
|
|
|
|
|
|
| Australia |
A$ |
1.023 |
1.019 |
1.003 |
-1.6% |
-1.9% |
| New Zealand |
NZ$ |
0.778 |
0.795 |
0.784 |
-1.5% |
0.7% |
| Canada |
C$ |
0.982 |
1.005 |
0.999 |
-0.6% |
1.8% |
| Eurozone |
euro (€) |
1.294 |
1.309 |
1.292 |
-1.3% |
-0.1% |
| UK |
pound sterling (£) |
1.554 |
1.616 |
1.607 |
-0.5% |
3.5% |
|
|
|
|
|
|
|
| Currency per U.S. $ |
|
|
|
|
|
|
| China |
yuan |
6.295 |
6.298 |
6.311 |
-0.2% |
-0.3% |
| Hong Kong |
HK$* |
7.767 |
7.761 |
7.766 |
-0.1% |
0.0% |
| India |
rupee |
53.065 |
53.375 |
53.555 |
-0.3% |
-0.9% |
| Japan |
yen |
76.975 |
79.860 |
79.940 |
-0.1% |
-3.7% |
| Malaysia |
ringgit |
3.168 |
3.042 |
3.074 |
-1.0% |
3.1% |
| Singapore |
Singapore $ |
1.297 |
1.244 |
1.253 |
-0.7% |
3.5% |
| South Korea |
won |
1152.450 |
1135.100 |
1148.930 |
-1.2% |
0.3% |
| Taiwan |
Taiwan $ |
30.279 |
29.255 |
29.397 |
-0.5% |
3.0% |
| Thailand |
baht |
31.580 |
30.910 |
31.190 |
-0.9% |
1.3% |
| Switzerland |
Swiss franc |
0.939 |
0.918 |
0.930 |
-1.3% |
1.1% |
| *Pegged to U.S. dollar |
|
|
|
|
|
|
| Source: Bloomberg |
|
|
|
|
|
|
 March manufacturing orders jumped 2.2 percent but were down 1.2 percent on the year. The increase reflected a 1.3 percent monthly gain in domestic orders and a 3.0 percent advance in overseas demand and leaves the first quarter average 0.5 percent above the fourth quarter mean. Within the home market, basics dominated with a 4.4 percent monthly gain that proved more than enough to offset a 1.3 percent drop in capital goods and a 0.2 percent decline in consumer & durable goods. The monthly improvement in overall foreign demand was wholly attributable to non-EMU countries (4.8 percent) as orders from the other Eurozone states were flat despite a near-15 percent surge in consumer & durables goods (February was down 8.8 percent). March manufacturing orders jumped 2.2 percent but were down 1.2 percent on the year. The increase reflected a 1.3 percent monthly gain in domestic orders and a 3.0 percent advance in overseas demand and leaves the first quarter average 0.5 percent above the fourth quarter mean. Within the home market, basics dominated with a 4.4 percent monthly gain that proved more than enough to offset a 1.3 percent drop in capital goods and a 0.2 percent decline in consumer & durable goods. The monthly improvement in overall foreign demand was wholly attributable to non-EMU countries (4.8 percent) as orders from the other Eurozone states were flat despite a near-15 percent surge in consumer & durables goods (February was down 8.8 percent).
 March industrial production was up 2.8 percent and was up 1.6 percent on the year. Excluding construction, output was up 1.3 percent both on the month and year. The March gain was broad based with only energy among the major sectors posting a monthly decline (1.8 percent). Consumer goods (3.0 percent) were especially robust and easily more than reversed February's 1.7 percent setback. Capital goods (2.0 percent) also enjoyed a good month and built upon the 1.4 percent gain recorded last time. By comparison intermediates were quite sluggish (0.3 percent). However, the best performer was construction which saw production climb 30.7 percent on the month, eclipsing the 16.9 percent slump posted in mid-quarter when bad weather was a major factor. March industrial production was up 2.8 percent and was up 1.6 percent on the year. Excluding construction, output was up 1.3 percent both on the month and year. The March gain was broad based with only energy among the major sectors posting a monthly decline (1.8 percent). Consumer goods (3.0 percent) were especially robust and easily more than reversed February's 1.7 percent setback. Capital goods (2.0 percent) also enjoyed a good month and built upon the 1.4 percent gain recorded last time. By comparison intermediates were quite sluggish (0.3 percent). However, the best performer was construction which saw production climb 30.7 percent on the month, eclipsing the 16.9 percent slump posted in mid-quarter when bad weather was a major factor.
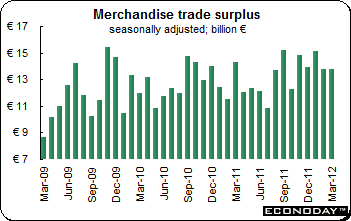 March seasonally adjusted merchandise trade balance returned a €13.7 billion surplus, in line with a marginally wider revised February excess. The unadjusted balance was in the black to the tune of €17.4 billion following a €14.9 billion surplus in mid-quarter. Surplus reflected a 0.9 percent monthly increase in nominal exports — their third gain in a row — together with a 1.2 percent increase in imports — also their third straight advance. March seasonally adjusted merchandise trade balance returned a €13.7 billion surplus, in line with a marginally wider revised February excess. The unadjusted balance was in the black to the tune of €17.4 billion following a €14.9 billion surplus in mid-quarter. Surplus reflected a 0.9 percent monthly increase in nominal exports — their third gain in a row — together with a 1.2 percent increase in imports — also their third straight advance.
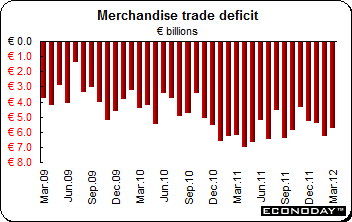 March seasonally adjusted merchandise trade deficit narrowed from a marginally downwardly revised €6.3 billion in February to €5.7 billion in March. The modest improvement concealed a contraction in both sides of the balance sheet with exports 1.5 percent weaker on the month and imports down 2.6 percent, the latter's decline largely attributable to lower energy demand following an unusually cold snap in February. The deficit for the first quarter was still a disappointingly large €17.4 billion, up more than 11 percent on the fourth quarter. March seasonally adjusted merchandise trade deficit narrowed from a marginally downwardly revised €6.3 billion in February to €5.7 billion in March. The modest improvement concealed a contraction in both sides of the balance sheet with exports 1.5 percent weaker on the month and imports down 2.6 percent, the latter's decline largely attributable to lower energy demand following an unusually cold snap in February. The deficit for the first quarter was still a disappointingly large €17.4 billion, up more than 11 percent on the fourth quarter.
 March industrial output dropped 0.9 percent on the month and on the year. Manufacturing was up 1.4 percent for its best performance since July 2011. Coke & refined petroleum posted a 3.4 percent gain while electrical & machine equipment was up 1.1 percent and transport equipment 0.7 percent despite a 2.8 percent decline in autos. There was also a 2.0 percent jump in production in the other manufacturing category. The weakness of total industrial production reflected a 14.2 percent monthly slump in energy and utilities, itself in large part due to warmer weather after an unusually cold February. March industrial output dropped 0.9 percent on the month and on the year. Manufacturing was up 1.4 percent for its best performance since July 2011. Coke & refined petroleum posted a 3.4 percent gain while electrical & machine equipment was up 1.1 percent and transport equipment 0.7 percent despite a 2.8 percent decline in autos. There was also a 2.0 percent jump in production in the other manufacturing category. The weakness of total industrial production reflected a 14.2 percent monthly slump in energy and utilities, itself in large part due to warmer weather after an unusually cold February.
 March industrial production was 0.3 percent lower on the month and down 2.6 percent on the year. However, manufacturing output gained 0.9 percent on the month, reducing the annual pace of contraction to 0.9 percent. Eight manufacturing sub-sectors posted monthly gains, four declined while one was flat. The largest contributions were made by chemicals, where output climbed 5.6 percent, together with transport equipment (3.4 percent). By contrast, wood & paper was down 2.3 percent. Overall industrial production was hit by a 2.5 percent monthly drop in the mining & quarrying category and a 6.4 percent decline in utilities. The marked improvement in the weather will have been a major factor here. March industrial production was 0.3 percent lower on the month and down 2.6 percent on the year. However, manufacturing output gained 0.9 percent on the month, reducing the annual pace of contraction to 0.9 percent. Eight manufacturing sub-sectors posted monthly gains, four declined while one was flat. The largest contributions were made by chemicals, where output climbed 5.6 percent, together with transport equipment (3.4 percent). By contrast, wood & paper was down 2.3 percent. Overall industrial production was hit by a 2.5 percent monthly drop in the mining & quarrying category and a 6.4 percent decline in utilities. The marked improvement in the weather will have been a major factor here.
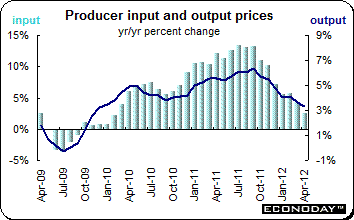 April producer input prices dropped 1.5 percent on the month and were up 1.2 percent on the year. Output prices were up 0.7 percent and up 3.3 percent from a year ago. The increase in output prices was primarily driven by a 2.2 percent monthly jump in tobacco & alcohol charges — only in part due to higher duties — and a 2.4 percent spurt in the cost of computer, electrical & optical equipment. Combined, these sub-sectors added more than 0.4 percentage points to the overall monthly change in output prices. The only other increase of note was in transport equipment (1.2 percent). The one category to register a monthly decline was clothing, textiles & leather (0.4 percent). Core output prices were up a firm 0.6 percent from the end of the first quarter and 2.3 percent higher on the year. Raw material and fuel costs were depressed by a near-4 percent monthly slump in crude oil prices and a 1.8 percent drop in the cost of imported metals. Imported parts & equipment (down 0.9 percent) and fuel (down 0.1 percent) also registered declines while the strongest monthly gains were seen in other imported materials (1.3 percent) and other home produced materials (0.9 percent). April producer input prices dropped 1.5 percent on the month and were up 1.2 percent on the year. Output prices were up 0.7 percent and up 3.3 percent from a year ago. The increase in output prices was primarily driven by a 2.2 percent monthly jump in tobacco & alcohol charges — only in part due to higher duties — and a 2.4 percent spurt in the cost of computer, electrical & optical equipment. Combined, these sub-sectors added more than 0.4 percentage points to the overall monthly change in output prices. The only other increase of note was in transport equipment (1.2 percent). The one category to register a monthly decline was clothing, textiles & leather (0.4 percent). Core output prices were up a firm 0.6 percent from the end of the first quarter and 2.3 percent higher on the year. Raw material and fuel costs were depressed by a near-4 percent monthly slump in crude oil prices and a 1.8 percent drop in the cost of imported metals. Imported parts & equipment (down 0.9 percent) and fuel (down 0.1 percent) also registered declines while the strongest monthly gains were seen in other imported materials (1.3 percent) and other home produced materials (0.9 percent).
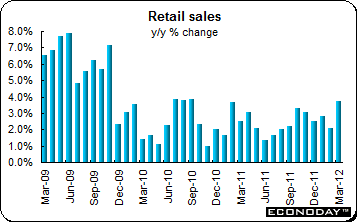 March retail sales were up 0.9 percent after increasing 0.3 percent the month before. On the year, retail sales were up 3.7 percent. Food retailing was up 0.9 percent on the month, followed by cafes, restaurants & takeaway food services (2.0 percent), clothing, footwear & personal accessory retailing (1.6 percent), other retailing (0.5 percent), household goods retailing (0.4 percent) and department stores (0.7 percent). In volume terms, turnover was up 1.8 percent in the March quarter 2012, seasonally adjusted, following an increase of 0.5 percent in the December quarter 2011. March retail sales were up 0.9 percent after increasing 0.3 percent the month before. On the year, retail sales were up 3.7 percent. Food retailing was up 0.9 percent on the month, followed by cafes, restaurants & takeaway food services (2.0 percent), clothing, footwear & personal accessory retailing (1.6 percent), other retailing (0.5 percent), household goods retailing (0.4 percent) and department stores (0.7 percent). In volume terms, turnover was up 1.8 percent in the March quarter 2012, seasonally adjusted, following an increase of 0.5 percent in the December quarter 2011.
 March balance on goods and services was a deficit of A$1.6 billion, up from a deficit of A$480 million the month before. Exports were up 1.6 percent and down 2.7 percent on the year. Rural goods exports were up 8.0 percent on the month and non-monetary gold was up 6.0 percent. Non-rural goods exports slipped A$38 million. Services were up 4 percent. Imports were up 4.9 percent and 10.5 percent on the year. Intermediate and other merchandise goods were up 9 percent, consumption goods were 6 percent higher and capital goods edged up 1 percent. Non-monetary gold dropped 17 percent. Services imports were 2 percent higher. The deficit for the first quarter of 2012 was A$3.2 billion after recording a surplus of $3.1 billion for the three months to December 2011. March balance on goods and services was a deficit of A$1.6 billion, up from a deficit of A$480 million the month before. Exports were up 1.6 percent and down 2.7 percent on the year. Rural goods exports were up 8.0 percent on the month and non-monetary gold was up 6.0 percent. Non-rural goods exports slipped A$38 million. Services were up 4 percent. Imports were up 4.9 percent and 10.5 percent on the year. Intermediate and other merchandise goods were up 9 percent, consumption goods were 6 percent higher and capital goods edged up 1 percent. Non-monetary gold dropped 17 percent. Services imports were 2 percent higher. The deficit for the first quarter of 2012 was A$3.2 billion after recording a surplus of $3.1 billion for the three months to December 2011.
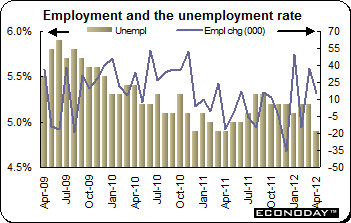 April employment was up by 15,500 after March’s revised jump of 37,600 jobs. The increase in employment was driven entirely by a 26,000 increase in part time employment to 3,438,200. The part time increase was offset by decline in full time employment, down 10,500 people to 8,062,800. The employment increase was mainly driven by higher male part time employment. The unemployment rate declined to 4.9 percent from 5.2 percent in March. There was also a decrease in the labour force participation rate of 0.1 percentage points in April to 65.2 percent. The number of people unemployed decreased by 28,800 people to 598,200. April employment was up by 15,500 after March’s revised jump of 37,600 jobs. The increase in employment was driven entirely by a 26,000 increase in part time employment to 3,438,200. The part time increase was offset by decline in full time employment, down 10,500 people to 8,062,800. The employment increase was mainly driven by higher male part time employment. The unemployment rate declined to 4.9 percent from 5.2 percent in March. There was also a decrease in the labour force participation rate of 0.1 percentage points in April to 65.2 percent. The number of people unemployed decreased by 28,800 people to 598,200.
 April merchandise trade surplus was $18.42 billion. Exports were up 4.9 percent on the year while imports climbed only 0.3 percent. For the four months, January through April, exports were up 4.9 percent when compared with the same four months a year ago while imports were 5.1 percent higher. The January through April trade surplus was $19.3 billion compared with $10.28 billion a year ago. On a seasonally adjusted basis, exports were up 7.2 percent while imports were up 4.8 percent on the year. It was noted by China Customs that trade with Europe and Japan lacks momentum. April merchandise trade surplus was $18.42 billion. Exports were up 4.9 percent on the year while imports climbed only 0.3 percent. For the four months, January through April, exports were up 4.9 percent when compared with the same four months a year ago while imports were 5.1 percent higher. The January through April trade surplus was $19.3 billion compared with $10.28 billion a year ago. On a seasonally adjusted basis, exports were up 7.2 percent while imports were up 4.8 percent on the year. It was noted by China Customs that trade with Europe and Japan lacks momentum.
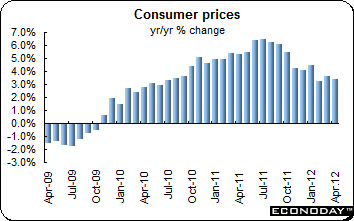 April consumer prices were up 3.4 percent when compared with a year ago as expected. On the month the CPI slipped 0.1 percent. For the four months January through April, the CPI was up 3.7 percent when compared with the same four months a year ago. For the same four months the CPI was up 5.1 percent in 2011. The urban CPI was up 3.4 percent while the rural index was up 3.3 percent on the year. Food prices eased to an increase of 7.0 percent after increasing 7.5 percent in March. According to NBS, food accounted for 2.2 percentage points of the April 3.4 percent increase. Non-food was up 1.7 percent. Clothing increased 3.6 percent after 3.8 percent in March while tobacco & alcohol prices were 3.4 percent higher. Housing was 1.8 percent above a year ago. April consumer prices were up 3.4 percent when compared with a year ago as expected. On the month the CPI slipped 0.1 percent. For the four months January through April, the CPI was up 3.7 percent when compared with the same four months a year ago. For the same four months the CPI was up 5.1 percent in 2011. The urban CPI was up 3.4 percent while the rural index was up 3.3 percent on the year. Food prices eased to an increase of 7.0 percent after increasing 7.5 percent in March. According to NBS, food accounted for 2.2 percentage points of the April 3.4 percent increase. Non-food was up 1.7 percent. Clothing increased 3.6 percent after 3.8 percent in March while tobacco & alcohol prices were 3.4 percent higher. Housing was 1.8 percent above a year ago.
 April producer prices were down a greater than expected 0.7 percent on the year. For the four months January through April, the PPI was 0.1 percent lower on the year compared with an increase of 7.0 percent for the same months in 2011. The PPI was up 0.2 percent on the month. Production materials prices were down 1.1 percent from a year ago while consumer goods prices were 1.1 percent higher. Raw materials procurement, fuel & power were down 0.8 percent. Fuel & power prices eased to an increase of 3.4 percent from 5.1 percent the month before. Ferrous metals, non-ferrous metals and raw chemical materials were down 4.7 percent, 5.7 percent and 3.0 percent respectively on the year. April producer prices were down a greater than expected 0.7 percent on the year. For the four months January through April, the PPI was 0.1 percent lower on the year compared with an increase of 7.0 percent for the same months in 2011. The PPI was up 0.2 percent on the month. Production materials prices were down 1.1 percent from a year ago while consumer goods prices were 1.1 percent higher. Raw materials procurement, fuel & power were down 0.8 percent. Fuel & power prices eased to an increase of 3.4 percent from 5.1 percent the month before. Ferrous metals, non-ferrous metals and raw chemical materials were down 4.7 percent, 5.7 percent and 3.0 percent respectively on the year.
 April retail sales were up 1.13 percent after March’s 1.19 percent increase. This reduced the annual increase from 15.2 percent to 14.1 percent. Year-to-date growth also slipped, to 14.7 percent. The deceleration was led by the urban area where annual sales growth dropped 1.2 percentage points to 14.0 percent and more than reversed March's pick-up. Rural sales were 14.5 percent higher than in April 2011, slightly lower than March’s pace. Although a few sub-sectors, notably stationery, sports & recreation and gold, silver & jewelry enjoyed a good month, the majority saw the pace of demand slow. April retail sales were up 1.13 percent after March’s 1.19 percent increase. This reduced the annual increase from 15.2 percent to 14.1 percent. Year-to-date growth also slipped, to 14.7 percent. The deceleration was led by the urban area where annual sales growth dropped 1.2 percentage points to 14.0 percent and more than reversed March's pick-up. Rural sales were 14.5 percent higher than in April 2011, slightly lower than March’s pace. Although a few sub-sectors, notably stationery, sports & recreation and gold, silver & jewelry enjoyed a good month, the majority saw the pace of demand slow.
 April industrial production slowed to a monthly increase of 0.35 percent, down from a 1.16 percent gain last time. Annual growth fell 2.6 percentage points to 9.3 percent, its worst performance since May 2009. Over the year to date, output expanded 11.0 percent or 0.6 percentage points less than in March. All sectors apart from motor vehicles (10.7 percent after 5.1 percent) saw a deceleration in activity rates, notably transport where annual growth slumped from 7.0 percent to 2.4 percent, power & thermal (2.7 percent after 7.6 percent) and transport equipment (2.4 percent after 7.0 percent). The 12-month increase in cement production (4.0 percent) was also barely half its March pace. April industrial production slowed to a monthly increase of 0.35 percent, down from a 1.16 percent gain last time. Annual growth fell 2.6 percentage points to 9.3 percent, its worst performance since May 2009. Over the year to date, output expanded 11.0 percent or 0.6 percentage points less than in March. All sectors apart from motor vehicles (10.7 percent after 5.1 percent) saw a deceleration in activity rates, notably transport where annual growth slumped from 7.0 percent to 2.4 percent, power & thermal (2.7 percent after 7.6 percent) and transport equipment (2.4 percent after 7.0 percent). The 12-month increase in cement production (4.0 percent) was also barely half its March pace.
 March seasonally adjusted trade balance posted a surplus for the fifth month in a row. The surplus was C$0.35 billion, up slightly from a marginally smaller revised C$0.27 billion February excess. The minor improvement came about despite a 0.4 percent monthly drop in exports, their third decline in a row. Rather, the increase in the surplus was attributable to weaker imports which retreated 0.6 percent from mid-quarter. Exports to the U.S. slumped 2.1 percent which, with imports off only 1.4 percent, saw the bilateral surplus narrow by just over 4 percent to C$4.62 billion. Among the major export categories, by far the most damage was caused by energy products where lower prices contributed towards an 8.9 percent decline on the month. Elsewhere declines were quite limited with no sector down more than 0.7 percent (autos). The best performing area was other consumer goods which climbed 11.6 percent, well ahead of an otherwise impressive 6.2 percent increase in industrial goods & materials. Imports were also hit hard by energy which registered a near-15 percent contraction on the month. Industrial goods & materials were off 4.0 percent but otherwise there were gains across the board, led by autos (4.7 percent), forestry (4.4 percent) and other consumer goods (2.5 percent). March seasonally adjusted trade balance posted a surplus for the fifth month in a row. The surplus was C$0.35 billion, up slightly from a marginally smaller revised C$0.27 billion February excess. The minor improvement came about despite a 0.4 percent monthly drop in exports, their third decline in a row. Rather, the increase in the surplus was attributable to weaker imports which retreated 0.6 percent from mid-quarter. Exports to the U.S. slumped 2.1 percent which, with imports off only 1.4 percent, saw the bilateral surplus narrow by just over 4 percent to C$4.62 billion. Among the major export categories, by far the most damage was caused by energy products where lower prices contributed towards an 8.9 percent decline on the month. Elsewhere declines were quite limited with no sector down more than 0.7 percent (autos). The best performing area was other consumer goods which climbed 11.6 percent, well ahead of an otherwise impressive 6.2 percent increase in industrial goods & materials. Imports were also hit hard by energy which registered a near-15 percent contraction on the month. Industrial goods & materials were off 4.0 percent but otherwise there were gains across the board, led by autos (4.7 percent), forestry (4.4 percent) and other consumer goods (2.5 percent).
 April employment was a solid 58,200 higher but with the participation rate up 0.2 percentage points at 66.8 percent, the jobless rate edged higher to 7.3 percent from 7.2 percent in March. Full time positions climbed 43,900 while part time jobs were up 14,300. Moreover, private sector employment more than accounted for the headline gain, rising 85,800 in contrast to a 19,200 decline in the public sector. The number of self-employed also slipped 8,400. The goods producing area dominated jobs growth, creating a net 70,000 new positions. Most sub-sectors contributed led by manufacturing (23,800) and construction (24,600). Natural resources added 11,000 and agriculture 10,200. However, services shed a net 11,800 jobs, mainly in public administration (32,400) and trade (18,400). Partial offsets were provided by education (16,800), transport and warehousing (12,000) and finance, insurance, real estate & leasing (10,200). April employment was a solid 58,200 higher but with the participation rate up 0.2 percentage points at 66.8 percent, the jobless rate edged higher to 7.3 percent from 7.2 percent in March. Full time positions climbed 43,900 while part time jobs were up 14,300. Moreover, private sector employment more than accounted for the headline gain, rising 85,800 in contrast to a 19,200 decline in the public sector. The number of self-employed also slipped 8,400. The goods producing area dominated jobs growth, creating a net 70,000 new positions. Most sub-sectors contributed led by manufacturing (23,800) and construction (24,600). Natural resources added 11,000 and agriculture 10,200. However, services shed a net 11,800 jobs, mainly in public administration (32,400) and trade (18,400). Partial offsets were provided by education (16,800), transport and warehousing (12,000) and finance, insurance, real estate & leasing (10,200).
The Bank of England, to the surprise of some, left its monetary policy unchanged. The Bank of Korea did the same. Economic data were mixed with better than anticipated labour reports from Canada and Australia but disappointing industrial output from the UK. But all attention was on developments in Greece and France.
Francois Hollande will be sworn in as president of France on Tuesday and will immediately meet with German Chancellor Angela Merkel about the sovereign debt situation. The Bank of England’s Inflation Report will be released on Wednesday. And of course, everyone will be watching developments in Greece.
| Central Bank activities |
|
| May 16 |
UK |
Bank of England Inflation Report |
|
United States |
FOMC Minutes |
|
|
|
| The following indicators will be released this week... |
| Europe |
|
|
| May 14 |
Eurozone |
Industrial Production (March) |
| May 15 |
Eurozone |
Gross Domestic Product (Q1.2012 flash) |
|
Germany |
Gross Domestic Product (Q1.2012 flash) |
|
|
Zew Business Survey (May) |
|
France |
Gross Domestic Product (Q1.2012 flash) |
| May 16 |
Eurozone |
Harmonized Index of Consumer Prices (April final) |
|
|
Merchandise Trade Balance (March) |
|
Italy |
Gross Domestic Product (Q1.2012 flash) |
|
|
Merchandise Trade Balance (March) |
|
UK |
Labour Market Report (April) |
| May 18 |
Germany |
Producer Price Index (April) |
|
|
|
| Asia/Pacific |
|
|
| May 14 |
Japan |
Corporate Goods Price Index (April) |
| May 16 |
Japan |
Machinery Orders (March) |
|
|
Tertiary Activity Index (March) |
| May 17 |
Japan |
Gross Domestic Product (Q1.2012 first estimate) |
|
|
|
| Americas |
|
|
| May 16 |
Canada |
Manufacturing Sales (March) |
| May 18 |
Canada |
Consumer Price Index (April) |
Anne D Picker is the author of International Economic Indicators and Central Banks.
|
