|
Equities continued their 2012 rally through February. Virtually all indexes followed here were up for a second month with gains ranging from 1.1 percent (Bolsa and Jakarta Composite) to 10.5 percent (Nikkei). The lone exception was Spain’s IBEX 35, which declined for a second month.
The news of the week revolved around Fed Chairman Ben Bernanke’s two days of Congressional testimony and creeping progress in Europe as they move ever closer to giving Greece its bailout funds. Eurozone finance ministers approved a debt restructuring for the country but delayed release of the €130 billion Greek bailout. They concluded Athens has not completed all 38 “prior actions” required to receive the funds. The ministers approved about €93 billion for the private sector Greek debt restructuring but held up aid intended to go directly to the Greek government.
Finance ministers and central bankers from the Group of 20 deferred key decisions on international aid for Europe at their meeting two day meeting in Mexico last weekend. They acknowledged potential obstacles, including Germany's reluctance to increase a Eurozone rescue fund. G-20 officials said they would consider lending their support but only after Eurozone’s political leaders provided more financial firepower of their own.
On Friday, all but two European Union countries signed the treaty on tighter budget discipline that's aimed at preventing a repeat of the debt crisis. Only Britain and the Czech Republic did not sign the fiscal compact, under which countries in the Eurozone are bound to write a 'golden rule' on balanced budgets into their national constitutions or equivalent laws, with automatic correction mechanisms if the rule is breached. The fiscal compact will be legally binding as an international agreement and will enter into force following ratification by at least 12 of the 17 euro area member states. However, It will only apply to those contracting parties who use the euro, while the others will be bound by its provisions once they adopt the currency or at an earlier date if they so choose. Earlier, Ireland decided to hold a referendum on Europe’s new fiscal treaty. It will be the first popular vote on the plan for stricter budget discipline across the region.
Fed Chairman Ben Bernanke presented his semi-annual report to both the House Financial Services Committee on Wednesday and the Senate Committee on Banking, Housing and Urban Affairs Thursday. Briefly, Bernanke took note of recent increases in gasoline prices, stating that a temporary boost in headline inflation would hurt the consumer. He said the labor market has improved but is still far from normal. He believes that healthy job growth requires stronger economic growth. He expects the Fed to follow a balanced approach if inflation deviates from the Fed's 2.0 percent inflation target. Bernanke sees the fundamentals for consumer spending and housing as still weak. Bernanke gave no hint of further easing.
Bernanke said the recovery is not as strong as the Fed would like with unemployment still high and growth modest. He noted that manufacturing has been leading the recovery but the continuing problems in the housing sector have resulted in a slower economic recovery than anticipated. He stated that U.S. banks' direct exposure to European sovereign debt is quite limited. Bernanke indicated that it is the Fed's long term goal to unwind the balance sheet to a normal level and to hold only Treasuries. He noted that the Fed’s quantitative easing or QE2 and Operation Twist boosted jobs and the stock market while leaving inflation stable for now.
|
|
2011 |
2012 |
% Change |
|
Index |
Dec 30 |
Feb 24 |
March 2 |
Week |
Feb |
Year |
| Asia/Pacific |
|
|
|
|
|
|
|
| Australia |
All Ordinaries |
4111 |
4389.0 |
4364.1 |
-0.6% |
1.4% |
6.2% |
| Japan |
Nikkei 225 |
8455.35 |
9647.4 |
9777.0 |
1.3% |
10.5% |
15.6% |
| Hong Kong |
Hang Seng |
18434.39 |
21406.9 |
21562.3 |
0.7% |
6.3% |
17.0% |
| S. Korea |
Kospi |
1825.74 |
2019.9 |
2034.6 |
0.7% |
3.8% |
11.4% |
| Singapore |
STI |
2646.35 |
2978.1 |
2993.5 |
0.5% |
3.0% |
13.1% |
| China |
Shanghai Composite |
2199.42 |
2439.6 |
2460.7 |
0.9% |
5.9% |
11.9% |
|
|
|
|
|
|
|
|
| India |
Sensex 30 |
15454.92 |
17923.6 |
17636.8 |
-1.6% |
3.3% |
14.1% |
| Indonesia |
Jakarta Composite |
3821.99 |
3894.6 |
4004.9 |
2.8% |
1.1% |
4.8% |
| Malaysia |
KLCI |
1530.73 |
1558.8 |
1583.8 |
1.6% |
3.2% |
3.5% |
| Philippines |
PSEi |
4371.96 |
4893.0 |
5016.3 |
2.5% |
4.6% |
14.7% |
| Taiwan |
Taiex |
7072.08 |
7959.3 |
8144.0 |
2.3% |
8.0% |
15.2% |
| Thailand |
SET |
1025.32 |
1146.1 |
1165.2 |
1.7% |
7.1% |
13.6% |
|
|
|
|
|
|
|
|
| Europe |
|
|
|
|
|
|
|
| UK |
FTSE 100 |
5572.28 |
5935.1 |
5911.1 |
-0.4% |
3.3% |
6.1% |
| France |
CAC |
3159.81 |
3467.0 |
3501.2 |
1.0% |
4.7% |
10.8% |
| Germany |
XETRA DAX |
5898.35 |
6864.4 |
6921.4 |
0.8% |
6.1% |
17.3% |
| Italy |
FTSE MIB |
15089.74 |
16487.5 |
16902.5 |
2.5% |
3.3% |
12.0% |
| Spain |
IBEX 35 |
8566.3 |
8527.7 |
8563.4 |
0.4% |
-0.5% |
0.0% |
| Sweden |
OMX Stockholm 30 |
987.85 |
1091.4 |
1096.9 |
0.5% |
6.1% |
11.0% |
| Switzerland |
SMI |
5936.23 |
6184.1 |
6149.4 |
-0.6% |
2.3% |
3.6% |
|
|
|
|
|
|
|
|
| North America |
|
|
|
|
|
|
|
| United States |
Dow |
12217.56 |
12983.0 |
12977.6 |
0.0% |
2.5% |
6.2% |
|
NASDAQ |
2605.15 |
2963.8 |
2976.2 |
0.4% |
5.4% |
14.2% |
|
S&P 500 |
1257.6 |
1365.7 |
1369.6 |
0.3% |
4.1% |
8.9% |
| Canada |
S&P/TSX Comp. |
11955.09 |
12725.8 |
12643.8 |
-0.6% |
1.5% |
5.8% |
| Mexico |
Bolsa |
37077.52 |
37945.2 |
38327.4 |
1.0% |
1.1% |
3.4% |
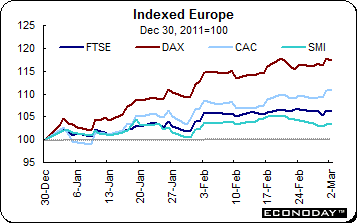 After six weeks of gains, the FTSE slipped 0.4 percent in the week on a wave of profit taking. The index was weighed down by mixed U.S. data, signs of defiance from Spain on strict EU austerity targets, ongoing concerns about Greek debt restructuring and high oil prices. The SMI also declined on the week, losing 0.6 percent. However, both indexes were up for a second consecutive month in February, gaining 3.3 percent and 2.3 percent respectively. The CAC and DAX were up 1.0 percent and 0.8 percent on guarded optimism that the worst of the sovereign debt crisis is over. The two indexes were 4.7 percent and 6.1 percent in February. After six weeks of gains, the FTSE slipped 0.4 percent in the week on a wave of profit taking. The index was weighed down by mixed U.S. data, signs of defiance from Spain on strict EU austerity targets, ongoing concerns about Greek debt restructuring and high oil prices. The SMI also declined on the week, losing 0.6 percent. However, both indexes were up for a second consecutive month in February, gaining 3.3 percent and 2.3 percent respectively. The CAC and DAX were up 1.0 percent and 0.8 percent on guarded optimism that the worst of the sovereign debt crisis is over. The two indexes were 4.7 percent and 6.1 percent in February.
Eurozone finance ministers decided to accelerate payment to the region's permanent bailout fund, the European Stability Mechanism, underlining their commitment to immediately resolve the debt crisis. They also expressed their readiness to aid Greece using money from the second rescue package, but on condition that Greece completes the debt write-off deal with its private lenders in the coming week.
The ECB's second unlimited three year loan allotment far exceeded expectations on higher demand, limiting the threat of a credit crunch. The ECB provided a record €529.53 billion long term refinancing operation (LTRO) to about 800 bidders.
 The sinking yen cheered exporters in Japan as the end of the fiscal year approaches and along with it the repatriation of profits. The index was up 1.3 percent for the week and soared 10.5 percent in February. Although most equity indexes were up last week, the exceptions were the All Ordinaries, down 0.6 percent and the Sensex, down 1.6 percent. In February however, the indexes were up 1.4 percent and 3.3 percent respectively. The sinking yen cheered exporters in Japan as the end of the fiscal year approaches and along with it the repatriation of profits. The index was up 1.3 percent for the week and soared 10.5 percent in February. Although most equity indexes were up last week, the exceptions were the All Ordinaries, down 0.6 percent and the Sensex, down 1.6 percent. In February however, the indexes were up 1.4 percent and 3.3 percent respectively.
Equities were boosted by a combination of better than anticipated economic data, successful government bond auctions in Italy, France and Spain, the ECB liquidity injection, continued progress in working out the Greek bailout and continued signs of an improving U.S. labor market which helped investors overlook the inflationary threat of high oil prices.
Investors were swayed by China’s manufacturing PMI results. As measured by China Federation of Logistics and Purchasing, the PMI improved to a reading of 51 — the fastest pace in five months in February — backed by a strong rebound in exports orders. These results are at odds with the results of a survey by HSBC/Markit which showed that the manufacturing sector is still in negative territory. The corresponding index came in at 49.6 suggesting a slight contraction.
The Shanghai Composite and Hang Seng were up 0.9 percent and 0.7 percent for the week. In February, they gained 5.9 percent and 6.3 percent respectively. The Hang Seng sank 20.0 percent in 2011. But already in the first two months of 2012, the index has rebounded by 17.0 percent. The index, which is heavily weighted with financial and real estate stocks, was hurt last year by worries about the Chinese property market and the health of the country's banks. Now the index is jumping as China eases credit, the U.S. economy picks up steam and the European crisis appears to be on hold.
 The U.S. dollar climbed to a nine month high against the yen. The yen began its latest slide after the Bank of Japan — at its last monetary policy board meeting on February 13th — expanded its quantitative easing. The BoJ increased its asset purchase program to ¥65 trillion from ¥55 trillion. The Bank also increased its long term JGB buying to ¥19 trillion from ¥9 trillion. The dollar has been strengthened by a string of data that shows the U.S. economy continuing to grow, albeit slowly. In Japan, growth has declined and prices continue to fall as the economy attempts to recover so far unsuccessfully from deflation. The U.S. dollar climbed to a nine month high against the yen. The yen began its latest slide after the Bank of Japan — at its last monetary policy board meeting on February 13th — expanded its quantitative easing. The BoJ increased its asset purchase program to ¥65 trillion from ¥55 trillion. The Bank also increased its long term JGB buying to ¥19 trillion from ¥9 trillion. The dollar has been strengthened by a string of data that shows the U.S. economy continuing to grow, albeit slowly. In Japan, growth has declined and prices continue to fall as the economy attempts to recover so far unsuccessfully from deflation.
Several events sent the euro lower last week. The euro lost ground against the U.S. dollar after Fed Chairman Ben Bernanke made no mention of a possible QE3 going forward. The euro also was pressured by a string of weak economic reports culminating in Friday’s Germany retail sales which unexpectedly dropped 1.6 percent in January. Concerns about the continuing woes in Spain and Portugal also led investors to proceed cautiously, if at all.
Selected currencies — weekly results
|
|
2011 |
2012 |
% Change |
|
|
Dec 30 |
Feb 24 |
Mar 2 |
Week |
2012 |
| U.S. $ per currency |
|
|
|
|
|
|
| Australia |
A$ |
1.023 |
1.069 |
1.073 |
0.4% |
4.9% |
| New Zealand |
NZ$ |
0.778 |
0.836 |
0.829 |
-0.8% |
6.5% |
| Canada |
C$ |
0.982 |
1.000 |
1.012 |
1.1% |
3.1% |
| Eurozone |
euro (€) |
1.294 |
1.346 |
1.320 |
-1.9% |
2.0% |
| UK |
pound sterling (£) |
1.554 |
1.590 |
1.584 |
-0.4% |
1.9% |
|
|
|
|
|
|
|
| Currency per U.S. $ |
|
|
|
|
|
|
| China |
yuan |
6.295 |
6.298 |
6.298 |
0.0% |
-0.1% |
| Hong Kong |
HK$* |
7.767 |
7.754 |
7.759 |
-0.1% |
0.1% |
| India |
rupee |
53.065 |
48.945 |
49.500 |
-1.1% |
7.2% |
| Japan |
yen |
76.975 |
80.982 |
81.818 |
-1.0% |
-5.9% |
| Malaysia |
ringgit |
3.168 |
3.013 |
3.005 |
0.3% |
5.4% |
| Singapore |
Singapore $ |
1.297 |
1.255 |
1.251 |
0.3% |
3.7% |
| South Korea |
won |
1152.450 |
1125.800 |
1115.610 |
0.9% |
3.3% |
| Taiwan |
Taiwan $ |
30.279 |
29.577 |
29.436 |
0.5% |
2.9% |
| Thailand |
baht |
31.580 |
30.320 |
30.590 |
-0.9% |
3.2% |
| Switzerland |
Swiss franc |
0.939 |
0.895 |
0.914 |
-2.1% |
2.8% |
| *Pegged to U.S. dollar |
|
|
|
|
|
|
| Source: Bloomberg |
|
|
|
|
|
|
 January M3 money supply was up 2.5 percent when compared with a year ago. As a result, the 3-month moving average measure preferred by the ECB held steady at 2.0 percent. However, bank lending remained decidedly soft with a 12-month increase of just 1.1 percent. Lending to households slowed 0.2 percentage points to a 1.3 percent annual rate within which borrowing for house purchase was down 0.5 tenths to 1.8 percent. Loans to non-financial corporations were up 0.7 percent from January 2011 — well short of December's 1.1 percent rate. As a result, overall lending would have been significantly more subdued but for a sharp pick-up in borrowing by non-monetary financial intermediaries (2.3 percent from a decline of 2.0 percent). January M3 money supply was up 2.5 percent when compared with a year ago. As a result, the 3-month moving average measure preferred by the ECB held steady at 2.0 percent. However, bank lending remained decidedly soft with a 12-month increase of just 1.1 percent. Lending to households slowed 0.2 percentage points to a 1.3 percent annual rate within which borrowing for house purchase was down 0.5 tenths to 1.8 percent. Loans to non-financial corporations were up 0.7 percent from January 2011 — well short of December's 1.1 percent rate. As a result, overall lending would have been significantly more subdued but for a sharp pick-up in borrowing by non-monetary financial intermediaries (2.3 percent from a decline of 2.0 percent).
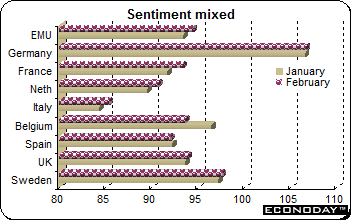 February economic sentiment improved modestly to a reading of 94.4. It was the second consecutive monthly gain. The increase in overall sentiment was mainly attributable to industry where confidence improved 1.2 points to minus 5.8. Retail also showed some promising signs (minus 14.3 after minus 15.5) but still failed to fully reverse January's 3 point decline while the consumer sector saw little change (minus 20.3 after minus 20.7). Meantime, morale in services was off 0.2 points at minus 0.9 but 3.6 points better off in construction at a still lowly minus 24.5. Regionally, among the larger EMU countries the index is still above its long run average in just Germany which saw a minimal 0.1 point increase this month. However, France registered a 1.6 point advance and Italy was up 1 point as well. However, Spain remained firmly in the doldrums, slipping 0.2 points. Elsewhere, sentiment was steady in Greece and just 0.2 points firmer in Portugal. February economic sentiment improved modestly to a reading of 94.4. It was the second consecutive monthly gain. The increase in overall sentiment was mainly attributable to industry where confidence improved 1.2 points to minus 5.8. Retail also showed some promising signs (minus 14.3 after minus 15.5) but still failed to fully reverse January's 3 point decline while the consumer sector saw little change (minus 20.3 after minus 20.7). Meantime, morale in services was off 0.2 points at minus 0.9 but 3.6 points better off in construction at a still lowly minus 24.5. Regionally, among the larger EMU countries the index is still above its long run average in just Germany which saw a minimal 0.1 point increase this month. However, France registered a 1.6 point advance and Italy was up 1 point as well. However, Spain remained firmly in the doldrums, slipping 0.2 points. Elsewhere, sentiment was steady in Greece and just 0.2 points firmer in Portugal.
 January final harmonized index of consumer prices was down 0.8 percent on the month and up 2.6 percent on the year. Excluding food, drink, tobacco & petroleum the HICP was 1.5 percent higher. Without just unprocessed food & petroleum the core reading was 1.9 percent and excluding only seasonal food and petroleum it was 2.0 percent. A 2.6 percent jump in energy costs provided the largest boost to the monthly change in the overall HICP but this was easily offset by declines elsewhere, notably in clothing (14.1 percent) and recreation & culture (2.0 percent). Prices of household equipment (down 0.7 percent), communications (down 0.2 percent) and hotels & restaurants (down 0.6 percent) were also lower than in December. Regionally, annual inflation declined in all of the larger four EMU states apart from Germany where it held steady at 2.3 percent. January final harmonized index of consumer prices was down 0.8 percent on the month and up 2.6 percent on the year. Excluding food, drink, tobacco & petroleum the HICP was 1.5 percent higher. Without just unprocessed food & petroleum the core reading was 1.9 percent and excluding only seasonal food and petroleum it was 2.0 percent. A 2.6 percent jump in energy costs provided the largest boost to the monthly change in the overall HICP but this was easily offset by declines elsewhere, notably in clothing (14.1 percent) and recreation & culture (2.0 percent). Prices of household equipment (down 0.7 percent), communications (down 0.2 percent) and hotels & restaurants (down 0.6 percent) were also lower than in December. Regionally, annual inflation declined in all of the larger four EMU states apart from Germany where it held steady at 2.3 percent.
 February manufacturing PMI reading was 49.0, up slightly from January’s 48.8 and still below the key 50 growth threshold. Overall manufacturing production posted a very modest gain and only then thanks to advances in France and, in particular, Germany. Elsewhere producers continued to struggle. New orders declined for the ninth month in a row with only Austria and the Netherlands reporting increases. Export demand was down for the eighth month running, especially in Germany, Greece and Spain. Backlogs were similarly lower too as firms were once again forced to work on outstanding business in order to support production. The forward looking orders/inventory ratio remained below its long run average albeit close to January's 7-month peak. The weakness in orders was accompanied by the third decline in employment in the last four months. The Greek and Spanish labour markets were especially badly hit. Input cost inflation jumped and, despite intense competition, factory gate charges increased at their fastest rate in five months. February manufacturing PMI reading was 49.0, up slightly from January’s 48.8 and still below the key 50 growth threshold. Overall manufacturing production posted a very modest gain and only then thanks to advances in France and, in particular, Germany. Elsewhere producers continued to struggle. New orders declined for the ninth month in a row with only Austria and the Netherlands reporting increases. Export demand was down for the eighth month running, especially in Germany, Greece and Spain. Backlogs were similarly lower too as firms were once again forced to work on outstanding business in order to support production. The forward looking orders/inventory ratio remained below its long run average albeit close to January's 7-month peak. The weakness in orders was accompanied by the third decline in employment in the last four months. The Greek and Spanish labour markets were especially badly hit. Input cost inflation jumped and, despite intense competition, factory gate charges increased at their fastest rate in five months.
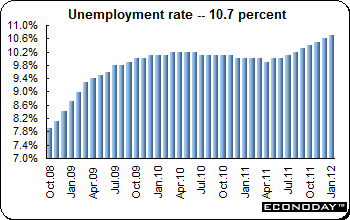 January joblessness was up 185,000 to 16.925 million, raising the unemployment rate from an already upwardly revised 10.6 percent in December to 10.7 percent, a new record high. The disappointing January figures underline the importance of the German contribution which increased the overall rate. German joblessness as calculated by Eurostat edged up 0.1 percentage points to 5.8 percent and compounded gains in France (10.0 percent from 9.9 percent), Italy (9.2 percent from 8.9 percent) and Spain (23.3 percent from 23.1 percent). Elsewhere there was more bad news for Portugal (14.8 percent from 14.6 percent) where the unemployment rate has now risen 2.5 percentage points since June last year. Austria (4.0 percent after 4.2 percent) and Slovakia (13.3 percent after 13.4 percent) were the only countries to see their jobless rates decline. January joblessness was up 185,000 to 16.925 million, raising the unemployment rate from an already upwardly revised 10.6 percent in December to 10.7 percent, a new record high. The disappointing January figures underline the importance of the German contribution which increased the overall rate. German joblessness as calculated by Eurostat edged up 0.1 percentage points to 5.8 percent and compounded gains in France (10.0 percent from 9.9 percent), Italy (9.2 percent from 8.9 percent) and Spain (23.3 percent from 23.1 percent). Elsewhere there was more bad news for Portugal (14.8 percent from 14.6 percent) where the unemployment rate has now risen 2.5 percentage points since June last year. Austria (4.0 percent after 4.2 percent) and Slovakia (13.3 percent after 13.4 percent) were the only countries to see their jobless rates decline.
 February unemployment rate was 6.8 percent for the second month. The number of people out of work was unchanged from January which was revised to a 26,000 decline. In addition, the 6,000 increase in vacancies posted in January was more than reversed by an 11,000 decline. The February jobless figures follow an ILO report showing employment up 93,000 in January to a record high of 41.368 million. Not only was this the 23rd monthly gain in a row but also the largest. It should be noted that Germany uses a different definition of unemployment than Eurostat which accounts for the difference between the two. February unemployment rate was 6.8 percent for the second month. The number of people out of work was unchanged from January which was revised to a 26,000 decline. In addition, the 6,000 increase in vacancies posted in January was more than reversed by an 11,000 decline. The February jobless figures follow an ILO report showing employment up 93,000 in January to a record high of 41.368 million. Not only was this the 23rd monthly gain in a row but also the largest. It should be noted that Germany uses a different definition of unemployment than Eurostat which accounts for the difference between the two.
 January producer prices jumped 0.6 percent on the month and 4.2 percent on the year. Prices were supported mainly by a 5.6 percent surge in the cost of coking & refining products. However, most other areas were generally quite subdued. Electrical equipment and information technology together with transport materials posted a 0.2 percent monthly increase while food, drink & tobacco charges were down 0.1 percent and the other products category recorded a 0.3 percent gain. January producer prices jumped 0.6 percent on the month and 4.2 percent on the year. Prices were supported mainly by a 5.6 percent surge in the cost of coking & refining products. However, most other areas were generally quite subdued. Electrical equipment and information technology together with transport materials posted a 0.2 percent monthly increase while food, drink & tobacco charges were down 0.1 percent and the other products category recorded a 0.3 percent gain.
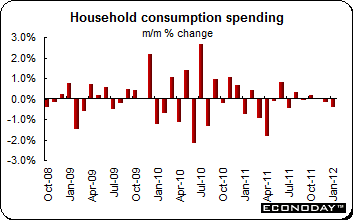 January consumption expenditures declined 0.4 percent and down 2.2 percent when compared with January a year ago. Spending on manufactured goods sank 0.8 percent and was down 2.4 percent on the year. Weakness was particularly apparent in durable goods which were off 2.7 percent on the month, mainly due to a 7.6 percent slump in auto demand. However, household goods also were down 1.5 percent and textiles dropped a further 2.3 percent, their sixth contraction in the last seven months. The other products category was the only major area unchanged on the month. January consumption expenditures declined 0.4 percent and down 2.2 percent when compared with January a year ago. Spending on manufactured goods sank 0.8 percent and was down 2.4 percent on the year. Weakness was particularly apparent in durable goods which were off 2.7 percent on the month, mainly due to a 7.6 percent slump in auto demand. However, household goods also were down 1.5 percent and textiles dropped a further 2.3 percent, their sixth contraction in the last seven months. The other products category was the only major area unchanged on the month.
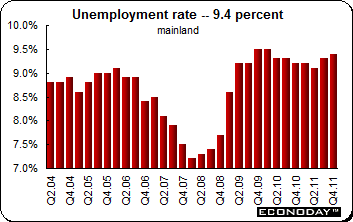 Fourth quarter joblessness on the ILO definition edged up 0.1 percentage points to 9.4 percent for mainland France. This was its highest level since the first quarter of 2010 and reflected an increase in the number of people out of work of 50,000 to 2.678 million. Including overseas territories the rate was also up 0.1 percentage points at 9.8 percent. The increase in metropolitan France was due to a sharp increase in the jobless rate for men which climbed 0.4 percentage points to 9.2 percent. This was in marked contrast to a 0.1 percentage point decline in the female rate to 9.7 percent, its lowest reading since the third quarter of 2010. Fourth quarter joblessness on the ILO definition edged up 0.1 percentage points to 9.4 percent for mainland France. This was its highest level since the first quarter of 2010 and reflected an increase in the number of people out of work of 50,000 to 2.678 million. Including overseas territories the rate was also up 0.1 percentage points at 9.8 percent. The increase in metropolitan France was due to a sharp increase in the jobless rate for men which climbed 0.4 percentage points to 9.2 percent. This was in marked contrast to a 0.1 percentage point decline in the female rate to 9.7 percent, its lowest reading since the third quarter of 2010.
 January retail sales jumped 1.9 percent on the year after increasing 2.5 percent in December. Auto sales were up for the fourth month, soaring 24.3 percent after a jump of 14.9 percent on the year the month before. However, partially offsetting the auto increase was a drop of 12.2 percent in machinery and equipment sales after sinking 9.5 percent in December. Elsewhere, fabrics, apparel & accessories were up a modest 1.4 percent after jumping 4.4 percent last time. Food & beverage sakes were up 0.6 percent after increasing 0.7 percent in December. Large scale store sales slumped 1.0 percent on the year. January retail sales jumped 1.9 percent on the year after increasing 2.5 percent in December. Auto sales were up for the fourth month, soaring 24.3 percent after a jump of 14.9 percent on the year the month before. However, partially offsetting the auto increase was a drop of 12.2 percent in machinery and equipment sales after sinking 9.5 percent in December. Elsewhere, fabrics, apparel & accessories were up a modest 1.4 percent after jumping 4.4 percent last time. Food & beverage sakes were up 0.6 percent after increasing 0.7 percent in December. Large scale store sales slumped 1.0 percent on the year.
 January industrial production was up 2.0 percent after jumping 3.8 percent in December. On the year, industrial production was down 0.9 percent. Transportation equipment (up 3.0 percent), information & communication electronics equipment (up 12.0 percent) and iron & steel (up 5.9 percent) all contributed to the increase in output. Commodities that mainly contributed to the increase were large passenger cars, digital still cameras and car navigation systems. The data showed that companies expect output to rise 1.7 percent in February on the month and then increase 1.7 percent in March. METI revised its assessment of production in January, saying some signs of a pickup in production can be seen. January industrial production was up 2.0 percent after jumping 3.8 percent in December. On the year, industrial production was down 0.9 percent. Transportation equipment (up 3.0 percent), information & communication electronics equipment (up 12.0 percent) and iron & steel (up 5.9 percent) all contributed to the increase in output. Commodities that mainly contributed to the increase were large passenger cars, digital still cameras and car navigation systems. The data showed that companies expect output to rise 1.7 percent in February on the month and then increase 1.7 percent in March. METI revised its assessment of production in January, saying some signs of a pickup in production can be seen.
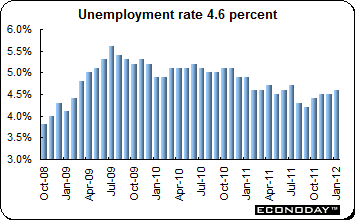 January unemployment edged up to 4.6 percent from a revised 4.5 percent in December due to annual revisions. When compared with a year ago, employment dropped 480,000 after losing 100,000 jobs in December. This was the second consecutive decline in a row. The number of unemployed declined by 190,000 on the year. The labor force participation rate slipped 0.4 percent to 58.6 percent. The employment rate was down 0.3 percent to 55.9 percent. January unemployment edged up to 4.6 percent from a revised 4.5 percent in December due to annual revisions. When compared with a year ago, employment dropped 480,000 after losing 100,000 jobs in December. This was the second consecutive decline in a row. The number of unemployed declined by 190,000 on the year. The labor force participation rate slipped 0.4 percent to 58.6 percent. The employment rate was down 0.3 percent to 55.9 percent.
 January household spending dropped 2.3 percent on the year after increasing 0.5 percent in December. Bad weather conditions affected sales as heavy snowfalls limited shopping and electronics sales remained weak. Medical care, transportation & communication and Education were hit the hardest, with declines of 8.7 percent, 5.5 percent and 7.5 percent respectively. Housing slumped 2.6 percent. However, clothing & footwear sales jumped 4.4 percent while food and furniture and utensils sales were up 0.6 percent. January household spending dropped 2.3 percent on the year after increasing 0.5 percent in December. Bad weather conditions affected sales as heavy snowfalls limited shopping and electronics sales remained weak. Medical care, transportation & communication and Education were hit the hardest, with declines of 8.7 percent, 5.5 percent and 7.5 percent respectively. Housing slumped 2.6 percent. However, clothing & footwear sales jumped 4.4 percent while food and furniture and utensils sales were up 0.6 percent.
 January consumer prices were up 0.2 percent and 0.1 percent on the year. Core excluding only fresh food was down 0.2 percent on the month and 0.1 percent on the year. This was the fourth consecutive decline on the year. Energy prices were up 0.3 percent on the month but jumped 5.7 percent on the year. Less both food and energy, the CPI dropped 0.3 percent and 0.9 percent. Prices for clothes & footwear slumped 5.9 percent on the month but were 0.7 higher on the year. Furniture & household utensils were up 3.4 percent but slid 2.9 percent from a year ago. Culture & recreation dropped 1.1 percent and 4.1 percent. Goods prices were up 0.6 percent on the month and 0.2 percent on the year while services sipped 0.1 percent and were unchanged on the year. January consumer prices were up 0.2 percent and 0.1 percent on the year. Core excluding only fresh food was down 0.2 percent on the month and 0.1 percent on the year. This was the fourth consecutive decline on the year. Energy prices were up 0.3 percent on the month but jumped 5.7 percent on the year. Less both food and energy, the CPI dropped 0.3 percent and 0.9 percent. Prices for clothes & footwear slumped 5.9 percent on the month but were 0.7 higher on the year. Furniture & household utensils were up 3.4 percent but slid 2.9 percent from a year ago. Culture & recreation dropped 1.1 percent and 4.1 percent. Goods prices were up 0.6 percent on the month and 0.2 percent on the year while services sipped 0.1 percent and were unchanged on the year.
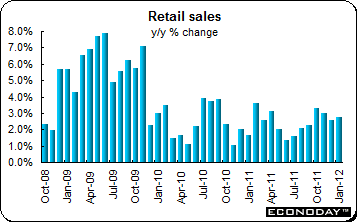 January retail sales were up 0.3 percent and 2.7 percent on the year. The increased sales was driven by cafes, restaurants & catering services (6.6 percent) which is a subgroup of cafes, restaurants & takeaway food services (4.3 percent). Other retailing was up 0.2 percent while clothing, footwear & personal accessory retailing edged up 0.1 percent. Household goods retailing slid 1.8 percent and department stores were 0.2 percent lower. Food retailing was relatively unchanged. It should be noted that January is always a problematic month for data as the post-Christmas low makes estimates much more sensitive to the vagaries of seasonal adjustment. January retail sales were up 0.3 percent and 2.7 percent on the year. The increased sales was driven by cafes, restaurants & catering services (6.6 percent) which is a subgroup of cafes, restaurants & takeaway food services (4.3 percent). Other retailing was up 0.2 percent while clothing, footwear & personal accessory retailing edged up 0.1 percent. Household goods retailing slid 1.8 percent and department stores were 0.2 percent lower. Food retailing was relatively unchanged. It should be noted that January is always a problematic month for data as the post-Christmas low makes estimates much more sensitive to the vagaries of seasonal adjustment.
 January industrial prices were up 0.3 percent and 2.3 percent on the year. Raw material prices edged up 0.1 percent and were 4.3 percent above their year ago level. The IPPI advance was mainly attributable to a 2.1 percent monthly jump in the price of petroleum & coal products and a 1.9 percent spike in the cost of primary metal products. Excluding the former, the IPPI would have been flat on the month and only 1.0 percent higher than in January 2011. Most other subsectors showed little monthly change although pulp and paper prices dropped 1.0 percent and motor vehicles & other transport equipment were down 0.5 percent on the month. Exchange rate effects were also favourable and without these, the IPPI would have risen a monthly 0.6 percent. The minimal monthly increase in the RMPI reflected a 1.1 percent slide in mineral fuel costs, in large part offset by a 3.6 percent surge in the price of non-ferrous metals. Vegetable product costs were also off 0.7 percent but elsewhere prices were broadly stable. January industrial prices were up 0.3 percent and 2.3 percent on the year. Raw material prices edged up 0.1 percent and were 4.3 percent above their year ago level. The IPPI advance was mainly attributable to a 2.1 percent monthly jump in the price of petroleum & coal products and a 1.9 percent spike in the cost of primary metal products. Excluding the former, the IPPI would have been flat on the month and only 1.0 percent higher than in January 2011. Most other subsectors showed little monthly change although pulp and paper prices dropped 1.0 percent and motor vehicles & other transport equipment were down 0.5 percent on the month. Exchange rate effects were also favourable and without these, the IPPI would have risen a monthly 0.6 percent. The minimal monthly increase in the RMPI reflected a 1.1 percent slide in mineral fuel costs, in large part offset by a 3.6 percent surge in the price of non-ferrous metals. Vegetable product costs were also off 0.7 percent but elsewhere prices were broadly stable.
 Fourth quarter gross domestic product was up 0.4 percent on the quarter and 2.2 percent on the year. GDP was up 1.8 percent on a seasonally adjusted annual rate. The latest advance followed a slightly stronger revised 1.0 percent increase in the third quarter and made for annual growth of 2.6 percent. Among the GDP expenditure components household spending was up 0.7 percent on the quarter as was gross fixed capital formation. Government current expenditure was flat. Inventories expanded moderately as manufacturers and wholesalers both added to existing stocks.Net exports strengthened with export volumes up a quarterly 1.1 percent, more than twice the 0.5 percent advance in imports. Overall, final domestic demand expanded 0.5 percent from the third quarter when it grew 0.4 percent. In terms of output, goods producing industries gained 0.5 percent (manufacturing a healthy 1.5 percent), just ahead of a 0.4 percent increase in services. Fourth quarter gross domestic product was up 0.4 percent on the quarter and 2.2 percent on the year. GDP was up 1.8 percent on a seasonally adjusted annual rate. The latest advance followed a slightly stronger revised 1.0 percent increase in the third quarter and made for annual growth of 2.6 percent. Among the GDP expenditure components household spending was up 0.7 percent on the quarter as was gross fixed capital formation. Government current expenditure was flat. Inventories expanded moderately as manufacturers and wholesalers both added to existing stocks.Net exports strengthened with export volumes up a quarterly 1.1 percent, more than twice the 0.5 percent advance in imports. Overall, final domestic demand expanded 0.5 percent from the third quarter when it grew 0.4 percent. In terms of output, goods producing industries gained 0.5 percent (manufacturing a healthy 1.5 percent), just ahead of a 0.4 percent increase in services.
 December monthly gross domestic product was up 0.4 percent on the month and 1.8 percent when compared with a year ago. The advance was built upon a 0.8 percent monthly gain in goods producing output. Manufacturing (0.9 percent) enjoyed another solid increase and was supported by a sizeable 1.4 percent jump in mining & oil & gas extraction. Agriculture (0.8 percent) also fared well and construction (0.4 percent) was comfortably in positive territory. However, utilities output dropped 1.0 percent. Services expanded 0.3 percent from November, although this was still their best performance since last July. Wholesale trade (1.3 percent) registered the largest gain ahead of arts, entertainment & recreation (0.5 percent). Finance, insurance & real estate increased 0.4 percent but other advances were small and there were declines in accommodation and food (0.3 percent), public administration (0.2 percent) and retail (0.1 percent). December monthly gross domestic product was up 0.4 percent on the month and 1.8 percent when compared with a year ago. The advance was built upon a 0.8 percent monthly gain in goods producing output. Manufacturing (0.9 percent) enjoyed another solid increase and was supported by a sizeable 1.4 percent jump in mining & oil & gas extraction. Agriculture (0.8 percent) also fared well and construction (0.4 percent) was comfortably in positive territory. However, utilities output dropped 1.0 percent. Services expanded 0.3 percent from November, although this was still their best performance since last July. Wholesale trade (1.3 percent) registered the largest gain ahead of arts, entertainment & recreation (0.5 percent). Finance, insurance & real estate increased 0.4 percent but other advances were small and there were declines in accommodation and food (0.3 percent), public administration (0.2 percent) and retail (0.1 percent).
Economic data were mixed last week as many manufacturing PMIs disappointed showing slower growth for some — and contraction for others, especially in Europe. Fed Chairman Bernanke testified that the economy was growing, but slower than the Fed would like. Europe crept closer to delivering the tranche of bailout funds to Greece.
Many central banks will meet this week but most will leave their monetary policy unchanged. The deluge of new economic data continues this week. The highlight comes Friday with the U.S. employment situation report.
| Central Bank activities |
|
| March 6 |
Australia |
Reserve Bank of Australia Monetary Policy Announcement |
| March 7, 8 |
UK |
Bank of England Monetary Policy Meeting |
| March 8 |
Eurozone |
European Central Bank Announcement |
|
Canada |
Bank of Canada Monetary Policy Announcement |
|
|
|
| The following indicators will be released this week... |
| Europe |
|
|
| March 6 |
Eurozone |
Gross Domestic Product (Q4.2011) |
| March 7 |
Germany |
Manufacturing Orders (January) |
| March 8 |
Germany |
Industrial Production (January) |
|
France |
Merchandise Trade (January) |
| March 9 |
Germany |
Merchandise Trade (January) |
|
France |
Industrial Production (January) |
|
Italy |
Industrial Production (January) |
|
UK |
Industrial Production (January) |
|
|
Producer Price Index (February) |
|
|
Merchandise Trade (January) |
|
|
|
| Asia/Pacific |
|
|
| March 7 |
Australia |
Gross Domestic Product (Q4.2011) |
| March 8 |
Australia |
Labour Market Survey (February) |
|
Japan |
Gross Domestic Product (Q4.2011 second estimate) |
| March 9 |
Australia |
Merchandise Trade Balance (January) |
|
China |
Consumer Price Index (February) |
|
|
Producer Price Index (February) |
|
|
Industrial Production (February) |
|
|
Retail Sales (February) |
|
|
|
| Americas |
|
|
| March 9 |
Canada |
Labour Force Survey (February) |
Anne D Picker is the author of International Economic Indicators and Central Banks.
|
