|
After a gloomy start, equity markets got a lift from signs that Europe was finally moving to support its flailing financial sector. Risk appetites improved as European leaders said they are considering further steps to shore up the banking system. The plethora of downgrades from Fitch and Moody’s had less of an impact on equities than on the euro. On the week, most equity indexes were positive.
There was a geographic divide in central bank actions last week. While the Reserve Bank of Australia and the Bank of Japan maintained their policies, the Bank of England and the European Central Bank eased to help their beleaguered banks. The BoE’s decision to expand its quantitative easing program (bigger and earlier than expected) and the ECB’s decision to aggressively provide liquidity to euro system banks were positive steps forward. Positive economic data — including an upside surprise on U.S. jobs — also helped.
|
|
2010 |
2011 |
% Change |
|
Index |
Dec. 31 |
Sep 30 |
Oct 7 |
Week |
Year |
| Asia/Pacific |
|
|
|
|
|
|
| Australia |
All Ordinaries |
4846.9 |
4070.1 |
4225.0 |
3.8% |
-12.8% |
| Japan |
Nikkei 225 |
10228.9 |
8700.3 |
8605.6 |
-1.1% |
-15.9% |
|
Topix |
898.8 |
761.2 |
741.6 |
-2.6% |
-17.5% |
| Hong Kong |
Hang Seng |
23035.5 |
17592.4 |
17707.0 |
0.7% |
-23.1% |
| S. Korea |
Kospi |
2051.0 |
1769.7 |
1759.8 |
-0.6% |
-14.2% |
| Singapore |
STI |
3190.0 |
2675.2 |
2640.3 |
-1.3% |
-17.2% |
| China |
Shanghai Composite |
2808.1 |
2359.2 |
* |
* |
-14.5% |
| |
|
|
|
|
|
|
| India |
Sensex 30 |
20509.1 |
16453.8 |
16232.5 |
-1.3% |
-20.9% |
| Indonesia |
Jakarta Composite |
3703.5 |
3549.0 |
3425.7 |
-3.5% |
-7.5% |
| Malaysia |
KLCI |
1518.9 |
1387.1 |
1400.1 |
0.9% |
-7.8% |
| Philippines |
PSEi |
4201.1 |
3999.7 |
4009.3 |
0.2% |
-4.6% |
| Taiwan |
Taiex |
8972.5 |
7225.4 |
7212.0 |
-0.2% |
-19.6% |
| Thailand |
SET |
1032.8 |
916.2 |
909.2 |
-0.8% |
-12.0% |
| |
|
|
|
|
|
|
| Europe |
|
|
|
|
|
|
| UK |
FTSE 100 |
5899.9 |
5128.5 |
5303.4 |
3.4% |
-10.1% |
| France |
CAC |
3804.8 |
2982.0 |
3095.6 |
3.8% |
-18.6% |
| Germany |
XETRA DAX |
6914.2 |
5502.0 |
5675.7 |
3.2% |
-17.9% |
| Italy |
FTSE MIB |
20173.3 |
14836.3 |
15529.0 |
4.7% |
-23.0% |
| Spain |
IBEX 35 |
9859.1 |
8546.6 |
8798.4 |
2.9% |
-10.8% |
| Sweden |
OMX Stockholm 30 |
1155.6 |
910.2 |
918.3 |
0.9% |
-20.5% |
| Switzerland |
SMI |
6436.0 |
5531.7 |
5652.2 |
2.2% |
-12.2% |
| |
|
|
|
|
|
|
| North America |
|
|
|
|
|
|
| United States |
Dow |
11577.5 |
10913.4 |
11103.1 |
1.7% |
-4.1% |
|
NASDAQ |
2652.9 |
2415.4 |
2479.4 |
2.6% |
-6.5% |
|
S&P 500 |
1257.6 |
1131.4 |
1155.5 |
2.1% |
-8.1% |
| Canada |
S&P/TSX Comp. |
13443.2 |
11623.8 |
11588.4 |
-0.3% |
-13.8% |
| Mexico |
Bolsa |
38550.8 |
33501.3 |
33005.1 |
-1.5% |
-14.4% |
| *Shanghai Composite closed for week |
|
|
|
|
|
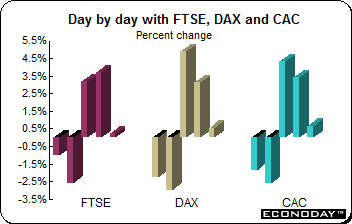 European stocks ended a second straight positive week with modest gains on Friday supported by hopes that political leaders are getting serious about containing the region's sovereign debt problems. Over the course of the week markets became increasingly convinced that Germany and others will build a firewall around the banking sector to be used in the event that a Greek default sparks wider contagion. A relatively upbeat U.S. jobs report helped to preserve buying interest ahead of the weekend. Investors were relieved to find that both the Bank of England and European Central Bank managed to find their separate ways of easing some financial market concerns. On the week, the FTSE, DAX and CAC were up 3.4 percent, 3.2 percent and 3.8 percent respectively. European stocks ended a second straight positive week with modest gains on Friday supported by hopes that political leaders are getting serious about containing the region's sovereign debt problems. Over the course of the week markets became increasingly convinced that Germany and others will build a firewall around the banking sector to be used in the event that a Greek default sparks wider contagion. A relatively upbeat U.S. jobs report helped to preserve buying interest ahead of the weekend. Investors were relieved to find that both the Bank of England and European Central Bank managed to find their separate ways of easing some financial market concerns. On the week, the FTSE, DAX and CAC were up 3.4 percent, 3.2 percent and 3.8 percent respectively.
The week began on a distinctly sour note with banks sinking as Greek authorities revealed that the country would be unable to meet its deficit reduction targets this year, piling further pressure on already fragile sentiment within the eurozone. Investors were worried about the ability of European banks to cope with a sovereign default and fund themselves in the market. This focused attention back on the ability and willingness of governments to support vulnerable lenders as they did in 2008 and 2009. However, equities reversed direction sharply on Wednesday on reports that European finance ministers were examining ways of coordinating large scale recapitalizations of banks on a local level in an attempt to convince markets that governments would do all they could to safeguard and support the European banking sector.
Ratings services were busy in Europe and the UK last week. Moody’s downgraded Italy’s government bond ratings by three notches to A2 from Aa2, with a negative outlook, citing material increase in long term funding risks for euro area sovereigns with high levels of public debt and UK and Portuguese banks on Friday. Fitch also downgraded Italy and added Spain to its list of downgrades after equity markets were closed here for the week.
Bank of England
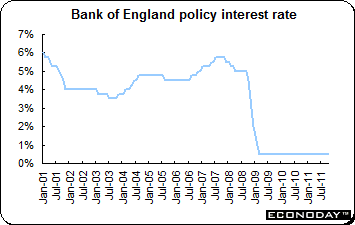 The Bank of England pulled the trigger on additional quantitative easing ahead of most expectations by announcing an extra Stg75 billion worth of asset sales. This lifts the target to Stg275 billion. The planned increase in purchases, the first since the previous Stg200 billion ceiling was announced in November 2009, will again be financed with central bank reserves and executed through the Asset Purchase Facility (APF) over the course of the next four months. The MPC left the bank rate unchanged at 0.5 percent where it has been since March 2009. The Bank of England pulled the trigger on additional quantitative easing ahead of most expectations by announcing an extra Stg75 billion worth of asset sales. This lifts the target to Stg275 billion. The planned increase in purchases, the first since the previous Stg200 billion ceiling was announced in November 2009, will again be financed with central bank reserves and executed through the Asset Purchase Facility (APF) over the course of the next four months. The MPC left the bank rate unchanged at 0.5 percent where it has been since March 2009.
The increase in the QE ceiling reflects the Bank's increasing concerns about the outlook for the domestic economy amid mounting evidence of slowing global growth. Excess capacity is seen higher than previously thought and while inflation is still projected to rise above 5 percent near-term, the CPI is also expected to fall back sharply in 2012. The Bank has an inflation target of 2 percent. Inflation has been above that level since December 2009.
The announcement means that, since unilaterally breaking ranks in October 2010, Adam Posen's longstanding call for extra QE has finally been answered. Speculation about more QE had been centered on the November MPC meeting as this would have tied in with the release of the BoE's quarterly Inflation Report so the move is not a complete surprise. How effective the new measures are remains to be seen but at least the initial response of the yield curve was to flatten around 10 basis points between 2-year and 30-year maturities. However, the decision initially sent the pound sterling sharply lower.
European Central Bank
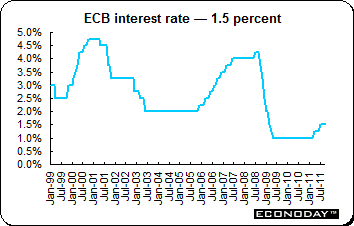 Talk of an emergency 50 basis point cut by the ECB proved wide of the mark as the Bank again opted to leave its policy interest rates on hold. The key refi rate stays at 1.5 percent with the rates on the deposit and marginal lending facilities pegged at 0.75 percent and 2.25 percent respectively. Talk of an emergency 50 basis point cut by the ECB proved wide of the mark as the Bank again opted to leave its policy interest rates on hold. The key refi rate stays at 1.5 percent with the rates on the deposit and marginal lending facilities pegged at 0.75 percent and 2.25 percent respectively.
However, the ECB signaled that it would be expanding its non-standard policy measures with a view to ensuring an adequate supply of liquidity and funds to the banking sector. The ECB announced its first one-year fixed rate tender (LTRO) with full allotment since December 2009. This will be conducted in October ahead of a 13-month LTRO in December. The main refinancing operations (MROs) will also continue to be undertaken on a fixed rate and full allotment basis through at least July next year and possibly longer.
The tone of the press conference which was decidedly downbeat with President Jean Claude Trichet emphasizing increased downside risks to economic growth at home and abroad. The 3.0 percent flash September inflation rate was attributed mainly to higher food and energy costs and the headline rate is seen falling back towards target in 2012. Risks to inflation were seen as balanced but since the upside reflected possible increases in VAT or state administered prices as part of budget deficit reduction measures, it would seem that a lower inflation scenario was viewed the more significant.
Thursday’s policy setting meeting was the last to be chaired by Trichet who will hand over the presidential reins to the current Bank of Italy Governor Mario Draghi at the start of next month. Draghi is expected to maintain the ECB's price stability credibility but financial markets will inevitably look closely for any hints of a softening in the central bank's typically hawkish inflation stance. To this end, Draghi may be reluctant to cut rates in November even if he feels the economic conditions warrant a move.
Overall, Trichet left the door open to a cut in ECB interest rates but, having increased rates as recently as July, the Bank does appear to be in a hurry to move. Still, assuming that economic news remains generally gloomy between now and then, financial markets will certainly be considering a full blown ease at the November 3rd meeting.
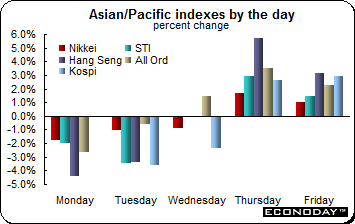 Despite rallies on Thursday and Friday, most Asia Pacific indexes were lower last week. The notable exceptions were the All Ordinaries and Hang Seng which were up 3.8 percent and 0.7 percent respectively. The change in attitude from negative at the beginning of the week to positive was the result of fresh optimism that Europe is ramping up efforts to shore up its financial system and prevent another global banking crisis. Friday’s advances followed on the heels of rallying equities in Europe and the U.S. thanks to better than expected economic data. Investors were also cheered by the new easing moves announced by the Bank of England and the European Central Bank on Thursday. Markets in China were closed for the Golden Week holidays. Despite rallies on Thursday and Friday, most Asia Pacific indexes were lower last week. The notable exceptions were the All Ordinaries and Hang Seng which were up 3.8 percent and 0.7 percent respectively. The change in attitude from negative at the beginning of the week to positive was the result of fresh optimism that Europe is ramping up efforts to shore up its financial system and prevent another global banking crisis. Friday’s advances followed on the heels of rallying equities in Europe and the U.S. thanks to better than expected economic data. Investors were also cheered by the new easing moves announced by the Bank of England and the European Central Bank on Thursday. Markets in China were closed for the Golden Week holidays.
Reserve Bank of Australia
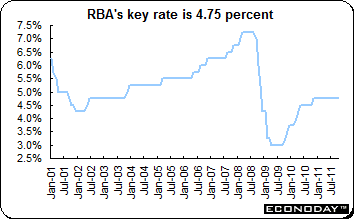 As widely expected, the Reserve Bank of Australia left its policy interest rate at 4.75 percent where it has been since November 2010. The RBA has been balancing inflation driven by resources investment and a stronger currency that has hurt manufacturing jobs and damaged confidence. As widely expected, the Reserve Bank of Australia left its policy interest rate at 4.75 percent where it has been since November 2010. The RBA has been balancing inflation driven by resources investment and a stronger currency that has hurt manufacturing jobs and damaged confidence.
The RBA signaled it has scope to lower its benchmark interest rate if necessary as inflation pressures ease. The Bank noted that inflation is more in line with its 2012-2013 target and will allow it to look to support demand. It said it would assess the inflationary outlook prior to its next meeting on November 1st. It also said that financial conditions have been unsettled with increased uncertainty about both the prospects for resolution of the sovereign debt and banking problems in Europe and for global economic growth.
Bank of Japan
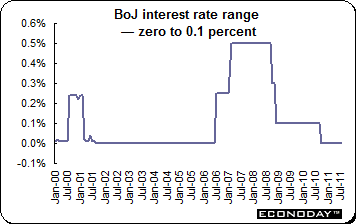 As expected, the Bank of Japan left its key interest rate range at zero to 0.1 percent. The vote was unanimous. In its statement, the BoJ said that the pace of overseas economic growth was slowing, but the underlying trend remains firm led by the emerging economies. In Japan activity has continued picking up in the aftermath of March’s earthquake and tsunami. Japan is expected to return to a mild growth path. The monetary policy board noted that the risks to growth stemmed from the European sovereign debt crisis and the affects of balance sheet adjustments in the U.S. For emerging markets, risks stem from inflationary pressure. The Bank’s loans to the earthquake hit areas were extended to April 30, 2012. As expected, the Bank of Japan left its key interest rate range at zero to 0.1 percent. The vote was unanimous. In its statement, the BoJ said that the pace of overseas economic growth was slowing, but the underlying trend remains firm led by the emerging economies. In Japan activity has continued picking up in the aftermath of March’s earthquake and tsunami. Japan is expected to return to a mild growth path. The monetary policy board noted that the risks to growth stemmed from the European sovereign debt crisis and the affects of balance sheet adjustments in the U.S. For emerging markets, risks stem from inflationary pressure. The Bank’s loans to the earthquake hit areas were extended to April 30, 2012.
On Friday, the Japanese cabinet outlined a supplemental budget of ¥12 trillion, or $155 billion, for the reconstruction of areas affected by the natural and nuclear disasters this year, the third such budget, and approved a plan to raise taxes temporarily to fund the effort. The latest emergency budget follows about ¥6 trillion already earmarked in two supplemental budgets this year. It includes money to help relocate survivors and create a fund to revitalize the economy of Fukushima Prefecture, which has been hit hard by the nuclear crisis.
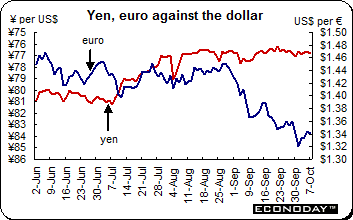 Despite its gyrations during the week, the euro edged down slightly against the U.S. dollar. It slid Friday against most of its counterparts after Fitch cut its ratings on Spain and Italy, highlighting the potential for region’s debt crisis to spread. Fitch cited factors including vulnerability to the “eurozone crisis.” Italy’s rating was cut to A+ from AA- while Spain’s rating was reduced two levels to AA- from AA+. The outlook for both is negative. The ratings company maintained a rating watch negative on Portugal, indicating the nation may still be cut to below investment grade. These moves followed Moody’s earlier in the week — they cut Italy as well along with 12 UK banks on Friday. Despite its gyrations during the week, the euro edged down slightly against the U.S. dollar. It slid Friday against most of its counterparts after Fitch cut its ratings on Spain and Italy, highlighting the potential for region’s debt crisis to spread. Fitch cited factors including vulnerability to the “eurozone crisis.” Italy’s rating was cut to A+ from AA- while Spain’s rating was reduced two levels to AA- from AA+. The outlook for both is negative. The ratings company maintained a rating watch negative on Portugal, indicating the nation may still be cut to below investment grade. These moves followed Moody’s earlier in the week — they cut Italy as well along with 12 UK banks on Friday.
The dollar pared losses against currencies such as the Australian dollar as demand increased for a refuge from the fallout of Europe’s debt crisis. Earlier on Friday, the euro and other higher yielding currencies gained after the better than anticipated U.S. employment report and investors shed safe haven assets. The pound sterling slumped against the dollar, euro and yen after the Bank of England reactivated its bond purchase program and kept its benchmark interest rate at a record low 0.5 percent to help revive the UK’s faltering economy. It was slightly lower against the dollar on the week.
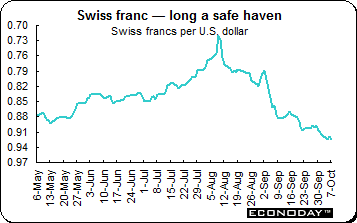 The Swiss franc weakened against most of its major counterparts after the Swiss National Bank said its foreign currency holdings increased to a record last month. Reserves jumped to 282.4 billion francs at the end of September from 253.4 billion francs the previous month. There was speculation that the SNB may impose further measures to contain its strength after imposing a ceiling on the franc for the first time in more than three decades on September 6, pledging to defend the target with the “utmost determination” and prompting a record drop in the currency. The Swiss franc weakened against most of its major counterparts after the Swiss National Bank said its foreign currency holdings increased to a record last month. Reserves jumped to 282.4 billion francs at the end of September from 253.4 billion francs the previous month. There was speculation that the SNB may impose further measures to contain its strength after imposing a ceiling on the franc for the first time in more than three decades on September 6, pledging to defend the target with the “utmost determination” and prompting a record drop in the currency.
Selected currencies — weekly results
|
|
2010 |
2011 |
% Change |
|
|
Dec 31 |
Sep 30 |
Oct 7 |
Week |
2011 |
| U.S. $ per currency |
|
|
|
|
|
|
| Australia |
A$ |
1.022 |
0.968 |
0.978 |
1.0% |
-4.3% |
| New Zealand |
NZ$ |
0.779 |
0.762 |
0.771 |
1.2% |
-1.0% |
| Canada |
C$ |
1.003 |
0.955 |
0.963 |
0.8% |
-4.0% |
| Eurozone |
euro (€) |
1.337 |
1.340 |
1.339 |
-0.1% |
0.1% |
| UK |
pound sterling (£) |
1.560 |
1.561 |
1.556 |
-0.3% |
-0.2% |
| |
|
|
|
|
|
|
| Currency per U.S. $ |
|
|
|
|
|
|
| China |
yuan |
6.607 |
6.381 |
6.360 |
0.3% |
3.9% |
| Hong Kong |
HK$* |
7.773 |
7.788 |
7.782 |
0.1% |
-0.1% |
| India |
rupee |
44.705 |
48.974 |
49.155 |
-0.4% |
-9.1% |
| Japan |
yen |
81.230 |
77.120 |
76.867 |
0.3% |
5.7% |
| Malaysia |
ringgit |
3.064 |
3.189 |
3.158 |
1.0% |
-3.0% |
| Singapore |
Singapore $ |
1.283 |
1.308 |
1.296 |
0.9% |
-1.1% |
| South Korea |
won |
1126.000 |
1178.100 |
1178.400 |
0.0% |
-4.4% |
| Taiwan |
Taiwan $ |
29.299 |
30.486 |
30.487 |
0.0% |
-3.9% |
| Thailand |
baht |
30.060 |
31.168 |
30.945 |
0.7% |
-2.9% |
| Switzerland |
Swiss franc |
0.934 |
0.906 |
0.927 |
-2.2% |
0.8% |
| *Pegged to U.S. dollar |
|
|
|
|
|
|
| Source: Bloomberg |
|
|
|
|
|
|
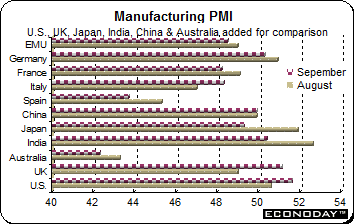 September manufacturing PMI reading was 48.5, a 25-month low and the second consecutive reading below the key 50 growth threshold. New export orders were down in all countries while backlogs fell by the largest amount since July 2009. At the same time, the new orders/finished goods ratio dropped for the seventh month running and now stands at its lowest level in almost 2 ½ years. Employment expanded but at its slowest rate in 15 months and would have fallen but for gains in Germany and, to a much lesser extent, the Netherlands. Regionally, national PMIs fell across the board with the only exception being Italy, although at 48.3 even this was below the EMU average. Germany (50.3) weighed in at a 24-month low, France (48.2) at a 26-month low and Spain (43.7) at a 27-month low. Germany was the only member state with a PMI above 50 and with Spain and Greece (43.2) seeing the steepest declines, the performance gap between the core and peripheral EMU economies will reinforce the current fault lines undermining the financial stability of the region as a whole. Price pressures eased in all states with input costs rising at their slowest pace since November 2009 and output prices at their weakest rate since they began increasing in April 2010. September manufacturing PMI reading was 48.5, a 25-month low and the second consecutive reading below the key 50 growth threshold. New export orders were down in all countries while backlogs fell by the largest amount since July 2009. At the same time, the new orders/finished goods ratio dropped for the seventh month running and now stands at its lowest level in almost 2 ½ years. Employment expanded but at its slowest rate in 15 months and would have fallen but for gains in Germany and, to a much lesser extent, the Netherlands. Regionally, national PMIs fell across the board with the only exception being Italy, although at 48.3 even this was below the EMU average. Germany (50.3) weighed in at a 24-month low, France (48.2) at a 26-month low and Spain (43.7) at a 27-month low. Germany was the only member state with a PMI above 50 and with Spain and Greece (43.2) seeing the steepest declines, the performance gap between the core and peripheral EMU economies will reinforce the current fault lines undermining the financial stability of the region as a whole. Price pressures eased in all states with input costs rising at their slowest pace since November 2009 and output prices at their weakest rate since they began increasing in April 2010.
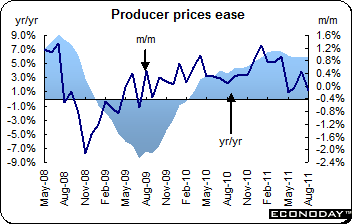 August producer prices (excluding construction) edged down 0.1 percent from their July level and were up 13.2 percent on the year. Consumer durables & nondurables along with capital goods prices increased 0.2 percent from July while intermediates were flat. Significantly, core prices edged up just 0.1 percent on the month to stand 3.9 percent higher on the year. National PPIs were well behaved in all of the four larger member states with prices in Germany and Spain 0.3 percent lower on the month, unchanged in France and up only 0.1 percent in Italy. The steepest decline was recorded in Greece (0.9 percent) and the strongest gain in Slovenia (0.2 percent). On an annual basis, Malta (0.8 percent) remained at the bottom of the PPI inflation ladder while the Netherlands (7.7 percent) was at the top. August producer prices (excluding construction) edged down 0.1 percent from their July level and were up 13.2 percent on the year. Consumer durables & nondurables along with capital goods prices increased 0.2 percent from July while intermediates were flat. Significantly, core prices edged up just 0.1 percent on the month to stand 3.9 percent higher on the year. National PPIs were well behaved in all of the four larger member states with prices in Germany and Spain 0.3 percent lower on the month, unchanged in France and up only 0.1 percent in Italy. The steepest decline was recorded in Greece (0.9 percent) and the strongest gain in Slovenia (0.2 percent). On an annual basis, Malta (0.8 percent) remained at the bottom of the PPI inflation ladder while the Netherlands (7.7 percent) was at the top.
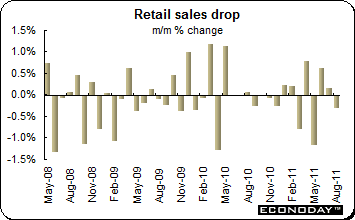 August retail sales posted a 0.3 percent monthly decline that more than reversed July's unrevised 0.2 percent increase. Annual sales growth was miserable, down 1.0 percent following a slightly steeper revised 0.4 percent drop at the start of the quarter. The latest figures left average purchases over July/August unchanged from their second quarter mean when they fell 0.3 percent against the previous period. In August alone, volumes were supported by the food, drink & tobacco sector where demand crept up 0.1 percent on the month. More worryingly, excluding fuel, non-food sales were off 0.6 percent. Regionally, the headline fall was led by Germany where purchases dropped 2.9 percent on the month. France followed a 0.1 percent increase in July with a 0.7 percent advance and Spain a 0.5 percent rise last time with a 0.1 percent gain. Elsewhere the picture was very mixed. August retail sales posted a 0.3 percent monthly decline that more than reversed July's unrevised 0.2 percent increase. Annual sales growth was miserable, down 1.0 percent following a slightly steeper revised 0.4 percent drop at the start of the quarter. The latest figures left average purchases over July/August unchanged from their second quarter mean when they fell 0.3 percent against the previous period. In August alone, volumes were supported by the food, drink & tobacco sector where demand crept up 0.1 percent on the month. More worryingly, excluding fuel, non-food sales were off 0.6 percent. Regionally, the headline fall was led by Germany where purchases dropped 2.9 percent on the month. France followed a 0.1 percent increase in July with a 0.7 percent advance and Spain a 0.5 percent rise last time with a 0.1 percent gain. Elsewhere the picture was very mixed.
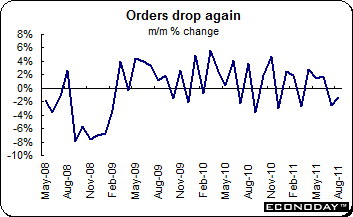 August manufacturing orders dropped 1.4 percent and were up 3.9 percent on the year. Orders were hit by weakness in the domestic market where demand fell 3.2 percent on the month. Within this, basics were off 2.4 percent, capital goods 3.8 percent and consumer & durable goods 4.0 percent. Over the last two months domestic orders fell 3.4 percent. Overseas orders edged up just 0.1 percent thanks to a 2.7 percent advance in the rest of the Eurozone. This reflected a 3.3 percent increase in basics and in consumer & durables. By contrast, non-EMU orders declined 1.8 percent from July. August manufacturing orders dropped 1.4 percent and were up 3.9 percent on the year. Orders were hit by weakness in the domestic market where demand fell 3.2 percent on the month. Within this, basics were off 2.4 percent, capital goods 3.8 percent and consumer & durable goods 4.0 percent. Over the last two months domestic orders fell 3.4 percent. Overseas orders edged up just 0.1 percent thanks to a 2.7 percent advance in the rest of the Eurozone. This reflected a 3.3 percent increase in basics and in consumer & durables. By contrast, non-EMU orders declined 1.8 percent from July.
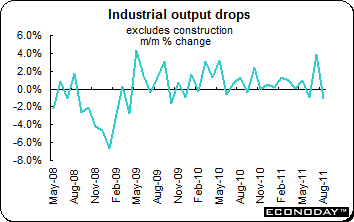 August industrial production dropped 1.0 percent on the month and was up 7.7 percent on the year. Outside of capital goods where output crept 0.2 percent higher on the month, all of the main sub-sectors posted declines. Consumer goods were especially weak, registering a 4.9 percent drop largely on the back of a 10.0 percent plunge in durables. Nondurable goods were down 3.8 percent. Intermediates followed a 2.3 percent gain in July with a 0.7 percent drop in mid-quarter while energy was off 1.8 percent and construction 1.2 percent. August industrial production dropped 1.0 percent on the month and was up 7.7 percent on the year. Outside of capital goods where output crept 0.2 percent higher on the month, all of the main sub-sectors posted declines. Consumer goods were especially weak, registering a 4.9 percent drop largely on the back of a 10.0 percent plunge in durables. Nondurable goods were down 3.8 percent. Intermediates followed a 2.3 percent gain in July with a 0.7 percent drop in mid-quarter while energy was off 1.8 percent and construction 1.2 percent.
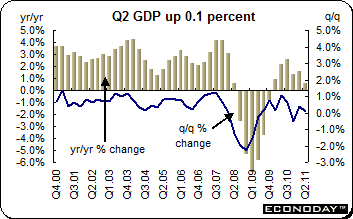 Final estimate of second quarter gross domestic product was revised downward to an increase of 0.1 percent when compared with the previous quarter. On the year, GDP growth was revised to 0.6 percent from 0.7 percent. The report incorporates new methodological procedures aimed at improving the accuracy of the figures as well as a new base year (2008 from 2006). It also provides the first, decidedly tardy, look at the GDP expenditure components. These revealed a disappointingly steep 0.8 percent quarterly contraction in household spending which also dropped 1.7 percent on the year. Gross fixed capital formation (1.7 percent) and general government consumption (1.1 percent) posted positive quarterly growth rates but total domestic expenditure still was up a modest 0.3 percent. Real foreign trade balance subtracted 0.3 percentage points off quarterly growth, a sharp turnaround from the 1.4 percentage point contribution made in the first quarter. In terms of output, the service sector grew 0.4 percent on the quarter (previously 0.5 percent) while industrial production declined 1.2 percent (down 1.6 percent). Within the latter, manufacturing output was revised to up 0.2 percent from a decline of 0.5 percent. Second quarter figures were distorted by a number of one-off factors (royal wedding, hot weather and Japanese tsunami) which are still thought to have subtracted about 0.5 percentage points from total output during the period. Final estimate of second quarter gross domestic product was revised downward to an increase of 0.1 percent when compared with the previous quarter. On the year, GDP growth was revised to 0.6 percent from 0.7 percent. The report incorporates new methodological procedures aimed at improving the accuracy of the figures as well as a new base year (2008 from 2006). It also provides the first, decidedly tardy, look at the GDP expenditure components. These revealed a disappointingly steep 0.8 percent quarterly contraction in household spending which also dropped 1.7 percent on the year. Gross fixed capital formation (1.7 percent) and general government consumption (1.1 percent) posted positive quarterly growth rates but total domestic expenditure still was up a modest 0.3 percent. Real foreign trade balance subtracted 0.3 percentage points off quarterly growth, a sharp turnaround from the 1.4 percentage point contribution made in the first quarter. In terms of output, the service sector grew 0.4 percent on the quarter (previously 0.5 percent) while industrial production declined 1.2 percent (down 1.6 percent). Within the latter, manufacturing output was revised to up 0.2 percent from a decline of 0.5 percent. Second quarter figures were distorted by a number of one-off factors (royal wedding, hot weather and Japanese tsunami) which are still thought to have subtracted about 0.5 percentage points from total output during the period.
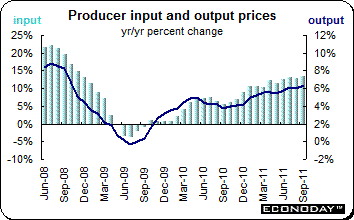 September producer output prices were up 0.3 percent and 6.3 percent on the year. At the same time, input prices jumped 1.7 percent and 17.5 percent on the year. Output prices were driven higher on the month by gains in most of the main sub-sectors. Petroleum products (0.7 percent) produced the strongest increase and were responsible for 0.1 percentage points of the overall monthly change, followed by computer and electrical & optical equipment (0.5 percent). Core prices matched the monthly headline rise which put underlying annual factory inflation at 3.8 percent, up 0.2 percentage points from August. The monthly increase in input prices was the largest since April and dominated by a 5.1 percent surge crude oil which alone accounted for 1.4 percentage points of the total gain. Other significant increases were seen in imported food materials (1.3 percent), imported parts & equipment (1.1 percent) and imported metals (0.8 percent). Home food materials (down 0.9 percent), fuel (down 0.2 percent) and other home produced materials (down 0.1 percent) all registered monthly declines. September producer output prices were up 0.3 percent and 6.3 percent on the year. At the same time, input prices jumped 1.7 percent and 17.5 percent on the year. Output prices were driven higher on the month by gains in most of the main sub-sectors. Petroleum products (0.7 percent) produced the strongest increase and were responsible for 0.1 percentage points of the overall monthly change, followed by computer and electrical & optical equipment (0.5 percent). Core prices matched the monthly headline rise which put underlying annual factory inflation at 3.8 percent, up 0.2 percentage points from August. The monthly increase in input prices was the largest since April and dominated by a 5.1 percent surge crude oil which alone accounted for 1.4 percentage points of the total gain. Other significant increases were seen in imported food materials (1.3 percent), imported parts & equipment (1.1 percent) and imported metals (0.8 percent). Home food materials (down 0.9 percent), fuel (down 0.2 percent) and other home produced materials (down 0.1 percent) all registered monthly declines.
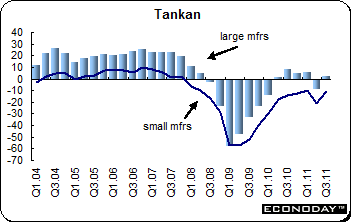 Third quarter Tankan showed sentiment improved in the third quarter. Large manufacturers’ sentiment improved from minus 9 to plus 2. The improvement reflected improved production and exports as supply side constraints in the aftermath of the March 11 earthquake and tsunami improved. Both have almost recovered to their pre-quake levels. The Tankan also continued to show a gap in sentiment between export-oriented manufacturers and other sectors dependent on domestic demand. Small manufacturers’ sentiment improved from minus 21 in the second quarter to minus 11 in the third. Nonmanufacturers’ sentiment improved as well. Large nonmanufacturers improved to a reading of plus 1 from minus 5 while small nonmanufacturers improved to minus 19 from minus 26. All firms see CAPEX up 0.2 percent in fiscal year 2011, unchanged from the second quarter. Large firms see CAPEX up 3 percent while small firms see it dropping 17.7 percent. The assumed dollar-yen exchange rate expected by major manufacturers this fiscal year is ¥81.15, according to the September Tankan, compared with an average ¥82.59 at the previous survey. The dollar traded at around ¥77.20 Monday in Tokyo. Third quarter Tankan showed sentiment improved in the third quarter. Large manufacturers’ sentiment improved from minus 9 to plus 2. The improvement reflected improved production and exports as supply side constraints in the aftermath of the March 11 earthquake and tsunami improved. Both have almost recovered to their pre-quake levels. The Tankan also continued to show a gap in sentiment between export-oriented manufacturers and other sectors dependent on domestic demand. Small manufacturers’ sentiment improved from minus 21 in the second quarter to minus 11 in the third. Nonmanufacturers’ sentiment improved as well. Large nonmanufacturers improved to a reading of plus 1 from minus 5 while small nonmanufacturers improved to minus 19 from minus 26. All firms see CAPEX up 0.2 percent in fiscal year 2011, unchanged from the second quarter. Large firms see CAPEX up 3 percent while small firms see it dropping 17.7 percent. The assumed dollar-yen exchange rate expected by major manufacturers this fiscal year is ¥81.15, according to the September Tankan, compared with an average ¥82.59 at the previous survey. The dollar traded at around ¥77.20 Monday in Tokyo.
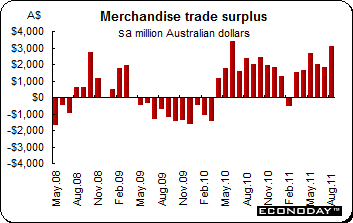 August trade surplus on goods and services was A$3.0 billion after recording a surplus of A$1.8 billion in July. Exports were up 8.0 percent on the month and 15.5 percent on the year. Non-rural goods were up 9.0 percent, non-monetary gold jumped 30 percent and rural goods advanced 6 percent. Services exports were down A$2 million. Imports were up 3.4 percent. Intermediate and other merchandise goods were up 7 percent, consumption goods were up 3 percent and non-monetary gold edged up 1 percent. Capital goods declined 3 percent. Services were up 3 percent. August trade surplus on goods and services was A$3.0 billion after recording a surplus of A$1.8 billion in July. Exports were up 8.0 percent on the month and 15.5 percent on the year. Non-rural goods were up 9.0 percent, non-monetary gold jumped 30 percent and rural goods advanced 6 percent. Services exports were down A$2 million. Imports were up 3.4 percent. Intermediate and other merchandise goods were up 7 percent, consumption goods were up 3 percent and non-monetary gold edged up 1 percent. Capital goods declined 3 percent. Services were up 3 percent.
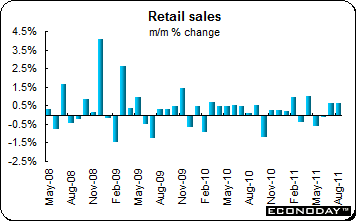 August retail sales were up 0.6 percent for the second month. Analysts had anticipated an increase of 0.3 percent. On the year, sales were up 2.1 percent. Household goods were up 1.7 percent while food retailing gained 0.6 percent. Sales in cafes, restaurants & takeaway food services were up 1.2 percent while other retailing was 0.3 percent higher. However department store sales dropped 0.8 percent and clothing, footwear & personal accessory retailing declined 0.3 percent. August retail sales were up 0.6 percent for the second month. Analysts had anticipated an increase of 0.3 percent. On the year, sales were up 2.1 percent. Household goods were up 1.7 percent while food retailing gained 0.6 percent. Sales in cafes, restaurants & takeaway food services were up 1.2 percent while other retailing was 0.3 percent higher. However department store sales dropped 0.8 percent and clothing, footwear & personal accessory retailing declined 0.3 percent.
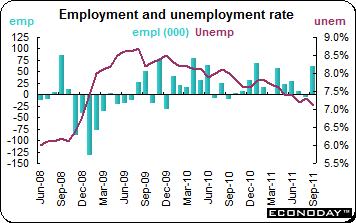 September employment jumped 60,900 — its best performance since January. The gain was large enough to reduce the jobless rate by 0.2 percentage points to 7.1 percent, its lowest level since December 2008. Full time positions surged 63,800 while part time were 2,900 lower. While public sector payrolls were up nearly 37,000 and the number of self-employed increased almost 39,000, the private sector headcount fell a disappointing 14,900. The goods producing sector created a modest 6,600 new jobs as respectable gains in construction (11,600) and natural resources (17,100) more than offset a 23,500 slump in manufacturing. Agriculture (2,100) and utilities (down 800) saw little change. With a hefty 54,200 advance, services dominated the overall increase in employment. However, gains were far from broad-based with solid increases in professional, scientific & technical services (35,600), education (38,400) and accommodation & food (30,700) contrasting sharply with steep declines in finance, insurance, real estate & leasing (35,300) and information, culture & recreation (21,500). There were also smaller declines in both retail (4,700) and transportation & warehousing (7,000). September employment jumped 60,900 — its best performance since January. The gain was large enough to reduce the jobless rate by 0.2 percentage points to 7.1 percent, its lowest level since December 2008. Full time positions surged 63,800 while part time were 2,900 lower. While public sector payrolls were up nearly 37,000 and the number of self-employed increased almost 39,000, the private sector headcount fell a disappointing 14,900. The goods producing sector created a modest 6,600 new jobs as respectable gains in construction (11,600) and natural resources (17,100) more than offset a 23,500 slump in manufacturing. Agriculture (2,100) and utilities (down 800) saw little change. With a hefty 54,200 advance, services dominated the overall increase in employment. However, gains were far from broad-based with solid increases in professional, scientific & technical services (35,600), education (38,400) and accommodation & food (30,700) contrasting sharply with steep declines in finance, insurance, real estate & leasing (35,300) and information, culture & recreation (21,500). There were also smaller declines in both retail (4,700) and transportation & warehousing (7,000).
Investors continued to look to European leaders to resolve the deepening sovereign debt and banking crises. The Bank of England and the European Central Bank took measures to ease the situation while the political process continued to slowly move ahead. U.S. employment report was one of several that were better than expected. That was not the case in Europe.
Most economic data this week concerns industrial output and international trade balances. In Australia, the important labour force report is on tap and in Japan private machine tool orders will be reported. There are no major central bank meetings scheduled.
| The following indicators will be released this week... |
| Europe |
|
|
| October 10 |
Germany |
Merchandise Trade (August) |
|
France |
Industrial Production (August) |
|
Italy |
Industrial Production (August) |
| October 11 |
UK |
Merchandise Trade (August) |
|
|
Industrial Production (August) |
| October 12 |
Eurozone |
Industrial Production (August) |
|
UK |
Labour Market Report (September) |
| October 14 |
Eurozone |
Harmonized Index of Consumer Prices (September final) |
|
|
Merchandise Trade (August) |
| |
|
|
| Asia/Pacific |
|
|
| October 12 |
Japan |
Private Machine Orders (August) |
| October 13 |
Japan |
Tertiary Sector Index (August) |
|
Australia |
Labour Market Report (September) |
| October 14 |
China |
Consumer Price Index (September) |
| |
|
Producer Price Index (September) |
| |
|
|
| Americas |
|
|
| October 13 |
Canada |
International Trade (August) |
| October 14 |
Canada |
Manufacturing Sales (August) |
Anne D Picker is the author of International Economic Indicators and Central Banks.
|
