The Bank of Japan surprisingly started the ball rolling Tuesday when it reintroduced its zero interest rate policy and expanded its already substantial quantitative easing programs. Equities celebrated and the yen, instead of falling as expected, climbed and is still climbing to new 15 year highs. The cacophony for the Federal Reserve to invoke QE2 grew in the buildup to Friday’s employment report, a report which didn't quiet the rhetoric or investors’ bets. Market players think that an aggressive push by the Federal Reserve to revive the U.S. economy could drive up inflation, with Treasury bond markets pricing in the effects of a return to emergency monetary easing next month. As stocks tumbled over the summer, many investors feared the U.S. could suffer a prolonged bout of Japanese-style deflation. The Fed’s message that it is determined to avoid this has led to the recalibration of inflation expectations.
The Reserve Bank of Australia, Bank of England and European Central Bank all left their policy interest rates unchanged at 4.5 percent, 0.5 percent and 1.0 percent respectively. Only the RBA intimated that further interest rate increases could be in its future.
The International Monetary Fund, as prelude to its fall meetings in Washington DC, released its latest world economic outlook. The IMF predicted that global GDP should expand by 4.8 percent this year — slower than in the boom before the financial crisis but well above the world’s underlying speed limit of around 4 percent. But the data hide a serious gap between the vitality of the big emerging economies, some of which have been sprinting along at close to 10 percent, and the sluggishness of many rich ones. Macroeconomic policy is also weirdly skewed. Many emerging economies are loath to let their currencies rise to reflect their vigor, even as fragile rich ones are embarking on austerity programs.
The G20/G7 is meeting as I write. On the table is the so called ‘currency wars’ where countries, in often unannounced intervention, try to force their currencies lower to be more competitive. Without any help, the U.S. dollar seems to be sinking the most. Some are pushing for a Plaza like accord that took place on September 22, 1985 between the Group of Five. At that time, there was an agreement between the governments of France, West Germany, Japan, the United States and the United Kingdom to depreciate the U.S. dollar in relation to the Japanese yen and German Deutsche Mark by intervening in currency markets. But conditions are vastly different now given the number of countries involved and not to mention today’s technology that allows transactions at warp speed.
|
|
2009 |
2010 |
% Change |
|
Index |
Dec 31 |
Oct 1 |
Oct 8 |
Week |
2010 |
| Asia/Pacific |
|
|
|
|
|
|
| Australia |
All Ordinaries |
4882.7 |
4634.7 |
4740.5 |
2.3% |
-2.9% |
| Japan |
Nikkei 225 |
10546.4 |
9404.2 |
9588.9 |
2.0% |
-9.1% |
|
Topix |
907.6 |
830.0 |
839.4 |
1.1% |
-7.5% |
| Hong Kong |
Hang Seng |
21872.5 |
22358.2 |
22944.2 |
2.6% |
4.9% |
| S. Korea |
Kospi |
1682.8 |
1876.7 |
1897.1 |
1.1% |
12.7% |
| Singapore |
STI |
2897.6 |
3130.9 |
3153.3 |
0.7% |
8.8% |
| China |
Shanghai Composite |
3277.1 |
2655.7 |
2738.7 |
3.1% |
-16.4% |
|
|
|
|
|
|
|
| India |
Sensex 30 |
17464.8 |
20445.0 |
20250.3 |
-1.0% |
15.9% |
| Indonesia |
Jakarta Composite |
2534.4 |
3547.1 |
3547.0 |
0.0% |
40.0% |
| Malaysia |
KLCI |
1272.8 |
1466.3 |
1481.4 |
1.0% |
16.4% |
| Philippines |
PSEi |
3052.7 |
4112.0 |
4237.0 |
3.0% |
38.8% |
| Taiwan |
Taiex |
8188.1 |
8244.2 |
8244.2 |
0.0% |
0.7% |
| Thailand |
SET |
734.5 |
978.6 |
963.2 |
-1.6% |
31.1% |
|
|
|
|
|
|
|
| Europe |
|
|
|
|
|
|
| UK |
FTSE 100 |
5412.9 |
5592.9 |
5657.6 |
1.2% |
4.5% |
| France |
CAC |
3936.3 |
3692.1 |
3763.2 |
1.9% |
-4.4% |
| Germany |
XETRA DAX |
5957.4 |
6211.3 |
6291.7 |
1.3% |
5.6% |
|
|
|
|
|
|
|
| North America |
|
|
|
|
|
|
| United States |
Dow |
10428.1 |
10829.7 |
11006.5 |
1.6% |
5.5% |
|
NASDAQ |
2269.2 |
2370.8 |
2401.9 |
1.3% |
5.9% |
|
S&P 500 |
1115.1 |
1146.2 |
1165.2 |
1.6% |
4.5% |
| Canada |
S&P/TSX Comp. |
11746.1 |
12363.1 |
12535.6 |
1.4% |
6.7% |
| Mexico |
Bolsa |
32120.5 |
33807.5 |
34464.8 |
1.9% |
7.3% |
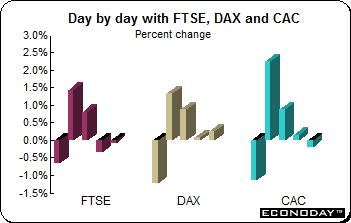 Stocks were up last week in Europe and the UK with the FTSE gaining 1.2 percent, the DAX advancing 1.3 percent and the CAC jumping 1.9 percent. All three indexes rallied Tuesday after the Bank of Japan’s easing moves. The FTSE was down three of five days while the DAX benefited from better than expected German August manufacturing orders and industrial output data. Stocks were down Friday, first in dread of the U.S. employment report and then in reaction to the report. However, a recovery in U.S. equities helped pull the three indexes north, with the DAX managing to close on a positive note. Stocks were up last week in Europe and the UK with the FTSE gaining 1.2 percent, the DAX advancing 1.3 percent and the CAC jumping 1.9 percent. All three indexes rallied Tuesday after the Bank of Japan’s easing moves. The FTSE was down three of five days while the DAX benefited from better than expected German August manufacturing orders and industrial output data. Stocks were down Friday, first in dread of the U.S. employment report and then in reaction to the report. However, a recovery in U.S. equities helped pull the three indexes north, with the DAX managing to close on a positive note.
Bank of England
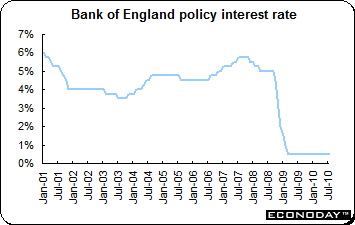 As expected, the Bank of England’s monetary policy committee voted to hold interest rates steady at 0.5 percent and retain its quantitative easing program to the £200 billion already committed. The MPC’s decision comes amid conflicting evidence, some of it suggesting the nation’s growth rate, which had burst higher, may now be sputtering. The latest ISM surveys of manufacturing — and to a lesser extent, services — imply that demand is now growing more slowly than earlier in the year. However inflation, as measured by the consumer price index, remains well above the Bank’s inflation target of 2 percent. The Bank of England as usual, made no statement after the meeting. Minutes will be published on October 20th. As expected, the Bank of England’s monetary policy committee voted to hold interest rates steady at 0.5 percent and retain its quantitative easing program to the £200 billion already committed. The MPC’s decision comes amid conflicting evidence, some of it suggesting the nation’s growth rate, which had burst higher, may now be sputtering. The latest ISM surveys of manufacturing — and to a lesser extent, services — imply that demand is now growing more slowly than earlier in the year. However inflation, as measured by the consumer price index, remains well above the Bank’s inflation target of 2 percent. The Bank of England as usual, made no statement after the meeting. Minutes will be published on October 20th.
One independent MPC member, Andrew Sentance, has voted in recent months for a 25 basis point increase to signal determination to head off the risk of an inflationary spiral. However, to other MPC members, the picture is one of growth that is too weak to create jobs or to boost asset values. Adam Posen, another independent MPC member, has called for a resumption of quantitative easing. He says that the failure to do so could snuff out the incipient economic recovery. Economic data are conflicting, but recent output and retail sales continue to point to growth.
European Central Bank
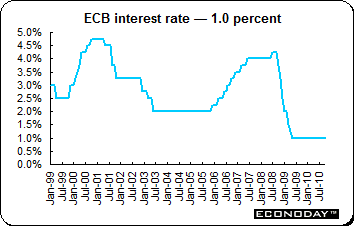 Also as expected, the European Central Bank left its main interest rate unchanged at 1 percent where it has been since May 7, 2009. Usually, the refi or minimum bid rate would be the lowest rate at which banks could seek ECB financing in competitive bidding at the ECB's main weekly refinancing operations. However, for now and until further notice, it is the rate at which those refinancing agreements are fixed for all bidders. The governing council also left the deposit rate or the floor for euro money market rates at 0.25 percent and the marginal lending rate or the ceiling at 1.75 percent. Also as expected, the European Central Bank left its main interest rate unchanged at 1 percent where it has been since May 7, 2009. Usually, the refi or minimum bid rate would be the lowest rate at which banks could seek ECB financing in competitive bidding at the ECB's main weekly refinancing operations. However, for now and until further notice, it is the rate at which those refinancing agreements are fixed for all bidders. The governing council also left the deposit rate or the floor for euro money market rates at 0.25 percent and the marginal lending rate or the ceiling at 1.75 percent.
The ECB wants to press ahead with an exit strategy to unwind exceptional measures taken after the collapse of Lehman Brothers two years ago. But the risk is that a stronger euro will choke off the economic recovery. With the U.S. and UK central banks mulling further quantitative easing steps to boost economic growth, the ECB’s more optimistic stance has pushed the euro sharply higher in relation to both the pound sterling and U.S. dollar. But the risk is that a stronger euro could choke off the recovery.
The strength of the eurozone’s economic recovery is not the only factor the ECB will have to consider. Some weaker eurozone banks — especially in the peripheral countries — remain ‘addicted’ to ECB liquidity. ECB President Jean Claude Trichet has urged national authorities to take action to strengthen such banks, but the ECB is also considering whether there are steps it could take itself to wean-off the most dependent banks.
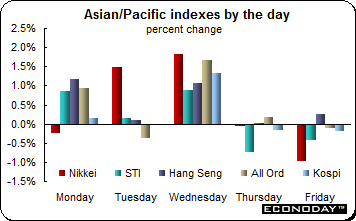 Stocks were up for the most part in this region. Only the Sensex and SET lost ground last week thanks primarily to profit taking. Stocks rallied after the Bank of Japan reverted to a zero interest rate policy (ZIRP), lowering its key interest rate to between zero and 0.1 percent. Investors were not deterred from buying equities even when the yen, in what will hit exporters, reached yet another 15 year high against the dollar. Stocks were up for the most part in this region. Only the Sensex and SET lost ground last week thanks primarily to profit taking. Stocks rallied after the Bank of Japan reverted to a zero interest rate policy (ZIRP), lowering its key interest rate to between zero and 0.1 percent. Investors were not deterred from buying equities even when the yen, in what will hit exporters, reached yet another 15 year high against the dollar.
The highlights of the week revolved around the Bank of Japan and Reserve Bank of Australia and what they did and did not do. The BoJ eased policy while the RBA maintained the status quo. Stocks rallied in both countries and indeed, the Japanese move invigorated stocks worldwide. In Australia the labour report was both good news and potentially bad news. The jump in employment, which was more than double analysts’ estimates, could lead to a renewal of the RBA’s series of rate increases.
Bank of Japan
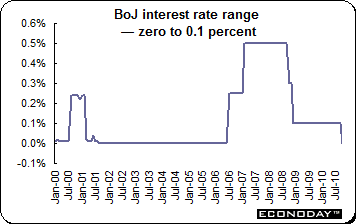 The Bank of Japan in its statement after its regularly scheduled meeting said it would now target an interest rate range of zero to 0.1 percent for overnight rates. The policy interest rate had been 0.1 percent since December 2008. The rate decision was unanimous. The Bank said it would keep interest rates at this level until price stability emerged. The Bank of Japan in its statement after its regularly scheduled meeting said it would now target an interest rate range of zero to 0.1 percent for overnight rates. The policy interest rate had been 0.1 percent since December 2008. The rate decision was unanimous. The Bank said it would keep interest rates at this level until price stability emerged.
The BoJ took three steps. First, it lowered its policy rate from 0.1 percent to a range between zero and 0.1 percent. That signals to the market — and to politicians that have been pressuring the Bank — that the BoJ cares. Second, the BoJ stated that it would maintain its virtual zero rate policy until there was price stability or until consumer prices increase by between zero and 2 percent a year. Third, the Bank said that it would consider establishing a program to buy public and private sector assets from banks — including commercial paper, corporate bonds and perhaps even exchange-traded funds and Japan real estate investment trusts. Since the financial crisis, Japan has continued to accept financial instruments as collateral in order to pump money into the system, but has not bought the assets. The initial amount under consideration is about ¥5 trillion, ¥3.5 trillion of which is for public-sector debt. That is on top of a sum of ¥30 trillion already budgeted for BoJ loans to banks.
Reserve Bank of Australia
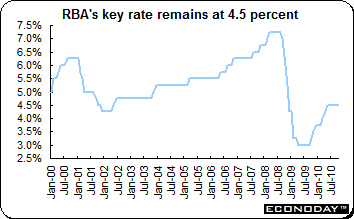 The Reserve Bank of Australia left its key interest rate at 4.5 percent for the fifth month stating that the current policy stance is appropriate. Many analysts expected the RBA to increase rates at this meeting and the Australian dollar had been rising in anticipation. While there are parts of the economy that are booming, others are not. Retail, construction, manufacturing, housing, and especially small business — not to mention households — have had a tough time. But the RBA said that higher rates are likely if the economy expands as anticipated. They would also be needed to keep inflation within the Bank’s 2 percent to 3 percent target range. Second quarter CPI was up 2.7 percent on the year. The next reading will be available prior to the RBA’s November policy meeting. The Reserve Bank of Australia left its key interest rate at 4.5 percent for the fifth month stating that the current policy stance is appropriate. Many analysts expected the RBA to increase rates at this meeting and the Australian dollar had been rising in anticipation. While there are parts of the economy that are booming, others are not. Retail, construction, manufacturing, housing, and especially small business — not to mention households — have had a tough time. But the RBA said that higher rates are likely if the economy expands as anticipated. They would also be needed to keep inflation within the Bank’s 2 percent to 3 percent target range. Second quarter CPI was up 2.7 percent on the year. The next reading will be available prior to the RBA’s November policy meeting.
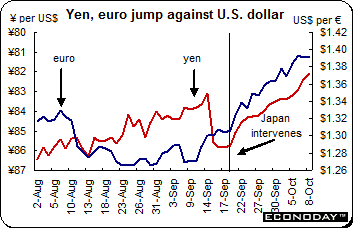 The dollar continued to tumble against all of its major trading partners as the prospect of the Federal Reserve introducing a second quantitative easing program sent traders fleeing from the currency. The commodity currencies — the Australian and Canadian dollars — are flirting with parity while the euro breeched the US$1.40 level midweek in intraday trading, an eight month low. As for the yen — rather than the Bank of Japan’s actions lowering the soaring yen, it continued to rise hitting new 15 year highs in the process. And the currency is continuing to rise even though traders are wary that the Japanese will intervene as they did on September 15th. However, the IMF meetings in Washington could have put a damper on possible intervention intentions given the charged atmosphere surrounding currency trading. The dollar continued to tumble against all of its major trading partners as the prospect of the Federal Reserve introducing a second quantitative easing program sent traders fleeing from the currency. The commodity currencies — the Australian and Canadian dollars — are flirting with parity while the euro breeched the US$1.40 level midweek in intraday trading, an eight month low. As for the yen — rather than the Bank of Japan’s actions lowering the soaring yen, it continued to rise hitting new 15 year highs in the process. And the currency is continuing to rise even though traders are wary that the Japanese will intervene as they did on September 15th. However, the IMF meetings in Washington could have put a damper on possible intervention intentions given the charged atmosphere surrounding currency trading.
Some strategists are suggesting that the dollar, like U.S. Treasuries yields, simply has no more room to fall. Traders are already quite bearish and it has been suggested that it would require another catalyst beyond QE2 to move it further as the stimulus effect is already priced into the dollar exchange rate. Traders are betting heavily that the Federal Reserve is about to renew quantitative easing once again in order to preserve the increasingly fragile U.S. recovery.
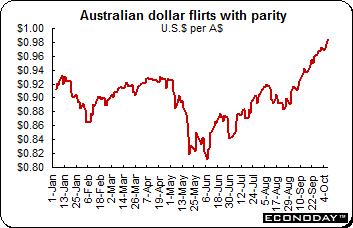 The Australian dollar reached a new modern day high Friday against its U.S. counterpart as broad U.S. dollar weakness and the Australia’s surging resource rich economy bring the two currencies closer together. Many forecasters now believe the Australian currency will rise to the US$1 level for the first time since it was allowed to float freely in 1983. The currency moves reflect persistent concerns over the U.S. economic outlook and a growing lack of confidence among traders that the Washington meetings of the IMF and Group of Seven leading industrial nations will result in a U.S. dollar rescue. The Australian dollar reached a new modern day high Friday against its U.S. counterpart as broad U.S. dollar weakness and the Australia’s surging resource rich economy bring the two currencies closer together. Many forecasters now believe the Australian currency will rise to the US$1 level for the first time since it was allowed to float freely in 1983. The currency moves reflect persistent concerns over the U.S. economic outlook and a growing lack of confidence among traders that the Washington meetings of the IMF and Group of Seven leading industrial nations will result in a U.S. dollar rescue.
The figures underscore Australia's position as one of the world's strongest developed economies, with pressure to contain demand at a time when many of its peers are toying with extending emergency stimulus measures to kick-start growth. The surging Australian dollar also could pressure policy makers to respond at a time when a growing number of governments are actively intervening to limit the appreciation of their currencies. Australia is unlikely to intervene in the forex market and has already endured wide fluctuations over the past two years. Politicians have avoided attempts to talk the Aussie lower, and the RBA too has remained relaxed, saying the currency's fluctuations play an important role in stabilizing the economy.
Selected currencies — weekly results
|
|
2009 |
2010 |
% Change |
|
|
Dec 31 |
Oct 1 |
Oct 8 |
Week |
2010 |
| U.S. $ per currency |
|
|
|
|
|
|
| Australia |
A$ |
0.898 |
0.973 |
0.986 |
1.3% |
9.8% |
| New Zealand |
NZ$ |
0.727 |
0.744 |
0.755 |
1.5% |
3.9% |
| Canada |
C$ |
0.955 |
0.980 |
0.989 |
0.9% |
3.5% |
| Eurozone |
euro (€) |
1.433 |
1.378 |
1.393 |
1.1% |
-2.8% |
| UK |
pound sterling (£) |
1.617 |
1.584 |
1.595 |
0.7% |
-1.3% |
|
|
|
|
|
|
|
| Currency per U.S. $ |
|
|
|
|
|
|
| China |
yuan |
6.827 |
6.685 |
6.671 |
0.2% |
2.3% |
| Hong Kong |
HK$* |
7.753 |
7.759 |
7.758 |
0.0% |
-0.1% |
| India |
rupee |
46.525 |
44.480 |
44.435 |
0.1% |
4.7% |
| Japan |
yen |
93.125 |
83.332 |
82.075 |
1.5% |
13.5% |
| Malaysia |
ringgit |
3.427 |
3.086 |
3.114 |
-0.9% |
10.0% |
| Singapore |
Singapore $ |
1.405 |
1.312 |
1.307 |
0.4% |
7.5% |
| South Korea |
won |
1164.000 |
1130.450 |
1120.150 |
0.9% |
3.9% |
| Taiwan |
Taiwan $ |
31.985 |
31.092 |
30.928 |
0.5% |
3.4% |
| Thailand |
baht |
33.400 |
30.185 |
29.930 |
0.9% |
11.6% |
| Switzerland |
Swiss franc |
1.035 |
0.975 |
0.964 |
1.2% |
7.4% |
| *Pegged to U.S. dollar |
|
|
|
|
|
|
| Source: Bloomberg |
|
|
|
|
|
|
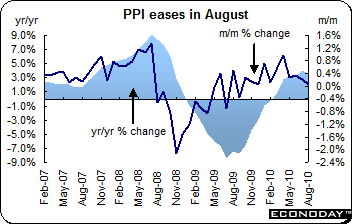 August producer prices excluding construction edged up 0.1 percent and were up 3.6 percent on the year. Prices were held in check by a 0.4 percent monthly decline in the cost of energy without which the PPI would have risen a marginally firmer 0.2 percent from July but still only 2.2 percent on the year. Among the other major sub-sectors, the only monthly advance of significance was in intermediates where prices were up 0.4 percent and 4.7 percent higher than in August 2009. Nondurable consumer goods saw a 0.2 percent monthly gain but durables edged up just 0.1 percent and capital goods prices slipped 0.1 percent. August producer prices excluding construction edged up 0.1 percent and were up 3.6 percent on the year. Prices were held in check by a 0.4 percent monthly decline in the cost of energy without which the PPI would have risen a marginally firmer 0.2 percent from July but still only 2.2 percent on the year. Among the other major sub-sectors, the only monthly advance of significance was in intermediates where prices were up 0.4 percent and 4.7 percent higher than in August 2009. Nondurable consumer goods saw a 0.2 percent monthly gain but durables edged up just 0.1 percent and capital goods prices slipped 0.1 percent.
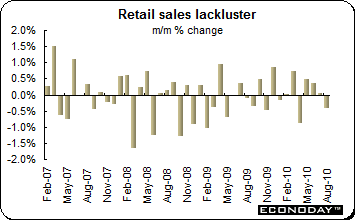 August retail sales slumped 0.4 percent following an unrevised gain of 0.1 percent in July. Annual weekday adjusted growth declined from 1.0 percent to 0.6 percent, its poorest performance since April. August data were biased down by a sizeable 0.7 percent monthly slide in purchases of food. Without this sector and omitting fuel, sales were up 0.3 percent after a 0.2 percent drop last time. Volumes fell on the month in both France (0.8 percent) and Germany (0.2 percent), the latter for the second successive month. No data are available for Italy and while Spain posted a welcome 1.1 percent increase, this failed to make up for the 3.0 percent nosedive in July prompted by the increase in VAT a month earlier. August retail sales slumped 0.4 percent following an unrevised gain of 0.1 percent in July. Annual weekday adjusted growth declined from 1.0 percent to 0.6 percent, its poorest performance since April. August data were biased down by a sizeable 0.7 percent monthly slide in purchases of food. Without this sector and omitting fuel, sales were up 0.3 percent after a 0.2 percent drop last time. Volumes fell on the month in both France (0.8 percent) and Germany (0.2 percent), the latter for the second successive month. No data are available for Italy and while Spain posted a welcome 1.1 percent increase, this failed to make up for the 3.0 percent nosedive in July prompted by the increase in VAT a month earlier.
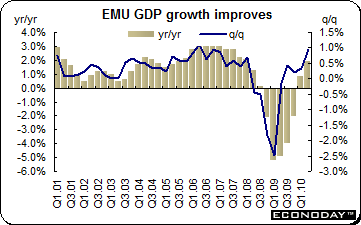 Second quarter real GDP expanded an unmodified 1.0 percent on the quarter and was up an unchanged 1.9 percent on its year ago level. However, the unrevised headline figures masked an appreciably less favorable balance to the composition of GDP. Private consumption was up just 0.2 percent on the quarter or less than half the 0.5 percent pace posted previously. Gross fixed capital formation was similarly revised downward, now estimated to have grown 1.5 percent from the original 1.8 percent reported in September. Quarterly growth in government spending is still put at 0.5 percent but the contribution of business inventories has been ratcheted up a notch to 0.3 percentage points. Net trade had a slightly more positive impact. Export volumes were up a marginally weaker amended 4.3 percent (previously 4.4 percent) but imports were shaded more to 4.0 percent (4.4 percent). As a result, the foreign trade sector added 0.1 percentage points to overall growth in contrast to the neutral impact seen earlier. Second quarter real GDP expanded an unmodified 1.0 percent on the quarter and was up an unchanged 1.9 percent on its year ago level. However, the unrevised headline figures masked an appreciably less favorable balance to the composition of GDP. Private consumption was up just 0.2 percent on the quarter or less than half the 0.5 percent pace posted previously. Gross fixed capital formation was similarly revised downward, now estimated to have grown 1.5 percent from the original 1.8 percent reported in September. Quarterly growth in government spending is still put at 0.5 percent but the contribution of business inventories has been ratcheted up a notch to 0.3 percentage points. Net trade had a slightly more positive impact. Export volumes were up a marginally weaker amended 4.3 percent (previously 4.4 percent) but imports were shaded more to 4.0 percent (4.4 percent). As a result, the foreign trade sector added 0.1 percentage points to overall growth in contrast to the neutral impact seen earlier.
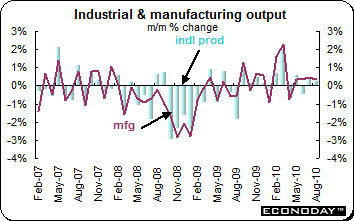
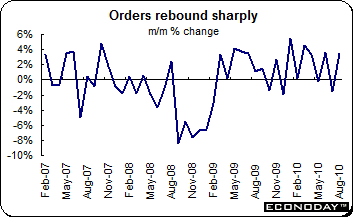 August manufacturing orders rose 3.4 percent on the month from a revised 1.6 percent drop in July. On the year, workday adjusted growth jumped from 18.4 percent to 20.3 percent. The bounce was dominated by the capital goods sector which posted a 6.7 percent monthly surge, easily more than offsetting a 4.8 percent slump at the start of the quarter. Other sectors were notably less robust with orders for basics edging up just 0.3 percent and consumer and durables off 3.9 percent. Domestic orders were down 0.5 percent with basis dropping 2.3 percent and consumer and durables declining 3.4 percent. Domestic orders for capital goods were up 2.0 percent after a 1.3 percent decline last time. Overseas demand jumped 6.6 percent from July, buoyed by the eurozone where orders leapt 13.8 percent as the capital goods sector recorded a massive 22.6 percent monthly advance. EMU basics also performed well, up 6.1 percent after a 4.4 percent gain last time. However, consumer and durable goods orders followed a 1.7 percent decline in July with a disappointingly steep 5.5 percent nosedive in mid-quarter. Non-EMU orders were up 1.5 percent on the month. The orders data are notoriously erratic and subject to sizeable revisions. August manufacturing orders rose 3.4 percent on the month from a revised 1.6 percent drop in July. On the year, workday adjusted growth jumped from 18.4 percent to 20.3 percent. The bounce was dominated by the capital goods sector which posted a 6.7 percent monthly surge, easily more than offsetting a 4.8 percent slump at the start of the quarter. Other sectors were notably less robust with orders for basics edging up just 0.3 percent and consumer and durables off 3.9 percent. Domestic orders were down 0.5 percent with basis dropping 2.3 percent and consumer and durables declining 3.4 percent. Domestic orders for capital goods were up 2.0 percent after a 1.3 percent decline last time. Overseas demand jumped 6.6 percent from July, buoyed by the eurozone where orders leapt 13.8 percent as the capital goods sector recorded a massive 22.6 percent monthly advance. EMU basics also performed well, up 6.1 percent after a 4.4 percent gain last time. However, consumer and durable goods orders followed a 1.7 percent decline in July with a disappointingly steep 5.5 percent nosedive in mid-quarter. Non-EMU orders were up 1.5 percent on the month. The orders data are notoriously erratic and subject to sizeable revisions.
 August industrial production jumped 1.7 percent and was up 10.7 percent on the year. Production was boosted by broad based gains among the major categories. In particular, output of capital goods surged 2.6 percent, more than wiping out a 1.0 percent monthly drop in July and durable consumer goods gained 2.4 percent. With intermediates expanding a solid 1.6 percent and consumer nondurables up 0.2 percent, overall manufacturing output climbed 1.8 percent. Energy sector activity jumped 1.2 percent but the construction area reported a 0.4 percent decline. August industrial production jumped 1.7 percent and was up 10.7 percent on the year. Production was boosted by broad based gains among the major categories. In particular, output of capital goods surged 2.6 percent, more than wiping out a 1.0 percent monthly drop in July and durable consumer goods gained 2.4 percent. With intermediates expanding a solid 1.6 percent and consumer nondurables up 0.2 percent, overall manufacturing output climbed 1.8 percent. Energy sector activity jumped 1.2 percent but the construction area reported a 0.4 percent decline.
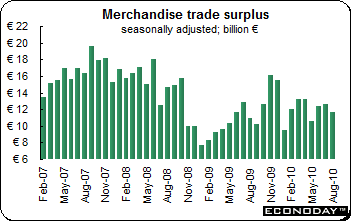 August seasonally adjusted merchandise trade surplus narrowed to €11.7 billion from a revised €12.6 billion surplus in July. In unadjusted terms the surplus was €9.0 billion, up €0.9 billion on its year ago level. The modest deterioration reflected a 0.4 percent drop on the month in nominal exports compounded by a 0.9 percent rise in imports. The dip in exports was the second in a row but follows a cumulative gain of more than 11 percent in May/June. Both sides of the balance sheet still show strong annual growth with exports up 26.8 percent and imports 29.2 percent higher. Within these 12-month rates, exports to the other EMU states rose 16.5 percent or less than half the rate of shipments to non-EU countries (40.8 percent). Imports from the rest of the Eurozone grew 22.7 percent on the year but were similarly dwarfed by a 37.9 percent jump in purchases from the rest of the non-EU world. August seasonally adjusted merchandise trade surplus narrowed to €11.7 billion from a revised €12.6 billion surplus in July. In unadjusted terms the surplus was €9.0 billion, up €0.9 billion on its year ago level. The modest deterioration reflected a 0.4 percent drop on the month in nominal exports compounded by a 0.9 percent rise in imports. The dip in exports was the second in a row but follows a cumulative gain of more than 11 percent in May/June. Both sides of the balance sheet still show strong annual growth with exports up 26.8 percent and imports 29.2 percent higher. Within these 12-month rates, exports to the other EMU states rose 16.5 percent or less than half the rate of shipments to non-EU countries (40.8 percent). Imports from the rest of the Eurozone grew 22.7 percent on the year but were similarly dwarfed by a 37.9 percent jump in purchases from the rest of the non-EU world.
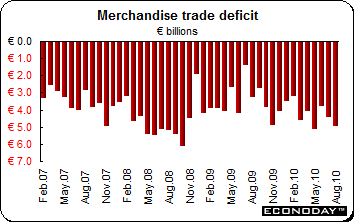 August merchandise trade shortfall widened to €4.93 billion from an upwardly revised €4.42 billion in July. The August deficit was the largest since May and lifted the cumulative red ink for the first eight months of the year to €33.67 billion, up almost 22 percent from the same period of 2009. The latest deterioration was due to a 2.4 percent increase on the month in nominal imports that more than offset a 1.2 percent advance in exports. Regionally, the bulk of the worsening was due to a widening in the bilateral shortfall with Asia (€3.4 billion from €3.0 billion) but the deficit with the other EMU members also increased by around €0.2 billion to €2.1 billion. The trade balance has not posted a surplus since the first quarter of 2004. August merchandise trade shortfall widened to €4.93 billion from an upwardly revised €4.42 billion in July. The August deficit was the largest since May and lifted the cumulative red ink for the first eight months of the year to €33.67 billion, up almost 22 percent from the same period of 2009. The latest deterioration was due to a 2.4 percent increase on the month in nominal imports that more than offset a 1.2 percent advance in exports. Regionally, the bulk of the worsening was due to a widening in the bilateral shortfall with Asia (€3.4 billion from €3.0 billion) but the deficit with the other EMU members also increased by around €0.2 billion to €2.1 billion. The trade balance has not posted a surplus since the first quarter of 2004.
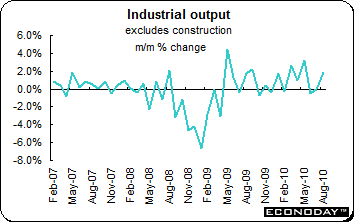
 August industrial production and manufacturing output both were up 0.3 percent to yield annual growth rates of 4.2 percent and 6.0 percent respectively. The 12-month gain in manufacturing was the best performance December 1994. The latest monthly manufacturing gain followed a slightly firmer revised 0.4 percent increase in July and put output over the three months to August up a healthy 0.7 percent. Output in this sector has now risen for four consecutive months. Nine of the manufacturing sub-sectors expanded production on the month and four registered declines. Particularly robust growth was seen in food (2.3 percent) and there were sizeable gains in both transport and the other manufacturing category. Declines were reported in paper, printing & publishing as well as in textiles & leather clothing and machinery & equipment. The monthly advance in overall industrial production also reflected a 0.4 percent gain in mining & quarrying together with 0.5 percent increase in oil & gas extraction, partially offset by a 0.3 percent slide in utilities. August industrial production and manufacturing output both were up 0.3 percent to yield annual growth rates of 4.2 percent and 6.0 percent respectively. The 12-month gain in manufacturing was the best performance December 1994. The latest monthly manufacturing gain followed a slightly firmer revised 0.4 percent increase in July and put output over the three months to August up a healthy 0.7 percent. Output in this sector has now risen for four consecutive months. Nine of the manufacturing sub-sectors expanded production on the month and four registered declines. Particularly robust growth was seen in food (2.3 percent) and there were sizeable gains in both transport and the other manufacturing category. Declines were reported in paper, printing & publishing as well as in textiles & leather clothing and machinery & equipment. The monthly advance in overall industrial production also reflected a 0.4 percent gain in mining & quarrying together with 0.5 percent increase in oil & gas extraction, partially offset by a 0.3 percent slide in utilities.
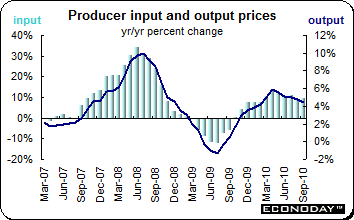 September output prices were up 0.3 percent and 4.4 percent on the year. At the same time input prices jumped 0.7 percent and soared 9.5 percent on the year. Core output prices were up 0.4 percent and 4.6 percent on the year. Output prices excluding duty were up 0.3 percent nudging its annual rate to 4.5 percent. Within total output prices, the main upward pressure stemmed from a 0.4 percent monthly increase in both chemicals and paper and a 1.0 percent jump in the other products category that alone boosted the index by almost 0.2 percentage points. Partial offsets were seen in food (down 0.2 percent) and petroleum products (down 0.1 percent). The spurt in input prices was led by a 3.4 percent leap in the cost of imported metals which added almost 0.3 percentage points to the monthly change. Other notable increases were seen in imported chemicals (1.2 percent), imported food materials (0.9 percent) and imported parts & equipment (0.9 percent). There was also a 1.1 percent increase in the other imported products area and a 0.6 percent gain in home food costs. Core input prices rose 0.7 percent on the month and were up 6.4 percent on the year. September output prices were up 0.3 percent and 4.4 percent on the year. At the same time input prices jumped 0.7 percent and soared 9.5 percent on the year. Core output prices were up 0.4 percent and 4.6 percent on the year. Output prices excluding duty were up 0.3 percent nudging its annual rate to 4.5 percent. Within total output prices, the main upward pressure stemmed from a 0.4 percent monthly increase in both chemicals and paper and a 1.0 percent jump in the other products category that alone boosted the index by almost 0.2 percentage points. Partial offsets were seen in food (down 0.2 percent) and petroleum products (down 0.1 percent). The spurt in input prices was led by a 3.4 percent leap in the cost of imported metals which added almost 0.3 percentage points to the monthly change. Other notable increases were seen in imported chemicals (1.2 percent), imported food materials (0.9 percent) and imported parts & equipment (0.9 percent). There was also a 1.1 percent increase in the other imported products area and a 0.6 percent gain in home food costs. Core input prices rose 0.7 percent on the month and were up 6.4 percent on the year.
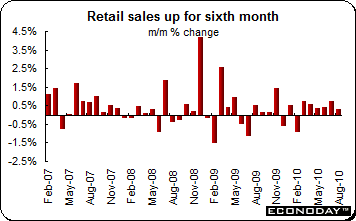 August seasonally adjusted retail sales were up 0.3 percent and were up 3.8 percent on the year. This was the sixth consecutive month that sales increased. Food sales were down 0.3 percent. Supermarket & grocery stores were down 0.4 percent while other specialized food swooned by 1.3 percent. However liquor retailing was up 1.2 percent. Household goods retailing was up 0.5 percent. Electrical & electronic goods were up 1 percent while furniture, floor coverings, housewares & textile goods climbed 0.9 percent. However, hardware, building & garden supplies were down 0.6 percent. Clothing, footwear & personal accessory sales sank 3.1 percent. Department store sales were up 0.6 percent. Other retailing was up 2.2 percent while pharmaceutical, cosmetic & toiletry goods retailing were up 1.3 percent and newspaper & book retailing advanced 2.6 percent. Cafes, restaurants & takeaway food services gained 1.5 percent. August seasonally adjusted retail sales were up 0.3 percent and were up 3.8 percent on the year. This was the sixth consecutive month that sales increased. Food sales were down 0.3 percent. Supermarket & grocery stores were down 0.4 percent while other specialized food swooned by 1.3 percent. However liquor retailing was up 1.2 percent. Household goods retailing was up 0.5 percent. Electrical & electronic goods were up 1 percent while furniture, floor coverings, housewares & textile goods climbed 0.9 percent. However, hardware, building & garden supplies were down 0.6 percent. Clothing, footwear & personal accessory sales sank 3.1 percent. Department store sales were up 0.6 percent. Other retailing was up 2.2 percent while pharmaceutical, cosmetic & toiletry goods retailing were up 1.3 percent and newspaper & book retailing advanced 2.6 percent. Cafes, restaurants & takeaway food services gained 1.5 percent.
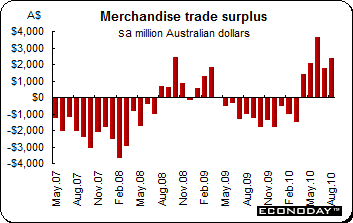 August merchandise trade surplus was A$2.35 billion, up from A$1.74 billion in July. Both exports and imports were down on the month. Exports were down 2.4 percent but imports dropped a much larger 5.1 percent. Exports of rural goods dropped 3 percent while exports of non-rural goods declined 1 percent. The main component contributing to the decline was metal ores and minerals which were down 10 percent. The decline was partly offset by increases in coal, coke and briquettes and other non-rural products. Imports of consumption goods were up 1 percent while capital goods imports dropped 3 percent. Contributing to the decline were civil aircraft and machinery and industrial equipment. August merchandise trade surplus was A$2.35 billion, up from A$1.74 billion in July. Both exports and imports were down on the month. Exports were down 2.4 percent but imports dropped a much larger 5.1 percent. Exports of rural goods dropped 3 percent while exports of non-rural goods declined 1 percent. The main component contributing to the decline was metal ores and minerals which were down 10 percent. The decline was partly offset by increases in coal, coke and briquettes and other non-rural products. Imports of consumption goods were up 1 percent while capital goods imports dropped 3 percent. Contributing to the decline were civil aircraft and machinery and industrial equipment.
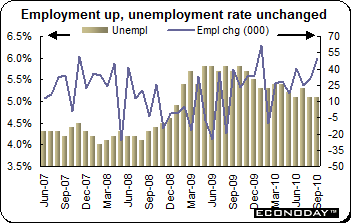 September employment increased by 49,500 to 11,324,900. Full-time employment increased 55,800 to 7,984,500 while part-time employment decreased 6,300 to 3,340,400. The unemployment rate remained steady at 5.1 percent even though the number of unemployed increased by 2,400 to 611,000. The number of persons looking for full-time work declined by 6,500 to 422,400 and the number of persons looking for part-time work increased by 8,900 to 188,600. The participation rate increased 0.2 percent to 65.6 percent. September employment increased by 49,500 to 11,324,900. Full-time employment increased 55,800 to 7,984,500 while part-time employment decreased 6,300 to 3,340,400. The unemployment rate remained steady at 5.1 percent even though the number of unemployed increased by 2,400 to 611,000. The number of persons looking for full-time work declined by 6,500 to 422,400 and the number of persons looking for part-time work increased by 8,900 to 188,600. The participation rate increased 0.2 percent to 65.6 percent.
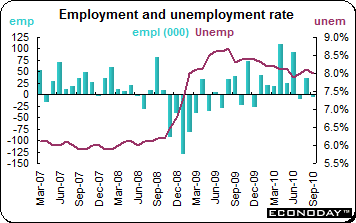 September employment declined by 6,600 jobs. However, with the labor force contracting some 24,400 the jobless rate still posted a misleadingly optimistic 0.1 percentage point dip to 8.0 percent. The headline employment figures were a little more robust than first appearances suggest since full time jobs were up a healthy enough 37,100. However, the increase here was more than offset by a 43,700 slump in part time positions. The number of private sector employees rose a modest 5,300 while the public sector payroll expanded a slightly larger 6,500. Self-employment declined 18,400. The fall in employment last month was concentrated in the services area where job losses amounted to 10,100. Within this, professional, scientific & technical services dominated with a 31,900 shakeout. There was also a sizable drop in educational services (9,800) and smaller declines in accommodation & food (5,400) and information, culture & recreation (3,900). Employment was up in transportation & warehousing (15,000) and in finance, insurance & real estate (12,400). There were some smaller gains elsewhere too. The goods production sector added 3,500 new jobs, mainly thanks to an 8,200 advance in manufacturing. Construction also saw a much needed bounce (4,800) while utilities were little changed (1,500). Losses in this sector were limited to natural resources (6,500) and agriculture (4,500). September employment declined by 6,600 jobs. However, with the labor force contracting some 24,400 the jobless rate still posted a misleadingly optimistic 0.1 percentage point dip to 8.0 percent. The headline employment figures were a little more robust than first appearances suggest since full time jobs were up a healthy enough 37,100. However, the increase here was more than offset by a 43,700 slump in part time positions. The number of private sector employees rose a modest 5,300 while the public sector payroll expanded a slightly larger 6,500. Self-employment declined 18,400. The fall in employment last month was concentrated in the services area where job losses amounted to 10,100. Within this, professional, scientific & technical services dominated with a 31,900 shakeout. There was also a sizable drop in educational services (9,800) and smaller declines in accommodation & food (5,400) and information, culture & recreation (3,900). Employment was up in transportation & warehousing (15,000) and in finance, insurance & real estate (12,400). There were some smaller gains elsewhere too. The goods production sector added 3,500 new jobs, mainly thanks to an 8,200 advance in manufacturing. Construction also saw a much needed bounce (4,800) while utilities were little changed (1,500). Losses in this sector were limited to natural resources (6,500) and agriculture (4,500).
Last week was dominated by central bank announcements. The Bank of Japan’s policy change certainly caught everyone’s attention. In Australia, employment continued to soar while analysts wonder why the Reserve Bank of Australia did not increase rates as most expected. Economic data were mixed with German manufacturing orders and industrial production rebounding smartly in August. While Australian employment continued to grow, U.S. employment continued to founder. Canadian headline employment loss exaggerated the healthy condition of the labour force there. Both the Bank of England and European Central Bank maintained the status quo.
Focus this week will be on earnings and how the weak August data may have affected results. In Europe, international trade and industrial output data are on the agenda. In the UK, trade and the all important labor force report will draw intense scrutiny. And in the U.S., market movers such as consumer and producer prices, retail sales, international trade and FOMC minutes will capture investor attention.
| The following indicators will be released this week... |
| Europe |
|
|
| October 11 |
France |
Industrial Production (August) |
|
Italy |
Industrial Production (August) |
|
UK |
Consumer Price Index (September) |
|
|
Merchandise Trade (August) |
| October 13 |
EMU |
Industrial Production (August) |
|
UK |
Labor Market Report (September) |
| October 15 |
EMU |
Harmonized Index of Consumer Prices (September) |
|
|
Merchandise Trade (August) |
|
Italy |
Merchandise Trade (August) |
|
|
|
| Asia/Pacific |
|
|
| October 14 |
Japan |
Corporate Goods Price Index (September) |
|
|
|
| Americas |
|
|
| October 14 |
Canada |
International Trade (August) |
| October 15 |
Canada |
Manufacturing Sales (August) |
Anne D Picker is the author of International Economic Indicators and Central Banks.
|
