Last week was one in which slipping only a little was a big victory. Bond markets and equity markets took on salvos from surprisingly strong inflation data, soft retail sales and mixed manufacturing reports, while trying to come to terms over the eventual impact of losses by subprime lenders. After the smoke cleared, the markets were down somewhat but had shown resilience.
Recap of US Markets
OIL PRICES
Oil prices fell through the $60 per barrel trading range floor with downward price pressure from a slowing economy and OPEC's willingness to keep production steady. A modest slide on Monday was due to forecasts for warmer weather in the U.S. Northeast. Weakness continued into Tuesday. On Wednesday, somewhat low distillate inventories nudged prices up on Wednesday. OPEC talk of keeping production steady pushed prices back down on Thursday and Friday. For the week, prices were down on a net basis, closing Friday at $57.11 per barrel - down $2.94 per barrel from the prior Friday close.

STOCKS
Equities fell last week, declining in three of the last four weeks. They started off positively, however, with bargain hunters pushing up prices and with lower oil prices also providing support. But equities fell across the board on Tuesday based on weak retail sales raising fears of a soft economy and weak revenues. A report by the Mortgage Bankers Association on rising delinquencies among those with highest credit boosted concern about the economy. Wednesday was an extremely volatile session with the Dow down 130 points early in the afternoon. Concern over subprime fallout was the major issue. Stocks rebounded later in the afternoon to generally end up on the plus side with a key factor being investors seeing stocks as oversold. Techs led the rebound, however. Thursday saw broad gains with support from declining oil prices easing inflation concerns and merger activity boosting equities. Stocks continued to retrench Friday on concern over subprime issues and weak economic growth.

Last week, the Dow was down 1.4 percent; the S&P 500, down 1.1 percent; the Nasdaq, down 0.6 percent; and the Russell 2000, down, 0.8 percent.
Year-to-date, major indexes are still down. The Dow is down 2.8 percent; the S&P500, down 2.2 percent; the Nasdaq, down 1.8 percent; and the Russell 2000 is down 1.1 percent.
BONDS
Interest rates eased net for last week. Rates dipped on Monday over fears over how much weakness in subprime lending would spread. Weak retail sales and the Mortgage Bankers Association report on rising foreclosers on Tuesday pushed rates down the most during the week with some notes down double digit basis points for the day. Wednesday saw a mild rebound in rates as money flowed into equities late in the day. Rates edged up on Thursday and Friday over inflation concerns from strong PPI and CPI data. On Friday, industrial production came in above expectations, also nudging up rates.
Net for the week the Treasury yield curve was down moderately. Yields were down as follows: 3-month T-bill, down 6 basis points; 2-year Treasury note, down 8 basis points; 3-year, down 8 basis points; 5-year, down 7 basis points; the 10-year bond, down 4 basis points; and the 30-year bond, down 2 basis points.

Net for the week, the markets focused more on weak manufacturing surveys, weak retail sales, and delinquency rates than on the strong inflation numbers. Rates fell and reversed most of last week's increases except for the 30-year Treasury bond which eased less.

Markets at a Glance

Weekly percent change column reflects percent changes for all components except interest rates. Interest rate changes are reflected in simple differences.
The Economy
Last week provided another round of data on key inflation indicators as well as on the health of the consumer sector and manufacturing. Inflation news was not good. The core PPI reversed up while the core CPI remained above the Fed's comfort zone. Manufacturing was mixed while the consumer was soft but the data were questionable.
Producer prices head in the wrong direction
The producer price report is what rattled the markets initially last week on the inflation front. Producer prices rebounded a sharp 1.3 percent in February, following a 0.6 percent drop the prior month. A spike from energy was expected but the core rate firmed to a 0.4 percent boost in February, following a 0.2 percent increase in January. The jump in the core was well above the market expectation for a 0.2 percent boost.

The year-on-year rate for the overall PPI jumped to up 2.6 percent from up 0.2 percent in January. The year-on-year core rate was unchanged in February at up 1.8 percent.

For the overall PPI, strength was in both energy and food. Energy gains were led by gasoline, home heating oil, and residential gas. Consumer food prices continued to be hurt by earlier freezes in California as fresh fruit prices jumped 15.7 percent and fresh & dried vegetables increased 8.3 percent.
Although the core PPI was up 0.4 percent for February special factors indicate that markets may have overreacted to the jump. The February increase in the core PPI was led by a 4.1 percent jump in prices for tobacco products and a 1.7 percent increase in light trucks.
Consumer price inflation meets expectations but remains high
In February, the consumer price index firmed to a 0.4 percent increase, following a 0.2 percent increase in January. The partial good news is that the core CPI slowed to a 0.2 percent increase in February, following a 0.3 percent rise in January. The core rate was in line with market expectations.

The problem, however, is that CPI inflation remains too high and is not making progress toward being in the Fed's implicit comfort zone of 1 to 2 percent core inflation. Year-on-year, the overall CPI is at 2.4 percent, up from to 2.1 percent in January while the core is at 2.7 percent, unchanged from January.
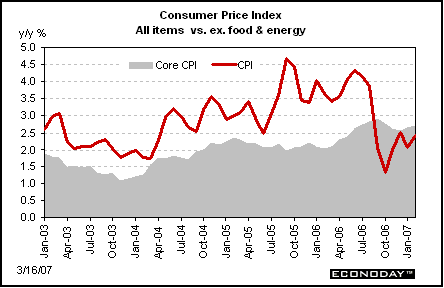
While the core rate is what markets focus on for Fed policy considerations, food and energy remain important. The Fed even states the issue in terms of secondary effects on the core rate. Upward or downward trends in food and energy eventually feed into the core in the long run as cost factors. February numbers for the non-core components were not favorable. Energy prices jumped 0.9 percent, following a 1.5 percent dip in January with piped gas & electricity and gasoline being the chief culprits. Food and beverages also provided significant price pressure with a 0.8 percent hike, following a 0.7 percent jump in January. Leading the increase were fruits & vegetables with a 4.7 percent monthly surge - both still affected by the earlier freezes in California.
Components in the core CPI generally showed upward price pressure. Housing was up 0.4 percent in February with the important owners' equivalent rent up 0.3 percent, following a 0.2 percent rise in January. Medical insurance slowed but not by a lot with a 0.5 percent increase in February, following a first of the year spike of 0.8 percent. Prescription drug prices typically increase in January and are hard to seasonally adjust. It now appears that the medical care component is a significant problem for the core rate in addition to owners' equivalent rent being upwardly sticky.
The bottom line is that we have had two months of reversal of the improvement seen in the core CPI during the latter part of 2006.
Import prices help - but not enough
Import prices rose 0.2 percent in February, following a 0.9 percent drop the prior month. Excluding petroleum, import prices slipped 0.1 percent in both February and January. Price pressures are not being imported although oil prices have risen since these import numbers were compiled.
However, two facts stand out that markets have ignored on the import price inflation front. First, the consumer portion of import prices is on the high side. While import prices for consumer goods excluding autos were flat in February, they rose 0.3 percent in January and are up 1.4 percent in February on a year-on-year basis. While this does not appear significant, it is quite a contrast to being down about 1-1/2 percent as was the case during 2003 when the core CPI was within the Fed's target zone. This is the second fact missed by many - import price inflation is nowhere near where it needs to be to really help bring down core inflation.

Nonpetroleum import prices are up 2.1 percent on a year-on-year basis in February - up from 1.5 percent in January.

Manufacturing surveys show price pressure
Rounding out last week's inflation data were the price indexes in the Philly and New York Feds' manufacturing surveys. Three of the four indexes rose in February.

Prices paid rose in both surveys while prices received jumped in the Philly survey but edged down in the Empire State report.

Retail sales soften in February
The consumer sector is important for keeping the economy on a moderate growth path. Personal consumption is about two-thirds of GDP and retail sales is about half of that. But the last two months have been soft as retail sales edged up 0.1 percent in February, following no change in January. The markets saw the numbers as indicating that the economy is too weak. The ex-autos numbers corroborated this view with a decline of 0.1 percent in February, following a 0.2 percent gain in January. Additionally, excluding both gas station and motor vehicles components, retail sales edged down 0.3 percent in February, following a 0.3 percent gain in January. But the key point is that weather probably pulled the numbers down as severe winter weather kept consumers indoors in parts of the U.S. The February retail sales numbers simply are not reliable.
Year-on-year, overall retail sales in February were up 3.2 percent, rising from up 2.2 percent in January. Excluding motor vehicles, February's year-on-year sales were up 3.1 percent, unchanged from the prior month. Excluding motor vehicles and gas station sales, year-on-year sales in February were up 3.4 percent - down from up 3.9 percent in January.

Year-on-year, overall retail sales in February were up 3.2 percent, rising from up 2.2 percent in January. Excluding motor vehicles, February's year-on-year sales were up 3.1 percent, unchanged from the prior month. Excluding motor vehicles and gas station sales, year-on-year sales in February were up 3.4 percent - down from up 3.9 percent in January.

Manufacturing is mixed
Philly and Empire State surveys show sluggish manufacturing and price pressures
Last week's manufacturing data included two regional surveys as well as overall industrial production. The Empire State and Philly Fed surveys came in flat while the broader industrial production numbers were moderately healthy.

The Philly Fed overall index remained near the break even point in February, coming in at 0.2 versus 0.6 in January. The Empire State index slowed sharply to 1.85 in February from 24.35 the prior month.
Overlooked by the markets, however, was a special report in the Philly release. The Philly report had a special, nonrecurring question regarding what percentage change the respondents expect in production for the second quarter over the first quarter. Over 30 percent expect an increase of more than 4 percent. Both surveys show moderately healthy levels for six-month out overall indexes.
Industrial production gets a jolt from utilities and manufacturing advances, too
Markets welcomed a jump in industrial production in February even though most of the strength was in utilities output. Overall industrial production rebounded 1.0 percent in February, following a 0.3 percent decline in January. Importantly, manufacturing output increased 0.4 percent, following a 0.5 percent drop in January. For February, mining output edged up 0.1 percent while utilities output surged 6.7 percent.
Most of the strength in manufacturing in February was in durables. Durables output rebounded 0.8 percent in February, following a 0.9 percent drop the prior month. Nondurables slipped 0.2 percent, following a 0.1 percent dip in January.
Inventories show slowing in demand
Business inventories appear to be becoming a mild problem. Inventories were up 0.2 percent in January though sales were going lower, down 0.7 percent. This pushed the inventory-to-sales ratio up 2 tenths to 1.30. Without a pickup in sales, we are likely to see modest growth in manufacturing in the near term. However, some of the inventory adjustment will be pushed onto foreign producers as imports will slow.

The bottom line
The economy is not as weak as many fear and is likely still on a moderate growth path. However, inflation is remaining stubbornly high. The Fed clearly is on hold. This coming week's FOMC meeting certainly will entertain a lively debate within the Fed on the balance between risks of too slow economic growth and inflation that is not staying on schedule for easing.

Looking Ahead: Week of March 19 through March 23
Looking ahead, this week has only a few indicators - mainly focusing on housing - plus the FOMC announcement.
Tuesday
Housing starts fell in January following an artificial boost in December from unseasonably warm weather. January housing starts declined 14.3 percent to a 1.408 million annual rate after a 5.0 percent boost in December. In contrast to December's warm weather, February experienced severe weather in some parts of the country which may cause a temporary drop in starts.
Housing starts Consensus Forecast for February 07: 1.450 million-unit rate
Range: 1.380 million to 1.525 million-unit rate
Wednesday
The FOMC announcement for the March 20-21 FOMC policy meeting is due out Wednesday afternoon. The Fed has kept the fed funds target rate unchanged at 5-1/4 percent since the last 25 basis point increase at the June 2006 meeting. Few expect the Fed to actually cut rates this meeting but prior to last week's strong inflation numbers a growing number were expecting the Fed to change from an anti-inflation bias to a neutral bias - the first step toward cutting rates. While the inflation numbers may have shaken that view, one should remember that the Fed has emphasized that it is making policy decisions not just on current data but also based on their forecasts. This means that market attention should still focus on any changes in the statement on the Fed's views of risks for inflation versus risks for too weak economic growth.
FOMC Consensus Forecast for 12/12/06 policy vote on fed funds target: unchanged at 5-1/4 percent
Range: 98 percent probability for no change versus 2 percent for a quarter point cut
Thursday
Initial jobless claims fell 12,000 in the week ending March 10 to 318,000, pointing to steady conditions in the labor market. The four-week average fell a sharp 10,250 in the week but to a 329,250 level that is still on the high side. Another low number for claims would suggest a rebound in March employment growth.
Jobless Claims Consensus Forecast for 3/17/07: 322,000
Range: 315,000 to 330,000
The Conference Board's index of leading indicators rose 0.1 percent in January, following a 0.6 percent boost in December. This index has been consistent with sluggish economic growth for some time and has yet to outright point to a pending recession.
Leading indicators Consensus Forecast for February 07: -0.5 percent
Range: -0.6 to 0.0 percent (flat)
Friday
Existing home sales rose 3.0 percent in January to an annual rate of 6.46 million and followed a 0.3 percent increase in December. Sales nonetheless remain soft with sales still down 4.3 percent on a year-on-year basis. The debate over whether housing has turned continues - especially since new home sales for January went in the opposite direction as existing home sales, falling 16.6 percent for the month. For both existing and new home sales, supply is a concern for the markets. Supply for existing home sales improved to 6.6 months in January. The usual caveat for housing data in winter applies - seasonal adjustment is difficult and minor deviations from seasonal averages can lead to large swings in seasonally adjusted data. We may see this in February housing numbers across the board due to atypically severe weather in some parts of the U.S.
Existing home sales Consensus Forecast for February 07: 6.26 million-unit rate
Range: 6.19 to 6.50 million-unit rate

