|
The Bank of England moved markets Thursday morning when it announced that it would expand its quantitative easing program. Most anticipated that the monetary policy committee would once again say that they were waiting to see results of its £125 billion gilt purchases. Instead they said they would purchase £50 billion more. Despite better economic news, the MPC’s view of the economy was decidedly dour. Gilts and equities were up while sterling sank after the announcement. In contrast, the European Central Bank provided no surprises as it left its key interest rate unchanged at 1 percent and said rates remained at an “appropriate” level. However, it looks increasingly likely that Australia will be among the first nations to raise interest rates in the current cycle after data showed an unexpected increase in employment last month.
Investors were severely tested last week as new data releases went into overdrive and threatened data poisoning. Manufacturing orders, industrial production and merchandise trade data for Germany were a mixed bag with orders soaring, industrial production ailing and the trade surplus increasing. And in the UK, industrial and manufacturing output pleasantly surprised while producer prices gave no hint of inflationary pressures. And in the U.S., Friday’s employment situation report vied with the BoE for attention. Investors were very nervous leading up to the report but were rewarded positively when job losses were less than expected and the unemployment rate actually inched down.
Asian equities were mixed while those in Europe, UK and North America were up on the week as earnings announcements continued virtually unabated.
Gold
Gold prices were up Friday as European central banks announced a new 400 tonne ceiling for bullion sales over the next five years — it is 100 tonnes below the current limit. Under the new agreement signatories to the Central Bank Gold Agreement, which includes most of the European central banks, agreed to drop the limit on annual sales from the current 500 tonnes from the end of next month. Total sales over the period would not exceed 2,000 tons. The agreement will also include planned gold sales from the International Monetary Fund’s bullion holdings. The Swiss National Bank, one of the world’s top 10 holders of the metal, also announced on Friday it had no plans to sell gold in the foreseeable future — it was a big seller earlier this decade and in the 1990s. Since 1999, European central banks have sold about 3,800 tonnes, reaping an estimated $56 billion.
|
|
2008 |
2009 |
% Change |
|
Index |
Dec 31 |
Jul 31 |
Aug 7 |
Week |
Year |
| Asia |
|
|
|
|
|
|
| Australia |
All Ordinaries |
3659.3 |
4249.5 |
4303.1 |
1.3% |
17.6% |
| Japan |
Nikkei 225 |
8859.6 |
10356.8 |
10412.1 |
0.5% |
17.5% |
|
Topix |
859.2 |
950.3 |
956.8 |
0.7% |
11.3% |
| Hong Kong |
Hang Seng |
14387.5 |
20573.3 |
20375.4 |
-1.0% |
41.6% |
| S. Korea |
Kospi |
1124.5 |
1557.3 |
1576.0 |
1.2% |
40.2% |
| Singapore |
STI |
1761.6 |
2659.2 |
2549.4 |
-4.1% |
44.7% |
| China |
Shanghai Composite |
1820.8 |
3412.1 |
3260.7 |
-4.4% |
79.1% |
|
|
|
|
|
|
|
| India |
Sensex 30 |
9647.3 |
15670.3 |
15160.2 |
-3.3% |
57.1% |
| Indonesia |
Jakarta Composite |
1355.4 |
2323.2 |
2349.1 |
1.1% |
73.3% |
| Malaysia |
KLSE Composite |
876.8 |
1174.9 |
1184.9 |
0.8% |
35.1% |
| Philippines |
PSEi |
1872.9 |
2798.3 |
2783.0 |
-0.5% |
48.6% |
| Taiwan |
Taiex |
4591.2 |
7077.7 |
6868.7 |
-3.0% |
49.6% |
| Thailand |
SET |
450.0 |
624.0 |
644.2 |
3.2% |
43.2% |
|
|
|
|
|
|
|
| Europe |
|
|
|
|
|
|
| UK |
FTSE 100 |
4434.2 |
4608.4 |
4731.6 |
2.7% |
6.7% |
| France |
CAC |
3218.0 |
3426.3 |
3521.1 |
2.8% |
9.4% |
| Germany |
XETRA DAX |
4810.2 |
5332.1 |
5459.0 |
2.4% |
13.5% |
|
|
|
|
|
|
|
| North America |
|
|
|
|
|
|
| United States |
Dow |
8776.4 |
9171.6 |
9370.1 |
2.2% |
6.8% |
|
NASDAQ |
1577.0 |
1978.5 |
2000.3 |
1.1% |
26.8% |
|
S&P 500 |
903.3 |
987.5 |
1010.5 |
2.3% |
11.9% |
| Canada |
S&P/TSX Comp. |
8987.7 |
10787.2 |
10885.3 |
0.9% |
21.1% |
| Mexico |
Bolsa |
22380.3 |
27043.5 |
28179.6 |
4.2% |
25.9% |
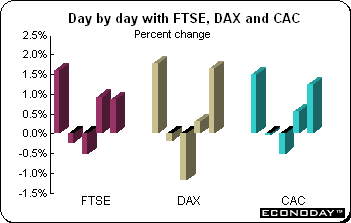 Stocks were up three of five days last week. And on Friday, when it looked as though stocks would drop again, the FTSE, CAC and DAX reversed course after the U.S. employment report indicated that job losses are lessening and the unemployment rate actually inched down. Stocks shrugged off banking sector weakness and welcomed signs that the economic downturn was softening. Earlier weakness was driven by the banks after underlying losses and rising bad debt at Royal Bank of Scotland cast a shadow over the recently buoyant sector. And earlier in the week, the FTSE rallied after the Bank of England shocked bank watchers and extended its quantitative easing program Stocks were up three of five days last week. And on Friday, when it looked as though stocks would drop again, the FTSE, CAC and DAX reversed course after the U.S. employment report indicated that job losses are lessening and the unemployment rate actually inched down. Stocks shrugged off banking sector weakness and welcomed signs that the economic downturn was softening. Earlier weakness was driven by the banks after underlying losses and rising bad debt at Royal Bank of Scotland cast a shadow over the recently buoyant sector. And earlier in the week, the FTSE rallied after the Bank of England shocked bank watchers and extended its quantitative easing program
In addition to the Bank of England and European Central Bank announcements on Thursday, the week was strewn with key data releases offering some mixed results. For the UK, both the manufacturing and services purchasing managers’ survey showed the best results since the beginning of 2008 while both industrial and manufacturing output were up as were housing prices. In Europe, the focus was on Germany where manufacturers’ orders soared but industrial production has yet to follow.
On the week the FTSE, CAC and DAX were up 2.7 percent, 2.8 percent and 2.4 percent respectively.
Bank of England moves markets…
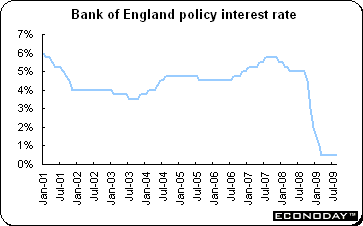 As expected the Bank of England left its key interest rate unchanged at 0.5 percent. But the Bank shocked analysts saying that it would extend its government bond buying program, raising the amount by £50 billion above the amount of £125 billion that has already been spent. The increase above the original £150 billion limit had been approved by Chancellor of the Exchequer Alistair Darling. The pound was down against both the euro and U.S. dollar after the announcement while gilts rallied (yields dropped) and the FTSE soared to a fresh high for the year. As expected the Bank of England left its key interest rate unchanged at 0.5 percent. But the Bank shocked analysts saying that it would extend its government bond buying program, raising the amount by £50 billion above the amount of £125 billion that has already been spent. The increase above the original £150 billion limit had been approved by Chancellor of the Exchequer Alistair Darling. The pound was down against both the euro and U.S. dollar after the announcement while gilts rallied (yields dropped) and the FTSE soared to a fresh high for the year.
The decision came after the MPC had opted not to increase the asset purchases at its two previous meetings, leading to speculation that the unprecedented program of cash injections into the UK economy had run its course. In July, the MPC had deferred any decision about the program until today’s meeting so it could consider it in light of its latest inflation forecast — the quarterly Inflation Report which will be released on August 13.
The decision is a sign that the Bank is worried that the nascent recovery is weaker than the market thinks it is and could peter out. Second quarter GDP contracted 0.8 percent and was much worse than forecast. That, combined with still tight credit for companies and individuals, may have encouraged the Bank to extend the QE. Weak money supply data show little evidence of improvement despite the purchases.
ECB does not
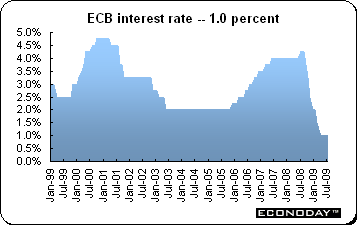 The European Central Bank as expected kept its interest rate at 1 percent as it waits to see the impact of efforts so far to revive the EMU economy and credit flows. Massive supplies of liquidity have pushed short-term interbank rates down below the 1 percent level. At its July governing council meeting, the ECB said it expected economic activity to remain weak for the rest of the year although the pace of decline was likely to ease. The European Central Bank as expected kept its interest rate at 1 percent as it waits to see the impact of efforts so far to revive the EMU economy and credit flows. Massive supplies of liquidity have pushed short-term interbank rates down below the 1 percent level. At its July governing council meeting, the ECB said it expected economic activity to remain weak for the rest of the year although the pace of decline was likely to ease.
The ECB decision is read by ECB President Jean Claude Trichet at the beginning of the press conference that follows each monetary policy meeting. At that time, the governing council’s decision is spelled out. The statement indicated that the eurozone economy may recover sooner than previously anticipated and signaled that the Bank is unlikely to provide any further stimulus. He said that rates are “appropriate” and policy makers are “satisfied” with their asset purchase program and measures to improve the flow of credit. With unemployment rising in Europe and consumer prices falling at the fastest pace on record, Trichet said the economy will remain weak this year and the ECB is taking a “prudent and cautious” approach.
Economic signals are mixed — purchasing managers surveys suggest the recession in the services and manufacturing sectors eased in July while economic sentiment rose to an eight month high. And the German manufacturing orders report gave evidence that the country’s economy is rebounding although industrial output remains weak. But eurozone unemployment is at record levels and retail sales fell again in June, underlying anemic consumer demand. Inflation is expected to remain well below the ECB’s inflation target of below but close to 2 percent going forward. The next ECB eurozone forecast will be in September.
Separately, the ECB announced it had bought more than €5 billion of covered bonds under a €60 billion program also intended to boost financial markets. But it expressed frustration over the impact on the market for bonds that were already trading. Covered bonds are issued by banks and backed by public sector loans and mortgages. Thursday’s meeting almost coincided with the second anniversary of the August 9, 2007 money market intervention by the ECB, which, to many, marked the start of the financial crisis. The ECB then injected €95 billion in overnight funds in an attempt to unblock markets.
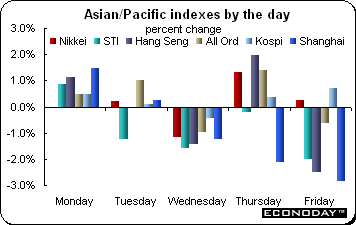 Asian/Pacific equities were mixed last week, thanks to a combination of profit taking, earnings reports and concerns about China’s monetary policy. Seven indexes were up while six were down. Gains ranged from 0.5 percent for the Nikkei to 3.2 percent for the SET. The PSEi was down 0.6 percent while the Shanghai Composite sank 4.4 percent. Economic data was primarily confined to Australia. Retail sales surprised and were down while the merchandise trade deficit increased. But the big news was the gain in employment as employers remain reluctant to fire workers after the extreme labor shortages that existed not too long ago. And Bank Indonesia lowered its policy interest rate by 25 basis points to 6.5 percent. Asian/Pacific equities were mixed last week, thanks to a combination of profit taking, earnings reports and concerns about China’s monetary policy. Seven indexes were up while six were down. Gains ranged from 0.5 percent for the Nikkei to 3.2 percent for the SET. The PSEi was down 0.6 percent while the Shanghai Composite sank 4.4 percent. Economic data was primarily confined to Australia. Retail sales surprised and were down while the merchandise trade deficit increased. But the big news was the gain in employment as employers remain reluctant to fire workers after the extreme labor shortages that existed not too long ago. And Bank Indonesia lowered its policy interest rate by 25 basis points to 6.5 percent.
On Friday, markets across Asia traded nervously as they awaited the U.S. employment report which would be released after markets in this part of the world would be closed. Profit taking after the recent rally and concerns about valuations following recent run-up in stocks affected sentiment across the region. The Nikkei ended the week at a new yearly closing high. However, the Sensex sank for a second day as worries that the recent rally outpaced fundamentals led to extensive profit taking amid caution ahead of the looming U.S. jobs report.
On Thursday, China’s stocks declined for a second day led by brokerages and commodities producers on speculation that the People’s Bank of China will tighten lending to avert equity and property bubbles after a run up of over $1,100 billion in new loans in the first half of the year. The PBoC said in a quarterly report that it would fine tune monetary policy where necessary and guide loan growth. Pressure on banks to exercise more caution had escalated in recent weeks. Chinese officials have sounded increasingly uneasy about asset bubbles and unproductive loans. Despite weak exports, economic growth is expected to reach its targeted 8 percent. On the week, the Shanghai Composite dropped 4.4 percent and now is up only 79.1 percent for the year. The Hang Seng, Taiex and STI were also down on the week.
Reserve Bank of Australia holds the fort
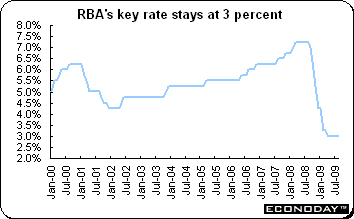 As expected, the Reserve Bank of Australia kept its key interest rate at 3 percent. It said that its accommodative monetary policy is appropriate given the economy’s circumstances at this time. Most analysts think that rates have bottomed in the current cycle. Australia is unique in the industrialized world — it is not in recession. Governor Glen Stevens said last week that the economy may recover sooner than he forecast six months ago as the lowest interest rates in half a century and government spending boost consumer and business confidence. He also signaled he may not wait for unemployment to peak before raising rates, spurring speculation that Australia will increase borrowing costs faster than most other nations. The surge in spending occurred after the government distributed A$12 billion in cash handouts to households and is spending A$22 billion to upgrade roads, railways, ports and schools. As expected, the Reserve Bank of Australia kept its key interest rate at 3 percent. It said that its accommodative monetary policy is appropriate given the economy’s circumstances at this time. Most analysts think that rates have bottomed in the current cycle. Australia is unique in the industrialized world — it is not in recession. Governor Glen Stevens said last week that the economy may recover sooner than he forecast six months ago as the lowest interest rates in half a century and government spending boost consumer and business confidence. He also signaled he may not wait for unemployment to peak before raising rates, spurring speculation that Australia will increase borrowing costs faster than most other nations. The surge in spending occurred after the government distributed A$12 billion in cash handouts to households and is spending A$22 billion to upgrade roads, railways, ports and schools.
In its latest quarterly statement on Monetary Policy, the RBA noted that the economic conditions have been stronger than expected and said that its next move on interest rates is likely to be an increase after it scrapped a prediction the economy will fall into a recession. The bank said that with the cash rate at an unusually low level of 3 percent and the global economy stabilizing, movement towards a more normal setting of monetary policy could be expected at some point. The current rate is “appropriate” for now.
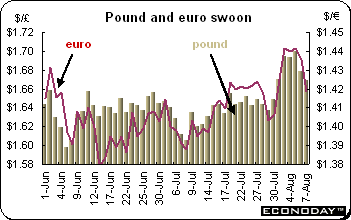 The currency story of the week had to be the pound sterling’s about face Thursday. The pound, which had risen over $1.70 on Wednesday and the highest level since October 2008 on optimism that the Bank of England would leave policy unchanged, received a rude awakening Thursday morning when the Bank said it would expand its quantitative easing program on concern that the recession is deeper than previously anticipated. The currency sank in a matter of minutes — and continued to decline on Friday. And on Friday, the better than anticipated U.S. employment report drove the pound even lower against the dollar. Bond yields also plunged the most in three months after the BoE kept the benchmark lending rate at a record low of 0.5 percent and said it will increase its purchase program by £50 billion. The pound had appreciated over 14 percent against the dollar this year and about 12.5 percent against the euro on signs that the U.K. economy is recovering. The currency story of the week had to be the pound sterling’s about face Thursday. The pound, which had risen over $1.70 on Wednesday and the highest level since October 2008 on optimism that the Bank of England would leave policy unchanged, received a rude awakening Thursday morning when the Bank said it would expand its quantitative easing program on concern that the recession is deeper than previously anticipated. The currency sank in a matter of minutes — and continued to decline on Friday. And on Friday, the better than anticipated U.S. employment report drove the pound even lower against the dollar. Bond yields also plunged the most in three months after the BoE kept the benchmark lending rate at a record low of 0.5 percent and said it will increase its purchase program by £50 billion. The pound had appreciated over 14 percent against the dollar this year and about 12.5 percent against the euro on signs that the U.K. economy is recovering.
The dollar advanced to a seven-week high against the yen and was higher against the euro as employers eliminated fewer jobs in July than economists forecast. The yen dropped against all of its major counterparts as the payroll report indicated a recovery in the world’s largest economy, encouraging Japanese investors to buy higher-yielding assets overseas.
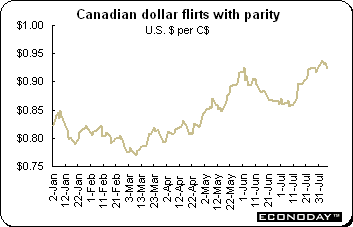 The Canadian dollar dropped after its labour report showed an employment drop of more than double analysts’ expectations. The report cast a shadow that even the U.S. report could not erase. The Canadian dollar had gained over 12 percent this year against its U.S. counterpart as investors sought assets that historically benefit when global demand rebounds. The Canadian dollar dropped after its labour report showed an employment drop of more than double analysts’ expectations. The report cast a shadow that even the U.S. report could not erase. The Canadian dollar had gained over 12 percent this year against its U.S. counterpart as investors sought assets that historically benefit when global demand rebounds.
Selected currencies — weekly results
|
|
2008 |
2009 |
% change |
|
|
Dec 31 |
Jul 31 |
Aug 7 |
Week |
2009 |
| U.S. $ per currency |
|
|
|
|
|
|
| Australia |
A$ |
0.711 |
0.836 |
0.836 |
0.0% |
17.5% |
| New Zealand |
NZ$ |
0.587 |
0.662 |
0.672 |
1.5% |
14.4% |
| Canada |
C$ |
0.822 |
0.928 |
0.923 |
-0.5% |
12.4% |
| Eurozone |
euro (€) |
1.397 |
1.425 |
1.417 |
-0.6% |
1.4% |
| UK |
pound sterling (£) |
1.459 |
1.670 |
1.669 |
-0.1% |
14.4% |
|
|
|
|
|
|
|
| Currency per U.S. $ |
|
|
|
|
|
|
| China |
yuan |
6.826 |
6.832 |
6.832 |
0.0% |
-0.1% |
| Hong Kong |
HK$* |
7.750 |
7.750 |
7.751 |
0.0% |
0.0% |
| India |
rupee |
48.675 |
47.935 |
47.750 |
0.4% |
1.9% |
| Japan |
yen |
90.740 |
94.615 |
97.525 |
-3.0% |
-7.0% |
| Malaysia |
ringgit |
3.453 |
3.523 |
3.501 |
0.6% |
-1.4% |
| Singapore |
Singapore $ |
1.433 |
1.440 |
1.441 |
-0.1% |
-0.6% |
| South Korea |
won |
1259.550 |
1228.425 |
1224.900 |
0.3% |
2.8% |
| Taiwan |
Taiwan $ |
32.820 |
32.807 |
32.779 |
0.1% |
0.1% |
| Thailand |
baht |
34.753 |
34.030 |
34.010 |
0.1% |
2.2% |
| Switzerland |
Swiss franc |
1.066 |
1.069 |
1.082 |
-1.2% |
-1.5% |
| *Pegged to U.S. dollar |
|
|
|
|
|
|
| Source: Bloomberg |
|
|
|
|
|
|
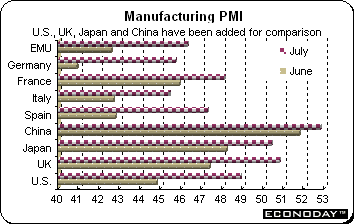 July Markit manufacturing PMI rose to 46.3 from 47.4 in June. The July reading was the best in 11 months and reflected the second largest point gain ever. However it was the 14th consecutive monthly deterioration in business conditions. PMIs were below the 50 breakeven point in all the countries covered by the survey but at the same time, all showed improvement. The bounce was driven by output which achieved near-stabilization in total and even returned to positive growth in Germany, France, Spain, Austria and the Netherlands. The new orders index also strengthened significantly, posting its best level since April last year while export orders signaled their smallest decline since June 2008. New orders rose more quickly than at any time since August 2007. New orders also rose for consumer goods but continued to fall for capital goods, albeit at a sharply reduced pace than seen in recent months. Stocks of finished goods declined at a near record pace to lift the orders/inventories ratio to a 2 ½ year high. Predictably, employment fell for the fourth consecutive month but the pace at which it did so eased to its slowest since last November. Price pressures similarly slackened again but by less than previous months. July Markit manufacturing PMI rose to 46.3 from 47.4 in June. The July reading was the best in 11 months and reflected the second largest point gain ever. However it was the 14th consecutive monthly deterioration in business conditions. PMIs were below the 50 breakeven point in all the countries covered by the survey but at the same time, all showed improvement. The bounce was driven by output which achieved near-stabilization in total and even returned to positive growth in Germany, France, Spain, Austria and the Netherlands. The new orders index also strengthened significantly, posting its best level since April last year while export orders signaled their smallest decline since June 2008. New orders rose more quickly than at any time since August 2007. New orders also rose for consumer goods but continued to fall for capital goods, albeit at a sharply reduced pace than seen in recent months. Stocks of finished goods declined at a near record pace to lift the orders/inventories ratio to a 2 ½ year high. Predictably, employment fell for the fourth consecutive month but the pace at which it did so eased to its slowest since last November. Price pressures similarly slackened again but by less than previous months.
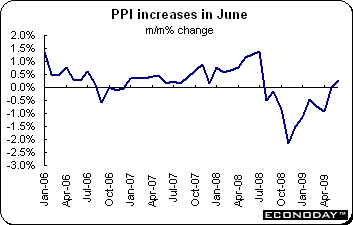 June producer prices were up 0.3 percent but down 6.6 percent when compared with last year. Overall prices were boosted by a sharp 1.4 percent jump in energy costs. Without this the PPI would have fallen 0.1 percent from May and declined 3.5 percent on the year. Energy was the only major category to see a monthly rise. Although capital goods prices were flat, intermediates fell 0.1 percent as did both durable and nondurable consumer goods. June producer prices were up 0.3 percent but down 6.6 percent when compared with last year. Overall prices were boosted by a sharp 1.4 percent jump in energy costs. Without this the PPI would have fallen 0.1 percent from May and declined 3.5 percent on the year. Energy was the only major category to see a monthly rise. Although capital goods prices were flat, intermediates fell 0.1 percent as did both durable and nondurable consumer goods.
 June retail sales excluding autos were down 0.2 percent and dropped 2.4 percent when compared with last year. Both food and non-food sales were down 0.2 percent on the month. Across the region, monthly sales were mixed. Sales fell markedly in Belgium (1.1 percent), Germany (1.8 percent) and Slovakia (0.9 percent) but rose appreciably in Spain (0.7 percent) and Slovenia (1.7 percent). There were also more modest gains in Finland (0.3 percent), Portugal (0.3 percent) and Austria (0.1 percent). June retail sales excluding autos were down 0.2 percent and dropped 2.4 percent when compared with last year. Both food and non-food sales were down 0.2 percent on the month. Across the region, monthly sales were mixed. Sales fell markedly in Belgium (1.1 percent), Germany (1.8 percent) and Slovakia (0.9 percent) but rose appreciably in Spain (0.7 percent) and Slovenia (1.7 percent). There were also more modest gains in Finland (0.3 percent), Portugal (0.3 percent) and Austria (0.1 percent).
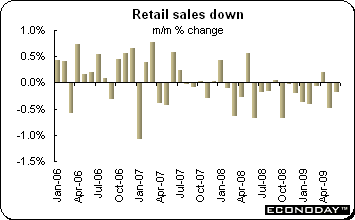
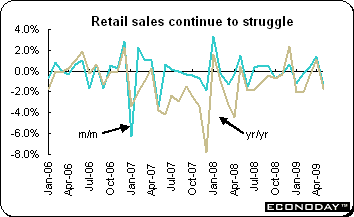 June retail sales volumes excluding autos dropped 1.8 percent and were down 1.9 percent when compared with last year. The monthly drop was the steepest in more than a year with purchases over the first six months of the year 2.1 percent lower than the first half of 2008. All of the main categories suffered in June. Non-food sales were down 1.4 percent on the year within which furniture & household goods slumped 2.8 percent, clothing & shoes fell 2.0 percent while other goods swooned by 7.3 percent. Mail order purchases declined 1.0 percent. Food, drink & tobacco sales eased 1.3 percent on the year with special store sales especially weak (minus 5.6 percent). June retail sales volumes excluding autos dropped 1.8 percent and were down 1.9 percent when compared with last year. The monthly drop was the steepest in more than a year with purchases over the first six months of the year 2.1 percent lower than the first half of 2008. All of the main categories suffered in June. Non-food sales were down 1.4 percent on the year within which furniture & household goods slumped 2.8 percent, clothing & shoes fell 2.0 percent while other goods swooned by 7.3 percent. Mail order purchases declined 1.0 percent. Food, drink & tobacco sales eased 1.3 percent on the year with special store sales especially weak (minus 5.6 percent).
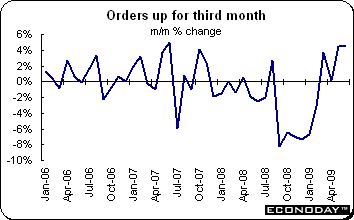 June manufacturing orders jumped 4.5 percent but still remain 25.3 percent below a year ago. The monthly bounce was decidedly lopsided and led by overseas demand for capital goods (12.5 percent), especially from the eurozone where orders surged 17.5 percent. Total orders for basics were up a strong 4.6 percent but consumer and durables disappointed, dropping 0.5 percent from May. Domestic orders edged up just 0.2 percent on the month with only basics (5.9 percent) registering any kind of gain. Both capital goods (minus 4.5 percent) and consumer and durable goods (minus 0.8 percent) posted declines. Total foreign orders were up 8.3 percent after a 4.3 percent advance in May. Within this, basics rose 3.3 percent (eurozone 11.5 percent) but consumer and durable goods declined 0.4 percent. June manufacturing orders jumped 4.5 percent but still remain 25.3 percent below a year ago. The monthly bounce was decidedly lopsided and led by overseas demand for capital goods (12.5 percent), especially from the eurozone where orders surged 17.5 percent. Total orders for basics were up a strong 4.6 percent but consumer and durables disappointed, dropping 0.5 percent from May. Domestic orders edged up just 0.2 percent on the month with only basics (5.9 percent) registering any kind of gain. Both capital goods (minus 4.5 percent) and consumer and durable goods (minus 0.8 percent) posted declines. Total foreign orders were up 8.3 percent after a 4.3 percent advance in May. Within this, basics rose 3.3 percent (eurozone 11.5 percent) but consumer and durable goods declined 0.4 percent.
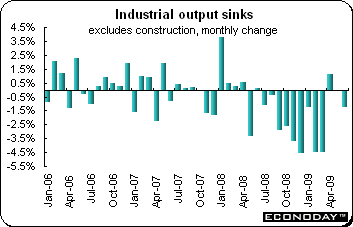
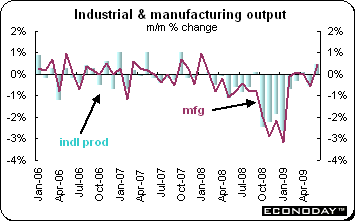
 June industrial production edged down 0.1 percent after rising an upwardly revised 4.3 percent in May. On the year, output was down 18.4 percent, worse than May’s decline of 17.6 percent. That leaves industrial production down 0.8 percent for the quarter — albeit a large improvement from the 11.9 percent decline in the first quarter. Manufacturing was flat after a revised increase of 5.2 percent in May. Investment goods were down 0.9 percent after increasing 8.8 percent in May. Basic goods were up1.8 percent but consumer durables stumbled and sank by 4.5 percent while nondurables swooned by 1 percent. Energy output was up 0.4 percent while construction dropped 1.4 percent. June industrial production edged down 0.1 percent after rising an upwardly revised 4.3 percent in May. On the year, output was down 18.4 percent, worse than May’s decline of 17.6 percent. That leaves industrial production down 0.8 percent for the quarter — albeit a large improvement from the 11.9 percent decline in the first quarter. Manufacturing was flat after a revised increase of 5.2 percent in May. Investment goods were down 0.9 percent after increasing 8.8 percent in May. Basic goods were up1.8 percent but consumer durables stumbled and sank by 4.5 percent while nondurables swooned by 1 percent. Energy output was up 0.4 percent while construction dropped 1.4 percent.
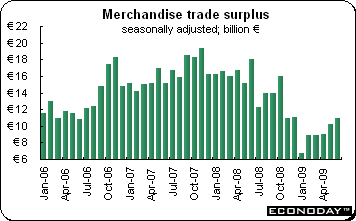 June seasonally adjusted merchandise trade surplus climbed to €11.0 billion. The surplus was driven by higher exports, which rose 7.0 percent on the month while imports were up 6.7 percent. On the year, exports were down 20.1 percent to EMU members and sank 22.4 percent to non-EU countries. At the same time, imports to the EMU were down 16 percent and dropped 19.8 percent from non-EU countries. June seasonally adjusted merchandise trade surplus climbed to €11.0 billion. The surplus was driven by higher exports, which rose 7.0 percent on the month while imports were up 6.7 percent. On the year, exports were down 20.1 percent to EMU members and sank 22.4 percent to non-EU countries. At the same time, imports to the EMU were down 16 percent and dropped 19.8 percent from non-EU countries.
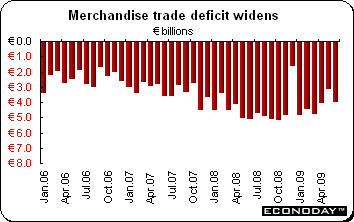 June merchandise trade deficit widened to €4.0 billion from a revised €3.137 billion in May. Exports were down 1.7 percent on the month while imports were up 1.3 percent. The deficit for the first half 2009 was €25.374 billion down from €26.762 for the same period in 2008. The June manufacturing deficit widened thanks to lower exports of transportation equipment and higher overall deficits in "other" manufactured goods, including rubber, plastics & minerals, and furniture, toys & jewelry. The deficits with Germany and the U.S. and the eurozone all widened. June merchandise trade deficit widened to €4.0 billion from a revised €3.137 billion in May. Exports were down 1.7 percent on the month while imports were up 1.3 percent. The deficit for the first half 2009 was €25.374 billion down from €26.762 for the same period in 2008. The June manufacturing deficit widened thanks to lower exports of transportation equipment and higher overall deficits in "other" manufactured goods, including rubber, plastics & minerals, and furniture, toys & jewelry. The deficits with Germany and the U.S. and the eurozone all widened.
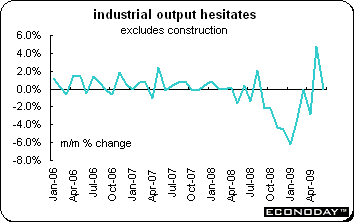
 June industrial output sank 1.2 percent and was down 21.9 percent on the year. The June data means that output for the second quarter as a whole fell 3.9 percent from the first quarter. The monthly June drop was broad-based with all of the major sectors registering declines. Worst hit was energy (down 2.7 percent) but capital goods were not far behind (down 2.3 percent) and both intermediates (2.0 percent) and consumer goods (1.0 percent) fell sharply too. June industrial output sank 1.2 percent and was down 21.9 percent on the year. The June data means that output for the second quarter as a whole fell 3.9 percent from the first quarter. The monthly June drop was broad-based with all of the major sectors registering declines. Worst hit was energy (down 2.7 percent) but capital goods were not far behind (down 2.3 percent) and both intermediates (2.0 percent) and consumer goods (1.0 percent) fell sharply too.
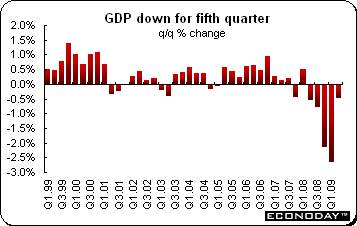 First estimate of second quarter gross domestic quarter declined 0.5 percent and was down 6 percent when compared with the same quarter a year ago. The second quarter decline was the fifth in a row and the sixth in the past seven quarters. As always for first estimates, little detail is available but ISTAT said that the declines were broad based and affected industry, services and agriculture. First estimate of second quarter gross domestic quarter declined 0.5 percent and was down 6 percent when compared with the same quarter a year ago. The second quarter decline was the fifth in a row and the sixth in the past seven quarters. As always for first estimates, little detail is available but ISTAT said that the declines were broad based and affected industry, services and agriculture.
 June industrial production was up 0.5 percent but was still down 11.1 percent when compared with last year. The gain reflected increases in most sectors including a 0.4 percent jump in manufacturing industries. However, manufacturing was down 11.7 percent on the year. Both mining & quarrying and oil & gas extraction soared by 1.1 percent. Activity in the utilities area was flat. Over the last three months, consumer durables output was up 1.2 percent while nondurables were up 1.7 percent. However, advances here were partially offset by declines in both capital goods (3.4 percent) and intermediates (3.3 percent). In manufacturing, nine of 13 sub-sectors reported gains. Transportation posted the largest advance (4.1 percent) which benefited from a 13.5 percent surge in motor vehicle output. The other main positive effect came from electrical & optical equipment (2.5 percent). June industrial production was up 0.5 percent but was still down 11.1 percent when compared with last year. The gain reflected increases in most sectors including a 0.4 percent jump in manufacturing industries. However, manufacturing was down 11.7 percent on the year. Both mining & quarrying and oil & gas extraction soared by 1.1 percent. Activity in the utilities area was flat. Over the last three months, consumer durables output was up 1.2 percent while nondurables were up 1.7 percent. However, advances here were partially offset by declines in both capital goods (3.4 percent) and intermediates (3.3 percent). In manufacturing, nine of 13 sub-sectors reported gains. Transportation posted the largest advance (4.1 percent) which benefited from a 13.5 percent surge in motor vehicle output. The other main positive effect came from electrical & optical equipment (2.5 percent).
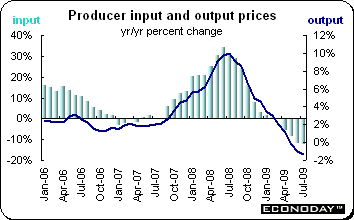 July producer output prices were up 0.3 percent but were down 1.3 percent when compared with last year and the steepest since November 2001. The increase was attributed to rising prices for other manufactured goods, especially secondary raw materials such as scrap metals, as well as higher prices for chemicals, alcohol and tobacco. However, lower food prices (down 0.6 percent on the month) helped keep overall output prices relatively low. Core output prices which exclude petroleum and food beverages & tobacco were up 0.5 percent and 0.2 percent on the year. Producer input prices dropped 1.4 on the month and 12.2 percent on the year. Lower crude oil prices (down 3.8 percent) along with lower home produced food costs (down 3.0 percent on a steep decline in the price of potatoes) pressured input prices. July producer output prices were up 0.3 percent but were down 1.3 percent when compared with last year and the steepest since November 2001. The increase was attributed to rising prices for other manufactured goods, especially secondary raw materials such as scrap metals, as well as higher prices for chemicals, alcohol and tobacco. However, lower food prices (down 0.6 percent on the month) helped keep overall output prices relatively low. Core output prices which exclude petroleum and food beverages & tobacco were up 0.5 percent and 0.2 percent on the year. Producer input prices dropped 1.4 on the month and 12.2 percent on the year. Lower crude oil prices (down 3.8 percent) along with lower home produced food costs (down 3.0 percent on a steep decline in the price of potatoes) pressured input prices.
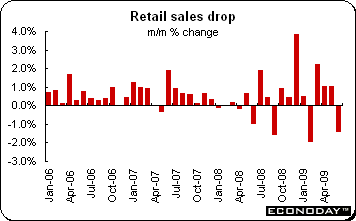 June retail sales sank by 1.4 percent but were up 7.5 percent on the year. Both the chains & other large retailers and smaller retailers’ sales declined by 2.9 percent on the month. Chains and other large retailers increased by 9.2 percent on the year while the estimate for 'smaller' retailers increased by 5.7 percent. All industries except household good retailing (up 2.9 percent) declined in June. This is the opposite of May when all industries except household good retailing increased. Industries with the largest decreases were department stores, down 8.8 percent, and clothing & soft goods retailing which were down 7.4 percent. June retail sales sank by 1.4 percent but were up 7.5 percent on the year. Both the chains & other large retailers and smaller retailers’ sales declined by 2.9 percent on the month. Chains and other large retailers increased by 9.2 percent on the year while the estimate for 'smaller' retailers increased by 5.7 percent. All industries except household good retailing (up 2.9 percent) declined in June. This is the opposite of May when all industries except household good retailing increased. Industries with the largest decreases were department stores, down 8.8 percent, and clothing & soft goods retailing which were down 7.4 percent.
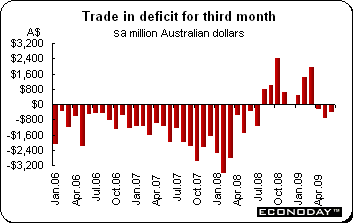 June merchandise trade deficit improved to A$441 million from May’s revised deficit of A$738 million. Exports were up 1.5 percent while imports inched up 0.1 percent. Exports of other goods jumped 13 percent with the non-monetary gold component up 17 percent. Both Non-rural and rural goods were up 1 percent. Services dipped by A$3 million. Imports of intermediate and other merchandise goods climbed 4 percent with the fuels and lubricants component up 13 percent. Consumption goods were up 4 percent, capital goods edged up 1 percent as did services. These increases were partly offset by a drop in other goods which sank 48 percent mainly due to the drop in the non-monetary gold component, which was down 45 percent. June merchandise trade deficit improved to A$441 million from May’s revised deficit of A$738 million. Exports were up 1.5 percent while imports inched up 0.1 percent. Exports of other goods jumped 13 percent with the non-monetary gold component up 17 percent. Both Non-rural and rural goods were up 1 percent. Services dipped by A$3 million. Imports of intermediate and other merchandise goods climbed 4 percent with the fuels and lubricants component up 13 percent. Consumption goods were up 4 percent, capital goods edged up 1 percent as did services. These increases were partly offset by a drop in other goods which sank 48 percent mainly due to the drop in the non-monetary gold component, which was down 45 percent.
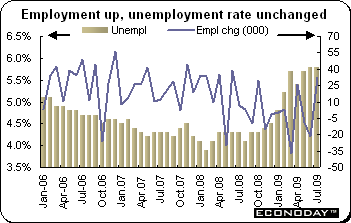 July employment was up 32,200 with all the gain taking place in part time employment. Full time employment was down by 16,000 while part time employment jumped by 48,200. Unemployment inched up by 800 to 664,000. However, the increase wasn't enough to raise the unemployment rate which remained at 5.8 percent for the second month. The number of persons looking for full-time work declined by 4,800 to 495,900, while the number of persons looking for part-time work increased by 5,600 to 168,200. The participation rate edged up 0.1 percent point to 65.3 percent. July employment was up 32,200 with all the gain taking place in part time employment. Full time employment was down by 16,000 while part time employment jumped by 48,200. Unemployment inched up by 800 to 664,000. However, the increase wasn't enough to raise the unemployment rate which remained at 5.8 percent for the second month. The number of persons looking for full-time work declined by 4,800 to 495,900, while the number of persons looking for part-time work increased by 5,600 to 168,200. The participation rate edged up 0.1 percent point to 65.3 percent.
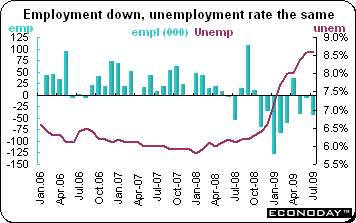 July employment declined by 44,500 jobs. Both full time and part time jobs were down, dropping 29,100 and 15,400 respectively. Since the peak in October 2008, employment has dropped by 414,000 jobs. Private sector employment plunged by 75,000 bringing total losses since October to 436,000. The number of self-employed increased by 35,000. Since October, self employment has increased by 75,000, mostly in finance, insurance, real estate & leasing, professional, scientific & technical services and other services. Employment was down in accommodation & food services and construction while there were increases in retail and wholesale trade. The unemployment rate was unchanged at 8.6 percent — the highest in 11 years as fewer people participated in the labor market. July employment declined by 44,500 jobs. Both full time and part time jobs were down, dropping 29,100 and 15,400 respectively. Since the peak in October 2008, employment has dropped by 414,000 jobs. Private sector employment plunged by 75,000 bringing total losses since October to 436,000. The number of self-employed increased by 35,000. Since October, self employment has increased by 75,000, mostly in finance, insurance, real estate & leasing, professional, scientific & technical services and other services. Employment was down in accommodation & food services and construction while there were increases in retail and wholesale trade. The unemployment rate was unchanged at 8.6 percent — the highest in 11 years as fewer people participated in the labor market.
Investors not on vacation — it is August — were treated to a plethora of promising new economic data, earnings and central bank actions. While interest rates were unchanged, the Bank of England increased its quantitative easing by £50 billion and the Reserve Bank of Australia intimated that the next interest rate move would be up. The European Central Bank maintained the status quo.
The Bank of Japan and FOMC meet this week. No changes in BoJ policy or Fed policy are expected. And in the EMU, flash second quarter gross domestic product will be released while in the UK, the labour market report will unveil the latest unemployment numbers.
| Central Bank activities |
|
| August 10,11 |
Japan |
Bank of Japan Monetary Policy Board Meeting |
| August 11,12 |
United States |
FOMC Meeting |
|
|
|
| The following indicators will be released this week... |
| Europe |
|
|
| August 10 |
France |
Industrial Production (June) |
| August 11 |
UK |
Merchandise Trade (June) |
| August 12 |
EMU |
Industrial Production (June) |
|
UK |
Labour Market Report (July) |
| August 13 |
EMU |
Gross Domestic Product (Q2.09 flash) |
|
Germany |
Gross Domestic Product (Q2.09 flash) |
|
France |
Gross Domestic Product (Q2.09 flash) |
| August 14 |
EMU |
Harmonized Index of Consumer Prices (July) |
|
|
|
| Asia/Pacific |
|
|
| August 12 |
Japan |
Corporate Goods Price Index (July) |
| August 14 |
Japan |
Tertiary Sector Activity Index (June) |
|
|
|
| Americas |
|
|
| August 12 |
Canada |
International Trade Balance (June) |
| August 14 |
Canada |
Manufacturing Shipments (June) |
Anne D Picker is the author of International Economic Indicators and Central Banks.
|
