|
On the road to recovery, we would all like to be able to jump in an economic sports car, hit the accelerator, and zoom back to healthy growth. The reality is that there are occasional bumps in the road that slow you down. This past week, the jobs report for June was a nasty bump in the road to recovery. But there were relatively good reports on housing.
Note: any references to week ending for markets in the U.S. are for Thursday as U.S. markets were closed Friday for Independence Day observed.
 Equities ended the week down on weak economic data. Stocks did start the week on a positive note as bargain hunters went on a mild buying spree. Also, some window dressing before end of quarter and higher oil prices helped bump up stocks, especially in the energy patch. But economic news weighed equities down on Tuesday with an unexpected drop in consumer confidence. Financials were particularly hard hit. Equities ended the week down on weak economic data. Stocks did start the week on a positive note as bargain hunters went on a mild buying spree. Also, some window dressing before end of quarter and higher oil prices helped bump up stocks, especially in the energy patch. But economic news weighed equities down on Tuesday with an unexpected drop in consumer confidence. Financials were particularly hard hit.
 Economic news was more positive on Wednesday as the ISM manufacturing index rose further, pending home sales edged higher, and home prices declined at a slower pace. Equities responded with nice gains across the board. But a sharper-than-expected decline in payroll jobs pushed stocks down sharply on the last day of trading in the U.S. Net for the week, equity traders have become a little more concerned about the health of the consumer sector and this is now weighing on equities. Economic news was more positive on Wednesday as the ISM manufacturing index rose further, pending home sales edged higher, and home prices declined at a slower pace. Equities responded with nice gains across the board. But a sharper-than-expected decline in payroll jobs pushed stocks down sharply on the last day of trading in the U.S. Net for the week, equity traders have become a little more concerned about the health of the consumer sector and this is now weighing on equities.
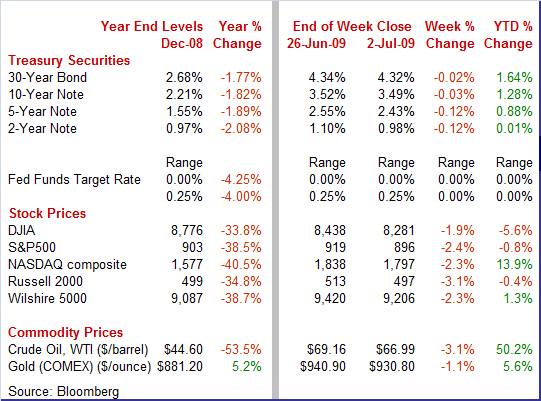
Equities were down this past week. The Dow was down 1.9 percent; the S&P 500, down 2.4 percent; the Nasdaq, down 2.3 percent; and the Russell 2000, down 3.1 percent.
Equities were mixed for the month of June. The Dow was down 0.6 percent; the S&P 500, essentially flat but fractionally in positive territory; the Nasdaq, up 3.4 percent; and the Russell 2000, up 1.3 percent.
 Equities were up significantly over the second quarter, due largely to sharp gains in April and moderate advances in May. The Dow was up 11.0 percent; the S&P 500, up 15.2 percent; the Nasdaq, up 20.0 percent; and the Russell 2000, up 20.2 percent. Equities were up significantly over the second quarter, due largely to sharp gains in April and moderate advances in May. The Dow was up 11.0 percent; the S&P 500, up 15.2 percent; the Nasdaq, up 20.0 percent; and the Russell 2000, up 20.2 percent.
For the year-to-date, major indexes are mixed as follows: the Dow, down 5.6 percent; the S&P 500, down 0.8 percent; the Nasdaq, up 13.9 percent; and the Russell 2000, down 0.4 percent.
Weekly percent change column reflects percent changes for all components except interest rates. Interest rate changes are reflected in simple differences.
 Treasury yields eased this past week on net negative economic news. Rates started the week off soft as some investors moved into the safety of Treasuries ahead of key economic reports later in the week. While equities focused on the drop in consumer confidence on Tuesday, bond traders saw an improved economy through a softer decline in home prices as measured by the Case-Shiller index. Rates firmed on the home price index report and on a better-than-expected ISM-Chicago Business Barometer. Most of the downward movement in yields was on Friday after a disappointing June jobs report. Also after the employment report, flight to safety out of stocks and into bonds helped ease rates. Treasury yields eased this past week on net negative economic news. Rates started the week off soft as some investors moved into the safety of Treasuries ahead of key economic reports later in the week. While equities focused on the drop in consumer confidence on Tuesday, bond traders saw an improved economy through a softer decline in home prices as measured by the Case-Shiller index. Rates firmed on the home price index report and on a better-than-expected ISM-Chicago Business Barometer. Most of the downward movement in yields was on Friday after a disappointing June jobs report. Also after the employment report, flight to safety out of stocks and into bonds helped ease rates.
For this past week Treasury rates were down as follows: 3-month T-bill, down 2 basis points; the 2-year note, down 12 basis points; the 5-year note, down 12 basis points; the 7-year note, down 6 basis points; the 10-year bond, down 3 basis points; and the 30-year bond, down 2 basis points.
 The spot price for West Texas Intermediate ended the week down moderately with negative economic news the key factor. However, the week started off with a sharp spike on Monday as militants in Nigeria attacked a pipeline just days after a truce and amnesty offer from that country’s president. Oil declined each of the remaining three days of trading, with cuts ranging from just over a buck to about $1.75. Pulling down oil prices were an unexpected drop in consumer confidence, a surprise rise in weekly gasoline stocks, and the larger-than-expected fall in payroll employment. The spot price for West Texas Intermediate ended the week down moderately with negative economic news the key factor. However, the week started off with a sharp spike on Monday as militants in Nigeria attacked a pipeline just days after a truce and amnesty offer from that country’s president. Oil declined each of the remaining three days of trading, with cuts ranging from just over a buck to about $1.75. Pulling down oil prices were an unexpected drop in consumer confidence, a surprise rise in weekly gasoline stocks, and the larger-than-expected fall in payroll employment.
Net for the week, spot prices for West Texas Intermediate dropped $2.17 per barrel to settle at $66.99 – the lowest close since June 3rd’s $66.12.
This past week, the economic news was mixed. While there are further signs of approaching a bottom in housing, the consumer sector took a step backward.
 Workers will not have a lot to celebrate this Fourth of July as job losses worsened, unemployment continued to rise, and wage gains were flat in June. Nonfarm payroll employment in June declined 467,000, following a fall of 322,000 in May and a decrease of 519,000 in April. However, layoffs of temporary workers for the upcoming 2010 census accounted for a notable part of June’s job losses. May and April revisions were up a net 8,000. Workers will not have a lot to celebrate this Fourth of July as job losses worsened, unemployment continued to rise, and wage gains were flat in June. Nonfarm payroll employment in June declined 467,000, following a fall of 322,000 in May and a decrease of 519,000 in April. However, layoffs of temporary workers for the upcoming 2010 census accounted for a notable part of June’s job losses. May and April revisions were up a net 8,000.
 Job losses were widespread by industry. Goods-producing jobs dropped 223,000 in June, led by a 136,000 drop in manufacturing employment with motor vehicles & parts down 27,000. Construction decreased 79,000 while natural resources & mining slipped 8,000. Service-providing payrolls dropped 244,000 in June after falling 107,000 in May. Weakness was especially pronounced in professional business services which plunged 118,000. Notable declines were also seen in trade & transportation, down 51,000, and in government, down 52,000. Within the government component, 49,000 of the loss was due to laying off temporary workers helping to prepare the 2010 census. Job losses were widespread by industry. Goods-producing jobs dropped 223,000 in June, led by a 136,000 drop in manufacturing employment with motor vehicles & parts down 27,000. Construction decreased 79,000 while natural resources & mining slipped 8,000. Service-providing payrolls dropped 244,000 in June after falling 107,000 in May. Weakness was especially pronounced in professional business services which plunged 118,000. Notable declines were also seen in trade & transportation, down 51,000, and in government, down 52,000. Within the government component, 49,000 of the loss was due to laying off temporary workers helping to prepare the 2010 census.
In June, the average workweek slipped to an extremely weak 33.0 hours from 33.1 hours in May. The June figure is the lowest level on record for the series, which began in 1964.
Those still employed are not seeing boosts in spending power. Average hourly earnings were unchanged after rising 0.2 percent in May. Average weekly earnings fell 0.3 percent in June, following a 0.2 percent rise the month before. Over the past 12 months, average hourly earnings have increased 2.7 percent, while weekly earnings have risen by only 0.9 percent, reflecting a decline in the average workweek. Year-ago gains in average hourly earnings are down sharply from a recent peak of 3.9 percent this past December.
 From the household survey, the civilian unemployment rate rose to 9.5 percent from 9.4 percent in May and was lower than the consensus forecast for 9.6 percent. But the number of unemployed hit 14.7 million - a record high. The June unemployment rate is the highest since 9.5 percent for August 1983. From the household survey, the civilian unemployment rate rose to 9.5 percent from 9.4 percent in May and was lower than the consensus forecast for 9.6 percent. But the number of unemployed hit 14.7 million - a record high. The June unemployment rate is the highest since 9.5 percent for August 1983.
Overall, the latest jobs report indicates that the consumer is likely to stay on the sidelines for some time. When recovery comes, it likely will not be due to a surge in the consumer sector.
 After Chrysler and GM filed for bankruptcy protection, industry pundits have worried whether consumers would buy what many might consider tainted brands. Well, the results are in for June and Chrysler took a big hit with GM also suffering. But on a seasonally adjusted basis, total sales of domestics and imports fell only 2.3 percent in June after rising 6.4 percent in May. June’s combined annualized sales pace of 9.69 million units was down 29.2 percent on a year-ago basis. This is the strongest year-ago pace since the collapse of the financial markets this past September. After Chrysler and GM filed for bankruptcy protection, industry pundits have worried whether consumers would buy what many might consider tainted brands. Well, the results are in for June and Chrysler took a big hit with GM also suffering. But on a seasonally adjusted basis, total sales of domestics and imports fell only 2.3 percent in June after rising 6.4 percent in May. June’s combined annualized sales pace of 9.69 million units was down 29.2 percent on a year-ago basis. This is the strongest year-ago pace since the collapse of the financial markets this past September.
But in the latest month, domestics indeed suffered somewhat from concern about US automakers’ ability to follow through with service and parts in the future as domestics sales dropped 3.7 percent in June while imports actually rose 1.5 percent.
Based on June year-ago percentages, Ford was the big winner – or rather less of a loser, dropping only 10.7 percent while Chrysler and GM fell 41.9 percent and 33.4 percent, respectively. But it could have been worse. Both Chrysler and GM have been hurt by closing or cutting ties with hundreds of auto dealers. Nonetheless, heavy discounting has helped support sales for most producers as rising unemployment has made consumers more reluctant about making big ticket purchases.
Looking ahead, GM may actually get a little lift from Hollywood. Several trendy GM products were highlighted in the latest Transformers movie which was number one in movie ticket sales when it opened over the June 26-28 weekend.
 The economy has consumers nervous again and the job situation is at the top of the list of consumer worries. The Conference Board's consumer confidence index fell 5-1/2 points in June to 49.3. June’s decline had followed notable improvement the prior two months. The economy has consumers nervous again and the job situation is at the top of the list of consumer worries. The Conference Board's consumer confidence index fell 5-1/2 points in June to 49.3. June’s decline had followed notable improvement the prior two months.
The reversal in June was due to declines in both the present situation and expectations indexes. The expectations component fell back 6 points in June to 65.5 while the present situation index fell nearly 5 points to 24.8. The expectations index, however, is still relatively high, indicating that consumers still see recovery not far down the road.
But for now, consumers are worried about the job picture, including rising unemployment. Those saying jobs are plentiful fell 1.3 percentage points to a microscopic 4.5 percent. Those saying jobs are hard to get rose nearly 1 percentage point to 44.8 percent. Overall, the latest consumer confidence report indicates that the consumer is going to be cautious about pulling out its collective wallet anytime soon.
 The ISM manufacturing composite index in June rose 2 points to 44.8. Traders have been hoping that the ISM index would plod steadily upward to breakeven and into positive territory over coming months. But that scenario may not be so smooth. The new orders index fell back into negative territory, declining nearly 2 points 49.2, a contractionary reading. The ISM manufacturing composite index in June rose 2 points to 44.8. Traders have been hoping that the ISM index would plod steadily upward to breakeven and into positive territory over coming months. But that scenario may not be so smooth. The new orders index fell back into negative territory, declining nearly 2 points 49.2, a contractionary reading.
But inventories appear to be lean, with the customers inventory index down 2-1/2 points to 43.5. The separate inventories index, which measures inventories at respondents' firms, also shows destocking, at 30.8 for a more than 2 point fall.
However, production was positive, rising 6-1/2 points to 52.5 and was the biggest factor in the composite index improvement. Overall, the latest ISM report indicates that the manufacturing sector is trending out of recession – but just don’t expect smooth upward movement every month.
 According to the National Association of Realtors, pending home sales index rose 0.1 percent in May to 90.7, boosting the year-on-year gain to 6.7 percent. The incremental rise in May means pending home sales have risen four months in a row. The last time there were four consecutive monthly gains was in October 2004. The latest monthly winning streak and positive year-ago numbers suggest that we have hit bottom in existing home sales. According to the National Association of Realtors, pending home sales index rose 0.1 percent in May to 90.7, boosting the year-on-year gain to 6.7 percent. The incremental rise in May means pending home sales have risen four months in a row. The last time there were four consecutive monthly gains was in October 2004. The latest monthly winning streak and positive year-ago numbers suggest that we have hit bottom in existing home sales.
However, in recent months, a smaller share of pending home sales (reflecting down payments) have made it all the way to closing due to more conservative home appraisal values. Sales fall through when appraisals don't support the sales prices.
 Two weeks ago we got sizeable gains in median home prices from the Census Bureau’s new home sales report and the National Association of Realtors’ existing home sales report. But those price numbers are easily skewed by shifts in sales between high-end and low-end homes and that now appears to be the case. This past week, we got a more reliable reading from the Case-Shiller home price report which bases its price changes on repeat transactions (comparing prices for same houses). Two weeks ago we got sizeable gains in median home prices from the Census Bureau’s new home sales report and the National Association of Realtors’ existing home sales report. But those price numbers are easily skewed by shifts in sales between high-end and low-end homes and that now appears to be the case. This past week, we got a more reliable reading from the Case-Shiller home price report which bases its price changes on repeat transactions (comparing prices for same houses).
 The news from the Case-Shiller is not as rosy as existing and new home reports but still in the right direction as price declines eased. Case-Shiller's 20-city index fell 0.6 percent in April – improved from a long run of minus 2 percent readings. The year-on-year rate improved to minus 18.1 percent, 6 tenths better than the two prior months. The year-ago percentage change bottomed at down 19.0 percent in January. The news from the Case-Shiller is not as rosy as existing and new home reports but still in the right direction as price declines eased. Case-Shiller's 20-city index fell 0.6 percent in April – improved from a long run of minus 2 percent readings. The year-on-year rate improved to minus 18.1 percent, 6 tenths better than the two prior months. The year-ago percentage change bottomed at down 19.0 percent in January.
Declines moderated but remain most severe in Phoenix, Miami, and Las Vegas. California cities showed significant improvement including San Francisco where prices actually edged higher in the month. A sign that home prices are starting to stabilize is that every metro area in the 20 city group, except for Charlotte, recorded an improvement in monthly returns over March (including being less negative).
The road to recovery was bumpy this past week and occasional weeks like this should be expected given that the projected recovery is forecast to be sluggish. While the worsening in the rate of job loss is disappointing, net it still looks like the recession is bottoming soon. But one should keep in mind that the vast majority of economists expect employment to recover significantly after the overall economy.
There is just one market moving indicator this week – international trade on Friday. But after last week’s reversals in the jobs report and consumer confidence index, markets will likely pay more attention than usual to the unemployment claims and consumer sentiment reports.
The composite index from the ISM non-manufacturing survey edged up 3 tenths to 44.0 in May. This is the best reading since October 2008 which came in at 44.6. But looking ahead, we may see a modest reversal in June as the new orders index declined in May to 44.4 from 47.0 in April. The backlogs index also fell back, slipping 4 points to 40.0 in May.
Composite index Consensus Forecast for June 09: 46.7
Range: 45.0 to 47.0
Consumer credit outstanding contracted very severely in April, dropping $15.7 billion. The drop was about split evenly between revolving credit, down $8.6 billion, and nonrevolving credit, down $7.1 billion. Consumer credit has contracted three months in a row and in seven of the last nine months. Banks and credit card companies have been tightening available credit while consumers have pulled back on spending—either due to job loss or the fear of it. A positive number for May could indicate that consumers are starting to loosen up while another negative figure likely means the consumer is still retrenching.
Consumer credit Consensus Forecast for May 09: -$7.5 billion
Range: -$15.0 billion to +$2.3 billion
Initial jobless claims for the week ending June 27 declined 16,000 to 614,000. Continuing claims for the June 20 week totaled 6.702 million, down 53,000 from the prior week. After last week’s worse-than-expected payroll job losses, markets will be paying closer attention than usual to the unemployment claims report.
Jobless Claims Consensus Forecast for 7/4/09: 610,000
Range: 605,000 to 610,000
The U.S. international trade gap in April worsened to $29.2 billion from the $28.5 billion deficit the prior month as exports fell faster than imports. Exports declined 2.3 percent while imports slipped 1.4 percent. The widening in the trade gap was seen in both petroleum and nonpetroleum components. For May, oil prices jumped about $9 per barrel on a seasonally adjusted basis and this likely will lead to a spike in the petroleum deficit and overall deficit for the month.
International trade balance Consensus Forecast for May 09: -$28.8 billion
Range: -$31.0 billion to -$26.9 billion
The Reuter's/University of Michigan's Consumer sentiment index rose a modest 1.9 points in May to 70.8 in June. While the gain is good news, the degree of improvement slowed from recent months. The index had jumped nearly 4 points in May and nearly 8 points in April. Markets will be giving the consumer sentiment report more attention than usual this report because the June consumer confidence index from The Conference Board actually fell back. Any news that the consumer is less worried about the economy will be welcomed by the markets—especially after the latest Conference Board report.
Consumer sentiment Consensus Forecast for preliminary July 09: 71.5
Range: 68.0 to 72.0
Econoday Senior Writer Mark Pender contributed to this article.
|
