|
Simply Economics will be published on Thursday, July 2nd. Happy Fourth of July!
This past week, economic news was positive for manufacturing and for the consumer but mixed for housing. Overall, the worst of the recession is clearly behind us and the end of the recession appears to be getting closer.
 Equities were mixed this past week with the Blue Chips showing the greatest weakness. An announcement from the World Bank that the recession will be deeper than previously forecast had the most impact on stocks this past week as major indexes dropped sharply on Monday. Most indexes advanced on Wednesday on an unexpectedly strong durables orders report and on the FOMC announcement that included the comment that “the pace of economic contraction is slowing.” Equities started out Thursday somewhat down after a rise in jobless claims but traders focused on Fed Chairman Ben Bernanke’s testimony before Congress on the issue of Bank of America’s acquisition of Merrill Lynch. Markets decided that his testimony went reasonably well and showed their approval by boosting equities. The week ended listlessly as traders waited on the impact of restructuring the Russell 2000. Equities were mixed this past week with the Blue Chips showing the greatest weakness. An announcement from the World Bank that the recession will be deeper than previously forecast had the most impact on stocks this past week as major indexes dropped sharply on Monday. Most indexes advanced on Wednesday on an unexpectedly strong durables orders report and on the FOMC announcement that included the comment that “the pace of economic contraction is slowing.” Equities started out Thursday somewhat down after a rise in jobless claims but traders focused on Fed Chairman Ben Bernanke’s testimony before Congress on the issue of Bank of America’s acquisition of Merrill Lynch. Markets decided that his testimony went reasonably well and showed their approval by boosting equities. The week ended listlessly as traders waited on the impact of restructuring the Russell 2000.
Equities were mixed this past week. The Dow was down 1.2 percent; the S&P 500, down 0.3 percent; the Nasdaq, up 0.6 percent; and the Russell 2000, up 0.1 percent.
For the year-to-date, major indexes are mixed as follows: the Dow, down 3.9 percent; the S&P 500, up 1.7 percent; the Nasdaq, up 16.6 percent; and the Russell 2000, up 2.8 percent.
For those who are interested, the price of Sony stock closed the week at $26.30 per share, compared to closing at $25.90 per share on Wednesday, just prior to the death of Michael Jackson, who has been under contract with the entertainment company.
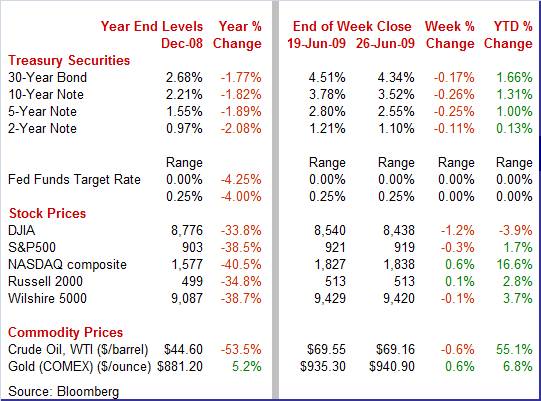
Weekly percent change column reflects percent changes for all components except interest rates. Interest rate changes are reflected in simple differences.
 Treasury yields were down significantly this past week despite net positive economic news and heavy supply from note auctions. Treasury yields were down significantly this past week despite net positive economic news and heavy supply from note auctions.
Yields eased on Monday after the World Bank announced a worsened forecast for the current recession. On Tuesday, the 2-year note auction went better than expected while existing home sales rose less than expected. Rates firmed on Wednesday after the Fed’s FOMC announcement which kept its planned purchases of Treasuries unchanged. Bond traders had anticipated that the Fed would raise its goal for Treasury purchases. Rates fell the most on Thursday with the 7-year note auction going better than expected and initial jobless claims coming in higher than anticipated.
 For this past week Treasury rates were mostly down as follows: 3-month T-bill, unchanged; the 2-year note, down 11 basis points; the 5-year note, down 25 basis points; the 7-year note, down 24 basis points; the 10-year bond, down 26 basis points; and the 30-year bond, down 17 basis points. For this past week Treasury rates were mostly down as follows: 3-month T-bill, unchanged; the 2-year note, down 11 basis points; the 5-year note, down 25 basis points; the 7-year note, down 24 basis points; the 10-year bond, down 26 basis points; and the 30-year bond, down 17 basis points.
Longer-term Treasury yields have eased over the last few weeks despite worries over looming federal deficits. Stocks have retreated somewhat and Treasuries have benefited from flight to safety. Also, inflation has eased despite recently higher oil prices. And the Fed has downplayed the issue of potentially resurging inflation, stating that the Fed would act timely to prevent rising inflation. This has helped calm the Treasury market.
 Geopolitics mixed with economics this past week to impact oil prices. Despite the daily volatility, the net result was little change for the week. At the start of the week, political tension in Iran, the world’s number 4 oil producer, should have led to price hikes but that was overshadowed by the World Bank predicting the current recession will end up worse than earlier projected. Militants in Nigeria caused price spikes on Tuesday and Thursday after attacks on oil pipelines in that major oil-producing country. And an announcement of a truce between Nigerian militants and the government on Friday led to a price decline. In addition to the World Bank’s economic projection, the other key economic news came from the Fed’s FOMC announcement. Oil markets chose to focus on the statement’s comment that economic growth would be sluggish for some time, bumping oil prices down. Geopolitics mixed with economics this past week to impact oil prices. Despite the daily volatility, the net result was little change for the week. At the start of the week, political tension in Iran, the world’s number 4 oil producer, should have led to price hikes but that was overshadowed by the World Bank predicting the current recession will end up worse than earlier projected. Militants in Nigeria caused price spikes on Tuesday and Thursday after attacks on oil pipelines in that major oil-producing country. And an announcement of a truce between Nigerian militants and the government on Friday led to a price decline. In addition to the World Bank’s economic projection, the other key economic news came from the Fed’s FOMC announcement. Oil markets chose to focus on the statement’s comment that economic growth would be sluggish for some time, bumping oil prices down.
Net for the week, spot prices for West Texas Intermediate dropped 39 cents per barrel to settle at $69.16 – and coming in $76.13 below the record settle of $145.29 per barrel set on July 3, 2008. However, prices have been on an uptrend since February.
Net, more signs are pointing toward hitting bottom of the recession soon. But the data are still choppy and it is likely to be that way for some months.
 Looking in the rear view mirror, the recession in the first quarter was not as bad as feared months ago. First quarter GDP, growth was revised up marginally to an annualized 5.5 percent contraction from the prior estimate of a 5.7 percent decline. The latest number is an improvement from the fourth quarter’s 6.3 percent drop. Looking in the rear view mirror, the recession in the first quarter was not as bad as feared months ago. First quarter GDP, growth was revised up marginally to an annualized 5.5 percent contraction from the prior estimate of a 5.7 percent decline. The latest number is an improvement from the fourth quarter’s 6.3 percent drop.
The smaller decrease in real GDP in the first quarter than in the fourth primarily reflected an upturn in personal consumption expenditures (PCE) and a larger decrease in imports that were partly offset by larger decreases in private inventory investment and in nonresidential structures.
The importance of the decline in inventory investment can be seen in the much lower rate of decline for final sales which fell a moderate 3.3 percent in the first quarter, after decreasing 6.3 percent in the fourth. Demand is holding up better than production and this is good news moving forward.
Turning to inflation, the GDP price index was unrevised at an annualized 2.8 percent which matched the consensus. The headline PCE index posted a 0.9 percent decline for the latest quarter while core PCE inflation came in at an annualized 1.6 percent increase.
Next month when we get our first look at second quarter GDP, look for revisions going back several years. The BEA plans to release the results of the 13th comprehensive (or benchmark) revision of the national income and product accounts (NIPAs), as part of the annual revision on July 31, 2009. The new numbers will likely give us some changes in perspective on how severe the recession has been in terms of overall output. The National Bureau of Economic Research has put the start of recession as January 2008 but the BEA has positive GDP growth the first two quarters of that year. We may see at least one of those first two quarters move into negative territory with the annual revisions.
 Fiscal stimulus is keeping personal income robust—but consumers are spending only a fraction of the windfall from the government. Personal income in May surged far more than expected but it was nearly all related to temporary fiscal stimulus. Personal income posted a huge 1.4 percent gain in May, following a 0.7 percent boost in the month before. The advance in personal income was led by one-time payments under the American Recovery and Reinvestment Act of 2009. Fiscal stimulus is keeping personal income robust—but consumers are spending only a fraction of the windfall from the government. Personal income in May surged far more than expected but it was nearly all related to temporary fiscal stimulus. Personal income posted a huge 1.4 percent gain in May, following a 0.7 percent boost in the month before. The advance in personal income was led by one-time payments under the American Recovery and Reinvestment Act of 2009.
The boost in income from fiscal stimulus was certainly needed as job-based income declined. The wages and salaries component slipped 0.1 percent after an increase of 0.1 percent in April.
Consumer spending actually made a moderate comeback with a 0.3 percent gain after no change the month before.  The boost in consumer spending was led by a boost in auto sales as durables jumped 0.8 percent in May after dropping 1.3 percent the prior month. For the latest month, nondurables rebounded 0.5 percent, following a 0.3 percent decline in April. The services component was flat in May after jumping 0.4 percent the previous month. The boost in consumer spending was led by a boost in auto sales as durables jumped 0.8 percent in May after dropping 1.3 percent the prior month. For the latest month, nondurables rebounded 0.5 percent, following a 0.3 percent decline in April. The services component was flat in May after jumping 0.4 percent the previous month.
Spending growth has been lagging income growth as indicated by the large spike in the personal saving rate to 6.9 percent in May from 5.6 percent in April and 4.3 percent in March. Consumers are being cautious with the one-time payments from a special Social Security based stimulus package (which is not being funded from the Social Security trust fund). However, the additional income will likely help consumption in coming months.
PCE inflation remains quite modest. The headline PCE price index edged up only 0.1 percent, equaling the rise in April. Meanwhile, the core PCE price index eased to a 0.1 percent increase in May after gaining 0.3 percent the prior month. The markets had expected a 0.1 percent rise in core inflation.
 Consumer spirits continue to slowly improve from recent near record lows. The Reuters/University of Michigan consumer sentiment index rose a modest 1.8 points from mid-month to end the month at 70.8, up 1.9 points from May. While the latest gain is good news, the problem is that the degree of improvement slowed from recent months. The index had jumped nearly 4 points in May and nearly 8 points in April. Consumer spirits continue to slowly improve from recent near record lows. The Reuters/University of Michigan consumer sentiment index rose a modest 1.8 points from mid-month to end the month at 70.8, up 1.9 points from May. While the latest gain is good news, the problem is that the degree of improvement slowed from recent months. The index had jumped nearly 4 points in May and nearly 8 points in April.
The reason that the June increase was so modest is because the expectations index stalled at 69.2. Expectations often point to the future direction of the headline index. The current conditions index, the other component in the headline index, however, jumped 5-1/2 points to 73.2. Essentially, consumers are more confident that the recession is coming to an end soon but less confident about how strong the recovery will be.
 Home sales were mixed in the latest month with existing home sales posting another gain and new home sales slipping. Existing home sales in May advanced another 2.4 percent to a 4.770 million annual rate. The really good news is that supply fell to 9.6 months from 10.1 months in April. Home sales were mixed in the latest month with existing home sales posting another gain and new home sales slipping. Existing home sales in May advanced another 2.4 percent to a 4.770 million annual rate. The really good news is that supply fell to 9.6 months from 10.1 months in April.
But there are lots of interesting undercurrents in the latest data. Prices firmed, rising 3.8 percent in the month to a median $173,000 although the year-on-year decline actually deepened slightly to minus16.8 percent. The monthly rise in median prices strongly appears to be due to a shift in the composition of sales. Realtors reported a steep drop in the proportion of distressed sales, at about one-third of all sales vs. half in prior months. Many of the distressed sales have been at the low end. Why the drop in distressed sales' One possible explanation is what the existing home sales report notes, that unrealistically low appraisals are scuttling sales (appraisals coming in lower than the sales price) and slowing the housing recovery. The good news from this, however, is that when either home prices improve and/or appraisers improve their methodology (less reliance on computer models), then there could be quick improvement in home sales.
 While existing home sales continued upward, new home sales fell back in May. New home sales slipped 0.6 percent in May to an annual rate of 342,000. Sales actually rose in three of four regions during the month, but not in the South where sales fell 8.5 percent. New home sales in the South, at 184,000, make up more than the other regions combined. While existing home sales continued upward, new home sales fell back in May. New home sales slipped 0.6 percent in May to an annual rate of 342,000. Sales actually rose in three of four regions during the month, but not in the South where sales fell 8.5 percent. New home sales in the South, at 184,000, make up more than the other regions combined.
The median price rose strongly for a second straight month, up 4.2 percent in May to $221,600. Prices are down only 3.4 percent from a year ago. But the improvement in the median price for new homes has to be taken with a grain of salt. The median price does not take into account changes in the composition of sales between low-end and high-end priced homes. The Case-Shiller home price index will give us a better reading next week since it is based on repeat transactions, offsetting shifts in composition of sales between high-end and low-end.
As with existing home sales, supply on the market for new homes improved, slipping to 10.2 months from 10.4 months in April. Nonetheless, supply is still quite heavy and will continue to weigh on starts until inventories are lower.
 Manufacturing appears to be moving beyond the worst of the recession. New factory orders for durables in May came in unexpectedly strong – even after discounting transportation. Durable goods orders increased 1.8 percent in May, following a rebound also of 1.8 percent drop in April. Excluding the transportation component, new durables orders posted a 1.1 percent boost after rising 0.4 percent the month before. Manufacturing appears to be moving beyond the worst of the recession. New factory orders for durables in May came in unexpectedly strong – even after discounting transportation. Durable goods orders increased 1.8 percent in May, following a rebound also of 1.8 percent drop in April. Excluding the transportation component, new durables orders posted a 1.1 percent boost after rising 0.4 percent the month before.
 The rebound in new orders was widespread but was led by machinery and transportation. Also making gains were primary metals, and computers & electronics. Declines were seen in fabricated metals, communication equipment, electrical equipment, and "other." The rebound in new orders was widespread but was led by machinery and transportation. Also making gains were primary metals, and computers & electronics. Declines were seen in fabricated metals, communication equipment, electrical equipment, and "other."
Also moving past the worst of the recession is new orders for capital goods. Businesses boost capital investment when they expect demand to rise. Orders for nondefense capital goods jumped 10.0 percent in May after a 2.9 percent dip the month before. Even excluding aircraft, nondefense capital goods orders rose 4.8 percent after a 2.9 percent drop in April
Overall, the latest durables goods report indicates that manufacturing is easing out of recession. It is going to take at least a few months for the orders to translate into gains in production, but for now it looks like recovery is in the pipeline.
 The Fed did not surprise markets with its steady policy decision. The Federal Open Market Committee kept its target rate unchanged at zero percent to a quarter percent. In its unanimous decision, the Fed said that "economic conditions are likely to warrant exceptionally low levels of the federal funds rate for an extended period." The Fed did not surprise markets with its steady policy decision. The Federal Open Market Committee kept its target rate unchanged at zero percent to a quarter percent. In its unanimous decision, the Fed said that "economic conditions are likely to warrant exceptionally low levels of the federal funds rate for an extended period."
The Fed sees the contraction slowing but with further signs of stabilization in household spending. The consumer sector is still constrained by ongoing job losses, lower housing wealth, and tight credit. One positive change in the Fed's view is that businesses "appear to be making progress in bringing inventory stocks into better alignment with sales." This could be interpreted as meaning that the economy is marginally closer to recovery than at the previous FOMC meeting.
Although recognizing that energy and other commodity prices have risen lately, the Fed sees substantial resource slack dampening cost pressures and keeping inflation subdued for some time.
With the effective fed funds target essentially zero, policy action is now quantitative easing. The Fed kept its previously announced plans for expanding its balance sheets. This was generally expected since the Fed has not yet met its previously announced goals.
 Traders in the fed funds futures market have made only modest changes in their views on likely Fed interest rate policy over the past six months. When the Fed first cut the fed funds target to a range of zero to 0.25 percent in mid-December 2008, traders expected a gradual increase in the fed funds rate starting in spring of this year—which did not happen. After the Fed announced earlier this year that the target would remain low for some time, traders believed the Fed, incorporating no change in the rate in their trades until the futures contracts in the fall of this year. But fed funds futures traders have consistently built in expectations for rate increases occurring steadily in 2010. Nonetheless, the fed funds rate is not expected to reach 2 percent until after 2011. Traders in the fed funds futures market have made only modest changes in their views on likely Fed interest rate policy over the past six months. When the Fed first cut the fed funds target to a range of zero to 0.25 percent in mid-December 2008, traders expected a gradual increase in the fed funds rate starting in spring of this year—which did not happen. After the Fed announced earlier this year that the target would remain low for some time, traders believed the Fed, incorporating no change in the rate in their trades until the futures contracts in the fall of this year. But fed funds futures traders have consistently built in expectations for rate increases occurring steadily in 2010. Nonetheless, the fed funds rate is not expected to reach 2 percent until after 2011.
Again, the economy appears to be getting closer to bottom. Housing is starting to show signals of improvement but mainly upstream in housing indicators. The same is the case for manufacturing with the latest boost in durables orders. The consumer is not quite as shell shocked as in past months. Although we are closer to recession bottom, there is little or no change in the view that recovery is going to be sluggish.
The market moving indicators this week include ISM manufacturing on Wednesday and the monthly jobs report on Thursday. That’s right -- the employment situation report is out on Thursday since Friday is Independence Day observed. Fireworks could come early this week if the rate of payroll losses continues to shrink – stocks could surge on that news.
The Chicago PMI Business Barometer for May came in weaker-than-expected at 34.9. This reading was well below 50, indicating a significant month-to-month contraction in business activity. Signs are that the overall index will not be improving in June. New orders fell nearly 5 points to 37.3 while backlog orders fell nearly 11 points to a very depressed 26.3.
Chicago PMI Consensus Forecast for June 09: 40.0
Range: 35.0 to 44.0
The Conference Board's consumer confidence index jumped sharply for the second straight month May, rising to 54.9 from 40.8 in April. Once again, the gain was lead by the expectations index component, which at 72.3 had risen more than 20 points for a second straight month. But the assessment of current conditions showed only the slightest improvement.
Consumer confidence Consensus Forecast for June 09: 57.0
Range: 52.0 to 57.5
The Institute for Supply Management's manufacturing index continued to rise toward positive territory, improving to 42.8 in May from 40.1 in April. Although the latest reading is still in negative territory, it is the highest level since September 2008 at 43.4. Looking ahead, we may seen a further advance in June as May’s new orders index crossed over into positive territory. The new orders index rose to 51.1 from 47.2 in April. The latest figure was the first time in 17 months that this index has topped the 50 breakeven mark, indicating actual growth in new orders.
ISM manufacturing index Consensus Forecast for June 09: 45.0
Range: 41.0 to 47.5
Construction spending unexpectedly surged in April, advancing 0.8 percent after rebounding 0.4 percent in March. The boost in outlays in April was led by a 1.8 percent increase in private nonresidential outlays with private residential construction spending rebounding 0.7 percent. The public construction outlays component, however, fell 1.8 percent, following a 2.8 percent boost the month before. Looking ahead, the odds are greater for a decline that another gain. While, housing starts jumped 17.2 percent in May, the residential component in outlays will still be impacted by prior declines in starts of 12.9 percent in April and 9.2 percent in March. Nonresidential outlays are under downward pressure from low cash reserves with businesses while state and local governments are having revenue shortfalls. Meanwhile, federal fiscal stimulus for public construction has been slow to be put into progress.
Construction spending Consensus Forecast for May 09: -0.5 percent
Range: -1.2 to +0.2 percent
Nonfarm payroll employment in May was unexpectedly and significantly less negative than in recent months, falling only 345,000. The number of job losses has actually shrunk four months in a row since January’s 741,000 plunge. But the bad news was that the civilian unemployment rate jumped another five-tenths to 9.4 in May. There is speculation that the spike in unemployment was largely due to college and high school graduates not being able to obtain employment and due to the difficulty in seasonally adjusting jobless numbers this time of year. The May rate was the highest since 9.5 percent last seen in August 1983. Wage inflation remained very soft in May as average hourly earnings posted only a 0.1 percent gain. Looking ahead, job losses are likely to continue in June but the key question is whether the rate of job loss will slow. Although many analysts expect the unemployment rate to continue to rise, we could get a modest technical reversal in June as there is not as much of a surge in college graduates entering the job market.
Nonfarm payrolls Consensus Forecast for June 09: -350,000
Range: -435,000 to -225,000
Unemployment rate Consensus Forecast for June 09: 9.6 percent
Range: 9.5 to 9.7 percent
Average workweek Consensus Forecast for June 09: 33.2 percent
Range: 33.1 to 33.2 percent
Average hourly earnings Consensus Forecast for June 09: +0.2 percent
Range: +0.1 to +0.3 percent
Initial jobless claims rose for a second straight week, up 15,000 in the June 20 week to a higher-than-expected 627,000. The Labor Department noted the latest week included unexpected claims from the educational services sector, a sector that often shows seasonal variability at the end of the school year. Continuing claims, after finally breaking a six month streak of week-to-week increases in last week's report, were unable to show a second week of improvement, up 29,000 in the June 13 week to 6.738 million. Looking ahead, we could see a downtick in claims related to educational services, pulling down overall initial claims.
Jobless Claims Consensus Forecast for 6/27/09: 619,000
Range: 605,000 to 625,000
Factory orders in April rose 0.7 percent with a jump in durables more than offsetting a slip in nondurables. Overall orders should post a sizeable increase in May, given that new factory orders for durables increased 1.8 percent in May and based on an uptrend in oil prices which should boost the dollar value of nondurables orders.
Factory orders Consensus Forecast for May 09: +1.4 percent
Range: +0.2 to +2.0 percent
U.S. Holiday: Independence Day Observed. All Markets Closed.
Econoday Senior Writer Mark Pender contributed to this article.
|
