|
Equities in Asia headed north again this week as economic data continued to paint a picture of moderating decline. In Europe and the U.S. equities treaded water. While data from Germany disappointed, Japan’s GDP data were revised to show that the economy had not contracted as dreadfully as originally estimated. European industrial production and merchandise trade continued to show poor economic performance throughout the eurozone.
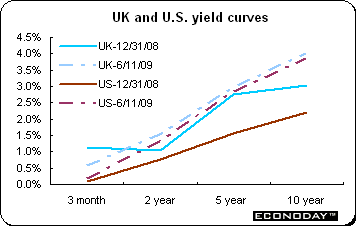 The continuing rise in bond yields especially in the U.S. and UK is stirring concerns that the economic revival could stall because of the record levels of issuance and the resulting vast debt burden taken on by the industrialized nations. The worry now is that the signs of recovery could boost the markets and force yields higher too quickly. This would in turn lead to higher interest rates for consumers and businesses, which are not yet ready to cope. Bond yields would naturally go up as tension eases and investors sell the bonds they had previously bought as a haven. But given that the Federal Reserve is intervening to keep bond yields low, and given the pattern of sell-offs after bond auctions in recent weeks, it is hard to attribute all of this to relief. Rather there is concern that the U.S. will find it difficult to fund its deficit. The continuing rise in bond yields especially in the U.S. and UK is stirring concerns that the economic revival could stall because of the record levels of issuance and the resulting vast debt burden taken on by the industrialized nations. The worry now is that the signs of recovery could boost the markets and force yields higher too quickly. This would in turn lead to higher interest rates for consumers and businesses, which are not yet ready to cope. Bond yields would naturally go up as tension eases and investors sell the bonds they had previously bought as a haven. But given that the Federal Reserve is intervening to keep bond yields low, and given the pattern of sell-offs after bond auctions in recent weeks, it is hard to attribute all of this to relief. Rather there is concern that the U.S. will find it difficult to fund its deficit.
Most indexes followed here were up on the week. However, in Asia, the Taiex, STI and Shanghai Composite slipped on the week. In Europe both the DAX and CAC inched down as investors paused for breath. All indexes are up for the year now that the Dow is above its 2008 year end level.
|
|
2008 |
2009 |
% Change |
|
Index |
Dec 31 |
Jun 5 |
Jun 12 |
Week |
Year |
| Asia |
|
|
|
|
|
|
| Australia |
All Ordinaries |
3659.3 |
3969.00 |
4061.50 |
2.3% |
11.0% |
| Japan |
Nikkei 225 |
8859.6 |
9768.01 |
10135.82 |
3.8% |
14.4% |
|
Topix |
859.2 |
916.56 |
950.54 |
3.7% |
10.6% |
| Hong Kong |
Hang Seng |
14387.5 |
18679.53 |
18889.68 |
1.1% |
31.3% |
| S. Korea |
Kospi |
1124.5 |
1394.71 |
1428.59 |
2.4% |
27.0% |
| Singapore |
STI |
1761.6 |
2396.35 |
2377.07 |
-0.8% |
34.9% |
| China |
Shanghai Composite |
1820.8 |
2753.89 |
2743.76 |
-0.4% |
50.7% |
|
|
|
|
|
|
|
| India |
Sensex 30 |
9647.3 |
15103.55 |
15237.94 |
0.9% |
58.0% |
| Indonesia |
Jakarta Composite |
1355.4 |
2078.93 |
2090.94 |
0.6% |
54.3% |
| Malaysia |
KLSE Composite |
876.8 |
1075.50 |
1090.15 |
1.4% |
24.3% |
| Philippines |
PSEi |
1872.9 |
2528.68 |
2598.80 |
2.8% |
38.8% |
| Taiwan |
Taiex |
4591.2 |
6767.10 |
6448.23 |
-4.7% |
40.4% |
| Thailand |
SET |
450.0 |
604.57 |
628.55 |
4.0% |
39.7% |
|
|
|
|
|
|
|
| Europe |
|
|
|
|
|
|
| UK |
FTSE 100 |
4434.2 |
4438.6 |
4442.0 |
0.1% |
0.2% |
| France |
CAC |
3218.0 |
3339.1 |
3326.1 |
-0.4% |
3.4% |
| Germany |
XETRA DAX |
4810.2 |
5077.0 |
5069.2 |
-0.2% |
5.4% |
|
|
|
|
|
|
|
| North America |
|
|
|
|
|
|
| United States |
Dow |
8776.4 |
8763.13 |
8799.26 |
0.4% |
0.3% |
|
NASDAQ |
1577.0 |
1849.42 |
1858.80 |
0.5% |
17.9% |
|
S&P 500 |
903.3 |
940.09 |
946.21 |
0.7% |
4.8% |
| Canada |
S&P/TSX Comp. |
8987.7 |
10569.29 |
10644.96 |
0.7% |
18.4% |
| Mexico |
Bolsa |
22380.3 |
24913.01 |
25460.02 |
2.2% |
13.8% |
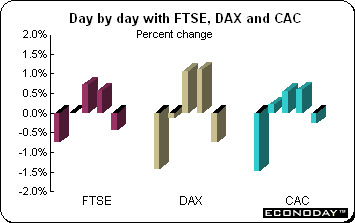 The FTSE, CAC and DAX ended the week virtually at the same place as they began the week. The three were virtually unchanged with the FTSE edging up 3.4 points while the CAC and DAX were down 12.9 and 7.8 points respectively. The FTSE managed to hang on and complete a second week up 0.2 percent above its end of 2008 level. The DAX and CAC are up 5.4 percent and 3.4 percent when compared with December 31, 2008. The FTSE, CAC and DAX ended the week virtually at the same place as they began the week. The three were virtually unchanged with the FTSE edging up 3.4 points while the CAC and DAX were down 12.9 and 7.8 points respectively. The FTSE managed to hang on and complete a second week up 0.2 percent above its end of 2008 level. The DAX and CAC are up 5.4 percent and 3.4 percent when compared with December 31, 2008.
EMU data continued to be a negative drag on equities. In Germany, both manufacturing orders and industrial production data disappointed. And exports continued to decline in Italy, France and Germany. French industrial production dropped for the eighth month but in Italy, it was up for the first time since last April. For the eurozone as a whole, the output decline showed that weakness continues unabated across the 16 member countries. The ‘good’ output news originated in the UK where manufacturing output, which was flat in March, rose in April. And surveys of service sector companies showed greater optimism. House prices appear now to be bouncing along the bottom rather than in freefall.
On Wednesday, the European Central Bank stepped in to help avert a Baltic financial crisis by lending €3 billion to the Swedish Riksbank, whose banks dominate the region’s financial sector. The ECB move signaled a new willingness to offer official European help for countries such as Latvia, which is fighting to avoid a potentially disastrous devaluation of its currency. The funds will be used to boost the central bank’s foreign reserves thereby increasing its ability to help private sector banks if necessary. Until now, the ECB has been wary about extending help beyond the borders of the eurozone.
Bank of England extends quantitative easing program
The Bank announced Monday that it plans to extend its asset purchase facility to forms of working capital. The Bank said it would begin a rapid consultation on purchasing commercial paper backed by assets such as trade receivables, equipment leases and short-term credit to consumers. Bank officials indicated the potential market size was a few billion pounds and the purchases would be financed by creating money under the £125 billion quantitative easing program. The Bank said that the program of new purchases of company debt was likely to begin shortly, possibly by the end of June. The Bank is also starting a consultation on easing the strain in supply chains with a proposal to start buying tradable securities linked to payments due from investment grade companies. The move to extend the asset purchase facility represents another step by the Bank to unfreeze parts of the credit market, where companies have struggled to finance working capital and viable business has been jeopardized.
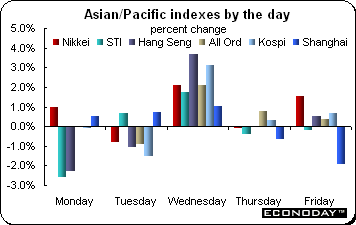 Asian/Pacific markets were up last week for the most part on increasing optimism about the global recovery. Even though positive Chinese and Japanese economic data lifted sentiment, profit taking combined with caution prior to the weekend’s G-8 meeting limited gains by week's end. Three regional indexes followed here were down for the week — STI, Shanghai Composite and Taiex. However, on Friday, the Nikkei closed above the 10,000 level for the first time since October 7, 2008. The Nikkei was helped by an upward revision to April’s industrial production data combined with an improved consumer confidence report that reinforced recovery hopes. Traders ignored an earlier release that continued to show declining machinery orders, an indication that business investment is still falling albeit at a slower pace. Brokerages advanced on expectations of higher profits thanks to the recent equity market pickup. Asian/Pacific markets were up last week for the most part on increasing optimism about the global recovery. Even though positive Chinese and Japanese economic data lifted sentiment, profit taking combined with caution prior to the weekend’s G-8 meeting limited gains by week's end. Three regional indexes followed here were down for the week — STI, Shanghai Composite and Taiex. However, on Friday, the Nikkei closed above the 10,000 level for the first time since October 7, 2008. The Nikkei was helped by an upward revision to April’s industrial production data combined with an improved consumer confidence report that reinforced recovery hopes. Traders ignored an earlier release that continued to show declining machinery orders, an indication that business investment is still falling albeit at a slower pace. Brokerages advanced on expectations of higher profits thanks to the recent equity market pickup.
China released a slew of indicators last week including data on trade, prices and industrial production. Exports and imports continued to decline in May pointing to the continued weakness in global demand. May prices were down less sharply which fuelled hopes that the government’s Rmb4,000 billion ($586 billion) stimulus program is easing deflationary pressures. May industrial output expanded 8.9 percent from a year earlier, faster than the previous month’s gain of 7.3 percent. One factor that affected the data was last year’s earthquake and the recovery of output in Sichuan Province which was up 32.5 percent in May.
Reserve Bank of New Zealand on hold at 2.5 percent
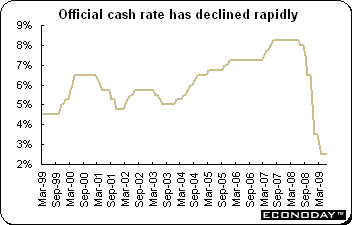 The Reserve Bank of New Zealand kept its official cash rate (OCR) at 2.5 percent. Analysts were split on whether the RBNZ would cut rates this month given early signs of a recovery in the housing markets and improving business confidence. The Bank last cut rates at its April meeting and has now lowered the OCR from 8.25 percent — and the highest of the major countries – by 5.75 percentage points to the current level as the economy slumped into its worst recession in more than three decades. The Bank originally began cutting in July 2008 to contain inflation and rapid growth. At the last RBNZ meeting, governor, Alan Bollard said that he was unlikely to raise rates until late 2010 because of the global growth outlook. He said he couldn’t rule out further reductions. The Reserve Bank of New Zealand kept its official cash rate (OCR) at 2.5 percent. Analysts were split on whether the RBNZ would cut rates this month given early signs of a recovery in the housing markets and improving business confidence. The Bank last cut rates at its April meeting and has now lowered the OCR from 8.25 percent — and the highest of the major countries – by 5.75 percentage points to the current level as the economy slumped into its worst recession in more than three decades. The Bank originally began cutting in July 2008 to contain inflation and rapid growth. At the last RBNZ meeting, governor, Alan Bollard said that he was unlikely to raise rates until late 2010 because of the global growth outlook. He said he couldn’t rule out further reductions.
GDP declined in each quarter of 2008 when compared with the previous quarter primarily due to high interest rates which had put a crimp into spending. The decline was exacerbated by the global credit crunch. Data for the first quarter 2009 will not be available until June 26 (local time). Analysts are concerned that the rising New Zealand dollar could crimp a recovery. Domestically, April house sales rose from a year earlier for a second straight month while home building approvals increased for the second time in three months and immigration growth was the strongest in five years. New Zealand businesses have become optimistic for the first time in eight months while consumer confidence in late May was the strongest since September.
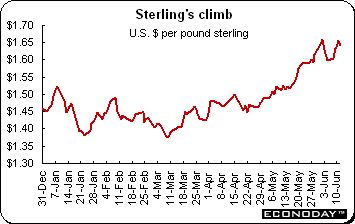 The U.S. dollar lost ground against the pound sterling. The pound hit $1.65 during the week helped by encouraging data on the UK housing market and signs that the political situation is stabilizing after the Labour party’s defeats in local and European elections. In the past month, sterling has climbed over 8 percent against the dollar and over 9 percent against the euro. Investors are now evaluating the impact of exchange rates on their portfolios. When a currency rises, companies are less competitive abroad and repatriated profits are reduced. This is a constant worry in export-oriented Japan where the yen has been subject to the vagueness of risk caused in part by carry trades as risk aversity recedes. The U.S. dollar lost ground against the pound sterling. The pound hit $1.65 during the week helped by encouraging data on the UK housing market and signs that the political situation is stabilizing after the Labour party’s defeats in local and European elections. In the past month, sterling has climbed over 8 percent against the dollar and over 9 percent against the euro. Investors are now evaluating the impact of exchange rates on their portfolios. When a currency rises, companies are less competitive abroad and repatriated profits are reduced. This is a constant worry in export-oriented Japan where the yen has been subject to the vagueness of risk caused in part by carry trades as risk aversity recedes.
Sterling reached its highest level against the euro since the start of the year after data suggested the UK recession may be over. On Wednesday the National Institute of Economic and Social Research (NIESR) estimated that the economy grew in April and May. The pound was also boosted by industrial output data which showed for the first monthly rise in 14 months. And a survey by the Bank of England showed inflation expectations for the coming year rose to 2.4 percent in May from 2.1 percent in February, the first rise since August.
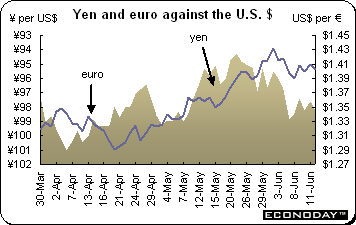 The dollar advanced against the euro and the yen Friday after Japanese Finance Minister Kaoru Yosano said his nation’s confidence in U.S. debt is “unshakable” and that the currency’s global status is safe. The statement came prior to the Group of Eight meeting in Italy and talk amongst the BRIC (Brazil, Russia, India and China) countries of looking for an alternative to the dollar as the international currency. Brazil and Russia joined China in saying they would shift about $70 billion of reserves into IMF multicurrency bonds raising concern that central banks are diversifying away from dollars. Leaders of the BRIC countries are scheduled to meet on June 16 in Russia to discuss their economies. The dollar advanced against the euro and the yen Friday after Japanese Finance Minister Kaoru Yosano said his nation’s confidence in U.S. debt is “unshakable” and that the currency’s global status is safe. The statement came prior to the Group of Eight meeting in Italy and talk amongst the BRIC (Brazil, Russia, India and China) countries of looking for an alternative to the dollar as the international currency. Brazil and Russia joined China in saying they would shift about $70 billion of reserves into IMF multicurrency bonds raising concern that central banks are diversifying away from dollars. Leaders of the BRIC countries are scheduled to meet on June 16 in Russia to discuss their economies.
Selected currencies — weekly results
|
|
2008 |
2009 |
% change |
|
|
Dec 31 |
Jun 5 |
Jun 12 |
Week |
2009 |
| U.S. $ per currency |
|
|
|
|
|
|
| Australia |
A$ |
0.711 |
0.794 |
0.813 |
2.4% |
14.4% |
| New Zealand |
NZ$ |
0.587 |
0.627 |
0.643 |
2.5% |
9.4% |
| Canada |
C$ |
0.822 |
0.894 |
0.895 |
0.1% |
8.9% |
| Eurozone |
euro (€) |
1.397 |
1.397 |
1.400 |
0.2% |
0.2% |
| UK |
pound sterling (£) |
1.459 |
1.598 |
1.643 |
2.8% |
12.6% |
|
|
|
|
|
|
|
| Currency per U.S. $ |
|
|
|
|
|
|
| China |
yuan |
6.826 |
6.833 |
6.835 |
0.0% |
-0.1% |
| Hong Kong |
HK$* |
7.750 |
7.751 |
7.750 |
0.0% |
0.0% |
| India |
rupee |
48.675 |
47.105 |
47.607 |
-1.1% |
2.2% |
| Japan |
yen |
90.740 |
98.855 |
98.370 |
0.5% |
-7.8% |
| Malaysia |
ringgit |
3.453 |
3.496 |
3.504 |
-0.2% |
-1.5% |
| Singapore |
Singapore $ |
1.433 |
1.455 |
1.451 |
0.2% |
-1.3% |
| South Korea |
won |
1259.550 |
1243.150 |
1254.025 |
-0.9% |
0.4% |
| Taiwan |
Taiwan $ |
32.820 |
32.590 |
32.786 |
-0.6% |
0.1% |
| Thailand |
baht |
34.753 |
34.230 |
34.100 |
0.4% |
1.9% |
| Switzerland |
Swiss franc |
1.066 |
1.086 |
1.081 |
0.5% |
-1.4% |
|
|
|
|
|
|
|
| *Pegged to U.S. dollar |
|
|
|
|
|
|
| Source: Bloomberg |
|
|
|
|
|
|
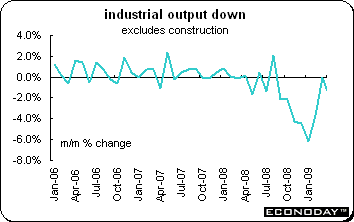
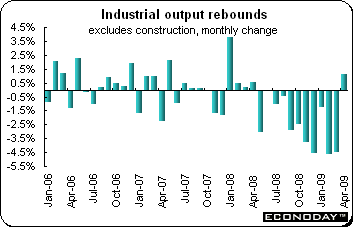
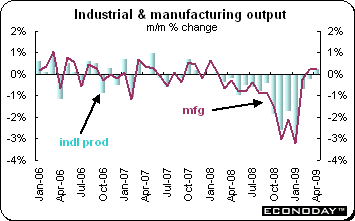
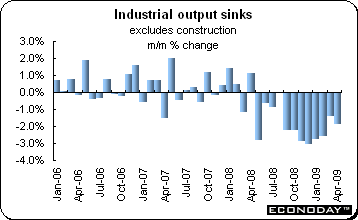 April industrial production excluding construction was down 1.9 percent — its eighth monthly decline in a row. Output was 21.6 percent weaker on the year and 3.7 percent below its first quarter average. Production was off across the board with a particularly hefty monthly drop in capital goods (2.7 percent). Intermediates were down 1.7 percent while durable consumer goods slipped 0.8 percent and nondurable consumer goods shrank 0.7 percent. Energy production fell 1.1 percent. Most reporting member states saw output decline with the exception of Spain (2.0 percent) and Italy (1.1 percent). April industrial production excluding construction was down 1.9 percent — its eighth monthly decline in a row. Output was 21.6 percent weaker on the year and 3.7 percent below its first quarter average. Production was off across the board with a particularly hefty monthly drop in capital goods (2.7 percent). Intermediates were down 1.7 percent while durable consumer goods slipped 0.8 percent and nondurable consumer goods shrank 0.7 percent. Energy production fell 1.1 percent. Most reporting member states saw output decline with the exception of Spain (2.0 percent) and Italy (1.1 percent).
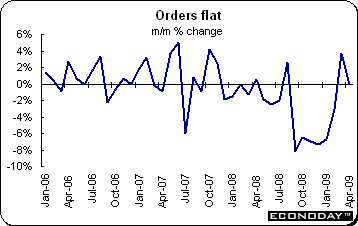 April manufacturing orders were flat on the month and were down 33.2 percent when compared with last year. April was buoyed by a hefty monthly increase in basics (6.0 percent) which, with a more modest but still sizeable increase in consumer and durable goods (2.6 percent), offset a 4.4 percent slump in capital goods. Domestic orders rose 0.6 percent but foreign orders dropped by 0.5 percent. Within the former, basic goods jumped 5.6 percent while consumer and durable goods crept up 0.4 percent and capital goods dropped 3.5 percent. Foreign orders were weighed down by a 5.1 percent fall in capital goods which more than eclipsed a 6.5 percent gain in basics and a 4.9 percent rise in consumer and durable goods. Eurozone orders dropped 0.7 percent on the month while non-EMU demand slipped 0.4 percent. April manufacturing orders were flat on the month and were down 33.2 percent when compared with last year. April was buoyed by a hefty monthly increase in basics (6.0 percent) which, with a more modest but still sizeable increase in consumer and durable goods (2.6 percent), offset a 4.4 percent slump in capital goods. Domestic orders rose 0.6 percent but foreign orders dropped by 0.5 percent. Within the former, basic goods jumped 5.6 percent while consumer and durable goods crept up 0.4 percent and capital goods dropped 3.5 percent. Foreign orders were weighed down by a 5.1 percent fall in capital goods which more than eclipsed a 6.5 percent gain in basics and a 4.9 percent rise in consumer and durable goods. Eurozone orders dropped 0.7 percent on the month while non-EMU demand slipped 0.4 percent.
 April industrial production sank 1.9 percent and was down 21.6 percent when compared with last year. Capital goods slumped 6.4 percent while basic goods fell 1.0 percent and consumer durables declined 1.4 percent. Overall manufacturing was down a sizeable 2.9 percent. However, nondurables rebounded 0.8 percent and energy was up 5.8 percent. Construction also picked up, showing a 0.5 percent increase on the month. April industrial production sank 1.9 percent and was down 21.6 percent when compared with last year. Capital goods slumped 6.4 percent while basic goods fell 1.0 percent and consumer durables declined 1.4 percent. Overall manufacturing was down a sizeable 2.9 percent. However, nondurables rebounded 0.8 percent and energy was up 5.8 percent. Construction also picked up, showing a 0.5 percent increase on the month.
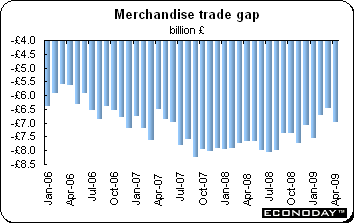
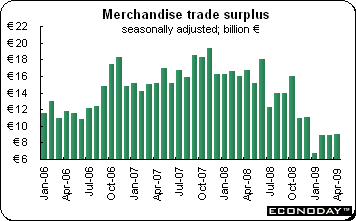 April merchandise trade surplus was essentially unchanged at E9.0B in April following an unrevised €8.9 billion in March. This was the best performance since December last year. However, both exports and imports declined 4.8 percent and 5.8 percent respectively. Both exports and imports have now fallen in six of the last seven months. Exports were down 25.6 percent on the year with shipments to the EMU bloc down almost 30 percent. Imports dropped 20.5 percent with purchases from other EMU countries falling nearly 22 percent. April merchandise trade surplus was essentially unchanged at E9.0B in April following an unrevised €8.9 billion in March. This was the best performance since December last year. However, both exports and imports declined 4.8 percent and 5.8 percent respectively. Both exports and imports have now fallen in six of the last seven months. Exports were down 25.6 percent on the year with shipments to the EMU bloc down almost 30 percent. Imports dropped 20.5 percent with purchases from other EMU countries falling nearly 22 percent.
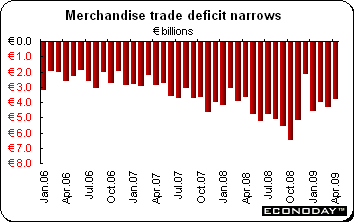 April merchandise trade deficit was €3.8 billion after a revised deficit of €4.3 billion in March. Both exports and imports were lower, down 1.7 percent and 3.1 percent respectively. The manufacturing shortfall narrowed to €2.3B mainly due to a jump in the surplus on transport. The refined oil products & coke deficit also narrowed, however the machinery, computers & other electrical items widened. Regionally, the bilateral trade gap with Germany narrowed and accounted for most of the improvement in the bottom line. The bilateral deficit with the U.S. was essentially unchanged. April merchandise trade deficit was €3.8 billion after a revised deficit of €4.3 billion in March. Both exports and imports were lower, down 1.7 percent and 3.1 percent respectively. The manufacturing shortfall narrowed to €2.3B mainly due to a jump in the surplus on transport. The refined oil products & coke deficit also narrowed, however the machinery, computers & other electrical items widened. Regionally, the bilateral trade gap with Germany narrowed and accounted for most of the improvement in the bottom line. The bilateral deficit with the U.S. was essentially unchanged.
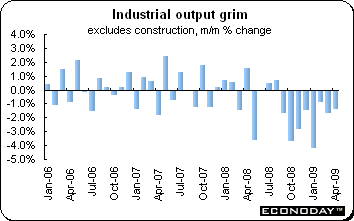 April industrial production excluding construction sank by 1.4 percent and is now down 18.6 percent when compared with last year. The main negative came from the energy sector where production nosedived almost 7 percent from March but activity contracted elsewhere as well. Food & agriculture slid 0.6 percent and refining was down 2.7 percent. Textiles & leather dropped 0.8 percent, metallurgy & metals were down 1.2 percent, mineral products sank 1.1 percent, transport goods declined 0.4 percent and wood &paper edged down 0.1 percent. However, autos rose 1.7 percent and there were also gains in electronics (0.9 percent), pharmaceuticals (0.8 percent) and chemicals (0.2 percent). Even so, overall manufacturing output was down 0.5 percent on the month and 19.5 percent on the year. April industrial production excluding construction sank by 1.4 percent and is now down 18.6 percent when compared with last year. The main negative came from the energy sector where production nosedived almost 7 percent from March but activity contracted elsewhere as well. Food & agriculture slid 0.6 percent and refining was down 2.7 percent. Textiles & leather dropped 0.8 percent, metallurgy & metals were down 1.2 percent, mineral products sank 1.1 percent, transport goods declined 0.4 percent and wood &paper edged down 0.1 percent. However, autos rose 1.7 percent and there were also gains in electronics (0.9 percent), pharmaceuticals (0.8 percent) and chemicals (0.2 percent). Even so, overall manufacturing output was down 0.5 percent on the month and 19.5 percent on the year.
 April industrial production jumped 1.1 percent but is still 24.2 percent lower on the year. The rebound was led by the consumer goods sector where production climbed a solid 2.2 percent on the month. Although energy output also expanded (1.3 percent), other areas fared less well. Capital goods production dropped a further 0.8 percent while intermediates were off 0.7 percent. April industrial production jumped 1.1 percent but is still 24.2 percent lower on the year. The rebound was led by the consumer goods sector where production climbed a solid 2.2 percent on the month. Although energy output also expanded (1.3 percent), other areas fared less well. Capital goods production dropped a further 0.8 percent while intermediates were off 0.7 percent.
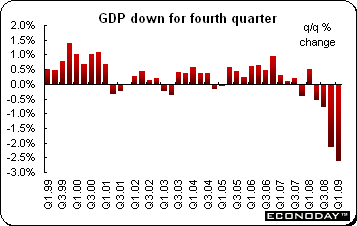 Final first quarter gross domestic product sank a revised 2.6 percent from the original estimate of a 2.4 percent decline. When compared with last year, GDP dropped 6 percent. All major areas except government declined — it was unchanged on the quarter. Private consumption dropped 1.1 percent but this was overshadowed by a huge 5.0 percent nosedive in capital investment. Exports tumbled 11.8 percent, eclipsing a 9.2 percent decline in imports. Final first quarter gross domestic product sank a revised 2.6 percent from the original estimate of a 2.4 percent decline. When compared with last year, GDP dropped 6 percent. All major areas except government declined — it was unchanged on the quarter. Private consumption dropped 1.1 percent but this was overshadowed by a huge 5.0 percent nosedive in capital investment. Exports tumbled 11.8 percent, eclipsing a 9.2 percent decline in imports.
 April industrial output was up 0.3 percent but was down 12.3 percent when compared with last year. The increase reflected a 0.2 percent gain in manufacturing output. On the year, manufacturing output was down 12.7 percent. Oil & gas extraction was up 2.5 percent while mining & quarrying was up 2.4 percent. These gains more than offset the 1.3 percent decline in utilities output. Consumer durables were down 0.6 percent and intermediates edged down 0.2 percent. However, there were respectable increases in both capital goods (0.8 percent) and consumer nondurables (0.7 percent). Within manufacturing, six of the 13 reporting industries posted monthly gains while the remainder registered fresh monthly declines. The most impressive advance was in chemicals (2.3 percent) but there was also a solid increase in engineering (1.0 percent) while the other manufacturing category edged firmer too (0.2 percent). On the downside, there were sizeable monthly drops in coke & refined petrol (4.3 percent), metals & metal products (2.1 percent) and textiles & leather (91.5 percent). April industrial output was up 0.3 percent but was down 12.3 percent when compared with last year. The increase reflected a 0.2 percent gain in manufacturing output. On the year, manufacturing output was down 12.7 percent. Oil & gas extraction was up 2.5 percent while mining & quarrying was up 2.4 percent. These gains more than offset the 1.3 percent decline in utilities output. Consumer durables were down 0.6 percent and intermediates edged down 0.2 percent. However, there were respectable increases in both capital goods (0.8 percent) and consumer nondurables (0.7 percent). Within manufacturing, six of the 13 reporting industries posted monthly gains while the remainder registered fresh monthly declines. The most impressive advance was in chemicals (2.3 percent) but there was also a solid increase in engineering (1.0 percent) while the other manufacturing category edged firmer too (0.2 percent). On the downside, there were sizeable monthly drops in coke & refined petrol (4.3 percent), metals & metal products (2.1 percent) and textiles & leather (91.5 percent).
 April merchandise trade gap widened out by a larger than expected Stg0.5 billion to Stg7.0 billion. The deterioration reflected a 2.6 percent monthly increase in imports that more than offset a 0.6 percent climb in exports. The underlying trade deficit performed in much the same fashion, posting an extra Stg0.7 billion of red ink to reach Stg6.6 billion as import growth outstripped exports. Trade with the non-EU bloc recorded a deficit of Stg4.1 billion, up sharply from a Stg3.4 billion shortfall in March and more than accounted for the deterioration in the headline data. Non-EU exports fell 2.9 percent from March while imports rose 4.4 percent. By contrast, the shortfall with the EU narrowed from Stg3.1 billion to Stg2.9 billion. April merchandise trade gap widened out by a larger than expected Stg0.5 billion to Stg7.0 billion. The deterioration reflected a 2.6 percent monthly increase in imports that more than offset a 0.6 percent climb in exports. The underlying trade deficit performed in much the same fashion, posting an extra Stg0.7 billion of red ink to reach Stg6.6 billion as import growth outstripped exports. Trade with the non-EU bloc recorded a deficit of Stg4.1 billion, up sharply from a Stg3.4 billion shortfall in March and more than accounted for the deterioration in the headline data. Non-EU exports fell 2.9 percent from March while imports rose 4.4 percent. By contrast, the shortfall with the EU narrowed from Stg3.1 billion to Stg2.9 billion.
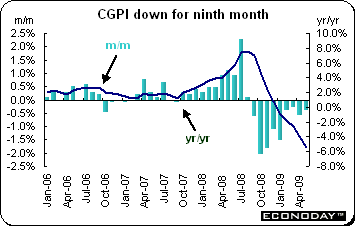 May corporate goods price index dropped 0.4 percent and plunged 5.4 percent when compared with last year. The annual rate was the fastest decline in more than 22 years. The index has now declined for nine months. Price declines are reflecting the weak demand combined with oil prices at much lower levels than this time last year. On the month, prices for most components were down. However, prices for petroleum & coal products were up 1.8 percent but were down 38.9 percent on the year while and nonferrous metals prices were up 1.2 percent but are down 29.7 percent on the year. When compared with last year, prices for transportation equipment, ceramic, stone & clay materials and pulp, paper & related products were up. May corporate goods price index dropped 0.4 percent and plunged 5.4 percent when compared with last year. The annual rate was the fastest decline in more than 22 years. The index has now declined for nine months. Price declines are reflecting the weak demand combined with oil prices at much lower levels than this time last year. On the month, prices for most components were down. However, prices for petroleum & coal products were up 1.8 percent but were down 38.9 percent on the year while and nonferrous metals prices were up 1.2 percent but are down 29.7 percent on the year. When compared with last year, prices for transportation equipment, ceramic, stone & clay materials and pulp, paper & related products were up.
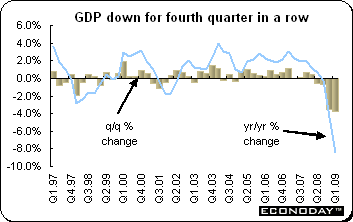 First quarter gross domestic product decline was revised to a less severe 3.8 percent drop from the original estimate of 4.0 percent decline. The quarter remains the worst on record since Japan began compiling data in 1955. When compared with last year, GDP dropped 8.4 percent and less than the originally reported 9.7 percent decline. On an annualized basis, GDP was revised to a 14.2 percent plunge, somewhat less negative than the original estimate of a 15.2 percent fall. The all important non-residential investment component decline was revised to a drop of 8.9 percent from the earlier 10.4 percent estimate. Private consumption was unrevised at decline of 1.1 percent as consumers remained cautious amid uncertainty over job security and wage growth. First quarter gross domestic product decline was revised to a less severe 3.8 percent drop from the original estimate of 4.0 percent decline. The quarter remains the worst on record since Japan began compiling data in 1955. When compared with last year, GDP dropped 8.4 percent and less than the originally reported 9.7 percent decline. On an annualized basis, GDP was revised to a 14.2 percent plunge, somewhat less negative than the original estimate of a 15.2 percent fall. The all important non-residential investment component decline was revised to a drop of 8.9 percent from the earlier 10.4 percent estimate. Private consumption was unrevised at decline of 1.1 percent as consumers remained cautious amid uncertainty over job security and wage growth.
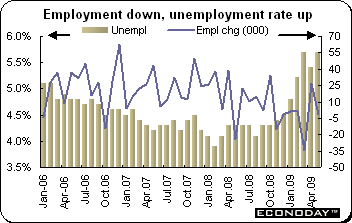 May unemployment rate jumped to 5.7 percent from a revised 5.5 percent in the previous month. At the same time, employment edged down by 1,700 jobs. Full time employment dropped by 26,200 while part time employment increased by 24,500. ABS said that it is currently revising its methods of estimating employment due to market concerns over the data’s volatility. May unemployment rate jumped to 5.7 percent from a revised 5.5 percent in the previous month. At the same time, employment edged down by 1,700 jobs. Full time employment dropped by 26,200 while part time employment increased by 24,500. ABS said that it is currently revising its methods of estimating employment due to market concerns over the data’s volatility.
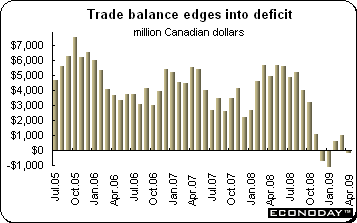 April merchandise trade deficit was C$0.18 billion. The balance had been in surplus in both February and March. The deterioration reflected a renewed decline in both imports and exports. Nominal exports were particularly weak, declining 5.1 percent on the month, thanks mainly to a 4.4 percent drop in sales to the U.S. and a 16.6 percent slump in purchases by the EU. But with overall export volumes declining only 1.9 percent, the bulk of the nominal fall could be attributed to weaker prices. Imports dropped a more modest 1.5 percent with demand for U.S. goods down 1.7 percent. Imports from the EU rose 1.2 percent and from Japan jumped nearly 8 percent. Total import volumes actually rose 0.3 percent from March. As a result, the bilateral surplus with the U.S. narrowed from C$3.5 billion to C$2.8 billion while near balance with the EU was replaced by a deficit of C$0.6 billion. Within exports, industry goods & materials fell 9.7 percent, energy products declined 8.0 percent and machinery & equipment was down 7.0 percent. All the other categories also saw declines except automotive products (up 2.7 percent) and agriculture & fishing (up 5.1 percent). Imports were depressed by an 8.4 percent slide in industrial goods & materials, compounded by a 3.3 percent drop in both machinery & equipment and agriculture & forestry. April merchandise trade deficit was C$0.18 billion. The balance had been in surplus in both February and March. The deterioration reflected a renewed decline in both imports and exports. Nominal exports were particularly weak, declining 5.1 percent on the month, thanks mainly to a 4.4 percent drop in sales to the U.S. and a 16.6 percent slump in purchases by the EU. But with overall export volumes declining only 1.9 percent, the bulk of the nominal fall could be attributed to weaker prices. Imports dropped a more modest 1.5 percent with demand for U.S. goods down 1.7 percent. Imports from the EU rose 1.2 percent and from Japan jumped nearly 8 percent. Total import volumes actually rose 0.3 percent from March. As a result, the bilateral surplus with the U.S. narrowed from C$3.5 billion to C$2.8 billion while near balance with the EU was replaced by a deficit of C$0.6 billion. Within exports, industry goods & materials fell 9.7 percent, energy products declined 8.0 percent and machinery & equipment was down 7.0 percent. All the other categories also saw declines except automotive products (up 2.7 percent) and agriculture & fishing (up 5.1 percent). Imports were depressed by an 8.4 percent slide in industrial goods & materials, compounded by a 3.3 percent drop in both machinery & equipment and agriculture & forestry.
Data last week offered promise for the UK where manufacturing output increased and NIESR said that the economy expanded in both April and May. However, data from the eurozone continued to be dour. Although German manufacturing orders were unchanged on the month, industrial production continued to slide as it did in France and for the overall EMU. The Reserve Bank of New Zealand deferred an interest rate cut so they could evaluate signs of stabilization.
The Bank of Japan meets at the beginning of the week with its interest rate at 0.1 percent and with no policy change anticipated. The only change that could occur would be to their quantitative easing program. The leaders of the BRIC countries — Brazil, Russia, India and China — plan to meet June 16th for their first formal summit to be held in the Russian Urals city of Yekaterinburg. On the agenda is a discussion of ways to reshape the global financial system along with ideas for a new reserve currency to reduce dependency on the U.S. dollar.
| Central Bank activities |
|
| June 15,16 |
Japan |
Bank of Japan Monetary Policy Meeting |
|
|
|
| The following indicators will be released this week... |
| Europe |
|
|
| June 16 |
EMU |
Harmonized Index of Consumer Prices (May) |
|
Germany |
ZEW Business Survey (June) |
|
UK |
Consumer Price Index (May) |
| June 17 |
EMU |
Merchandise Trade Balance (April) |
|
UK |
Labour Market Report (May) |
| June 18 |
Italy |
Merchandise Trade Balance (April) |
|
UK |
Retail Sales (May) |
| June 19 |
Germany |
Producer Price Index (May) |
|
|
|
| Americas |
|
|
| June 15 |
Canada |
Manufacturing Shipments (April) |
| June 18 |
Canada |
Consumer Price Index (May) |
| June 19 |
Canada |
Retail Sales (April) |
Anne D Picker is the author of International Economic Indicators and Central Banks.
|
