|
Despite a grave health threat with the swine flu epidemic and Chrysler’s plunge into bankruptcy, the majority of global equity markets were up last week. And all those followed here were up for the month of April — with most enjoying their second consecutive monthly increase. A good portion of the climb can be attributed to better than anticipated earnings and accumulating evidence that the global plunge may be leveling off.
It should be noted that all of the Asian/Pacific emerging market indexes have sizable gains so far in 2009. However, it should also be noted that those same indexes plunged over 40 percent in 2008 with the Shanghai Composite sinking 65.4 percent — the index has increased by 36.1 percent so far this year.
Equities climbed despite dreadful U.S. growth data for the first quarter and expected terrible GDP data from Europe and Japan which will not be available until mid-May. Both the Bank of Japan and Federal Reserve left their monetary policies unchanged while the Reserve Bank of New Zealand cut its overnight lending rate by 50 basis points to an historic low of 2.5 percent.
The Federal Reserve sounded a hopeful note on the U.S. economy and helped investors overcome fears over the economic impact of the spread of influenza H1N1, widely known as swine flu. And lurking in the background were the pending results of the U.S. bank stress tests. The disclosure of the results was pushed back to May 7 from May 4. Investors also noted Chrysler's bankruptcy filing but preferred to focus on the cheerier economic news. These included a smaller-than-expected drop in April South Korean exports and a Chinese manufacturing survey that suggested an improving outlook. Optimism that the global downturn may have seen its worst was also spurred by the decline in the number of U.S. jobless claims, which could be indicating that the pace of layoffs could be easing.
|
|
2008 |
2009 |
% Change |
|
Index |
Dec 31 |
Apr 24 |
May 1 |
Week |
April |
Year |
| Asia |
|
|
|
|
|
|
|
| Australia |
All Ordinaries |
3659.3 |
3668.20 |
3737.90 |
1.9% |
6.0% |
2.1% |
| Japan |
Nikkei 225 |
8859.6 |
8707.99 |
8977.37 |
3.1% |
8.9% |
1.3% |
|
Topix |
859.2 |
830.05 |
846.85 |
2.0% |
8.3% |
-1.4% |
| Hong Kong |
Hang Seng |
14387.5 |
15258.85 |
15520.99 |
1.7% |
14.3% |
7.9% |
| S. Korea |
Kospi |
1124.5 |
1354.10 |
1369.36 |
1.1% |
13.5% |
21.8% |
| Singapore |
STI |
1761.6 |
1852.85 |
1920.28 |
3.6% |
13.0% |
9.0% |
| China |
Shanghai Composite |
1820.8 |
2448.60 |
2477.57 |
1.2% |
4.4% |
36.1% |
|
|
|
|
|
|
|
|
| India |
Sensex 30 |
9647.3 |
11329.05 |
11403.25 |
0.7% |
17.5% |
18.2% |
| Indonesia |
Jakarta Composite |
1355.4 |
1591.34 |
1729.58 |
8.7% |
20.1% |
27.6% |
| Malaysia |
KLSE Composite |
876.8 |
992.68 |
990.74 |
-0.2% |
13.5% |
13.0% |
| Philippines |
PSEi |
1872.9 |
2103.63 |
2103.50 |
0.0% |
5.9% |
12.3% |
| Taiwan |
Taiex |
4591.2 |
5880.77 |
5992.57 |
1.9% |
15.0% |
30.5% |
| Thailand |
SET |
450.0 |
474.07 |
491.69 |
3.7% |
13.9% |
9.3% |
|
|
|
|
|
|
|
|
| Europe |
|
|
|
|
|
|
|
| UK |
FTSE 100 |
4434.2 |
4156.0 |
4243.2 |
2.1% |
7.8% |
-4.3% |
| France |
CAC |
3218.0 |
3102.9 |
3159.9 |
1.8% |
12.6% |
-1.8% |
| Germany |
XETRA DAX |
4810.2 |
4674.3 |
4769.5 |
2.0% |
16.8% |
-0.8% |
|
|
|
|
|
|
|
|
| North America |
|
|
|
|
|
|
|
| United States |
Dow |
8776.4 |
8076.29 |
8212.41 |
1.7% |
7.3% |
-6.4% |
|
NASDAQ |
1577.0 |
1694.29 |
1719.20 |
1.5% |
12.3% |
9.0% |
|
S&P 500 |
903.3 |
866.23 |
877.52 |
1.3% |
9.4% |
-2.8% |
| Canada |
S&P/TSX Comp. |
8987.7 |
9549.48 |
9496.96 |
-0.5% |
6.9% |
5.7% |
| Mexico |
Bolsa |
22380.3 |
22582.17 |
21898.85 |
-3.0% |
11.6% |
-2.2% |
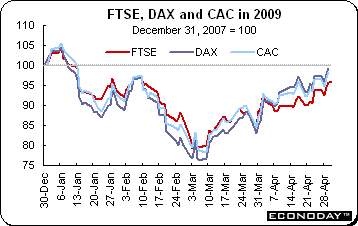 The FTSE, DAX and CAC were up for the second consecutive month in April and in the process, they put a sizable dent in their year to date losses as hopes of a global economic recovery continued to grow despite the onslaught of weak economic data. In this holiday shortened week, the CAC and DAX, which were closed Friday, gained 1.8 percent and 2.0 percent respectively and are now down 1.8 percent and 0.9 percent for the first four months. London will be closed Monday. Investors mostly shrugged off the Chrysler bankruptcy news, the delay in the stress test results along with further updates on the spread of swine flu. The FTSE, DAX and CAC were up for the second consecutive month in April and in the process, they put a sizable dent in their year to date losses as hopes of a global economic recovery continued to grow despite the onslaught of weak economic data. In this holiday shortened week, the CAC and DAX, which were closed Friday, gained 1.8 percent and 2.0 percent respectively and are now down 1.8 percent and 0.9 percent for the first four months. London will be closed Monday. Investors mostly shrugged off the Chrysler bankruptcy news, the delay in the stress test results along with further updates on the spread of swine flu.
The FTSE ended Friday with a whimper thanks to light volume. But the FTSE remained close to an 11-week high after gaining 2.1 percent for the week. For the month of April, the index jumped 7.8 percent — however, the index was 4.3 percent lower than the end of 2008. The market’s performance last week was particularly notable considering the strong headwinds of swine flu, the Chrysler bankruptcy and the looming results of the bank stress tests in the United States. Financial stocks were unsettled after they were delayed from May 4 to May 7.
 Asia/Pacific equities were up last week and were up for the month of April. All except the Topix are above their end of 2008 marks. Investors were buoyed by indications that the global slowdown might be bottoming out. Although the Federal Reserve indicated that things were leveling out in their policy announcement, U.S. GDP data for the first quarter were worse than expected. The ‘green shoot’ that existed was in the record drop in business inventories combined with a pickup in consumer spending. However, business investment showed no signs of revival. In Japan, industrial production was up for the first time since September 2008 when it barely inched upward. Most of the stock markets in the Asia/Pacific region were closed Friday for May Day or Labour Day. Asia/Pacific equities were up last week and were up for the month of April. All except the Topix are above their end of 2008 marks. Investors were buoyed by indications that the global slowdown might be bottoming out. Although the Federal Reserve indicated that things were leveling out in their policy announcement, U.S. GDP data for the first quarter were worse than expected. The ‘green shoot’ that existed was in the record drop in business inventories combined with a pickup in consumer spending. However, business investment showed no signs of revival. In Japan, industrial production was up for the first time since September 2008 when it barely inched upward. Most of the stock markets in the Asia/Pacific region were closed Friday for May Day or Labour Day.
The Nikkei closed above the 2008 year end level Friday as receding worries about the global economy and hopes of revival in corporate sector earnings growth buoyed investor sentiment. Exporters gained thanks to a weaker yen. Weaker than expected economic data were more than offset by investor sentiment that remained hopeful. Rather they are looking to the government's economic stimulus measures to gradually lift the economy. The Japanese markets are closed from Monday to Wednesday for the Golden Week holidays.
Reserve Bank of New Zealand at a record low
 As expected, the Reserve Bank of New Zealand cut its official cash rate by 50 basis points to a record low of 2.5 percent. This was the seventh consecutive time that the RBNZ has cut its key interest rate as the deepening global recession slows exports and business investment. The Bank has now cut by a total of 5.25 percentage points. The OCR was slashed by 150 basis points in January and 50 basis points in March. The Bank would like to maintain the OCR at levels attractive to offshore investors so the country can continue funding its enormous current account deficit. As expected, the Reserve Bank of New Zealand cut its official cash rate by 50 basis points to a record low of 2.5 percent. This was the seventh consecutive time that the RBNZ has cut its key interest rate as the deepening global recession slows exports and business investment. The Bank has now cut by a total of 5.25 percentage points. The OCR was slashed by 150 basis points in January and 50 basis points in March. The Bank would like to maintain the OCR at levels attractive to offshore investors so the country can continue funding its enormous current account deficit.
The Bank, which meets every six weeks, began cutting rates in July 2008 as the country fell into its worst recession in more than three decades. According to the New Zealand Treasury, companies are firing workers, consumer spending is slowing and they do not expect the economy to start growing again until 2010. Business confidence is at a 35 year low according to the New Zealand Institute of Economic Research Inc. Investment intentions were the worst since 1975 and the proportion of companies expecting to fire workers was the highest since 1991. GDP contracted in all four quarters of 2008.
In the statement accompanying the announcement, Reserve Bank governor Alan Bollard said that the Bank considers it appropriate to provide further policy stimulus to the economy. He said that they expect to keep the OCR at or below the current level until the latter part of 2010. The OCR could still move modestly lower over the coming quarters. Analysts think that the New Zealand economy is more likely to rebound because of this promise. Bollard’s pledge echoes Bank of Canada governor Mark Carney who said that he intends to keep his main interest rate at a record low 0.25 percent until the end of June 2010. The U.S. Federal Reserve said April 29 that its benchmark rate, close to zero, will probably remain exceptionally low for an extended period.
Bank of Japan
 As expected the Bank of Japan left its key interest rate at 0.1 percent where it has been since its December 2008 meeting. The monetary policy board also did not announce any new measure to enhance credit. Since cutting the key rate in December, the BoJ has been buying corporate debt and stocks to channel cash to companies struggling to raise funds. It has also increased its monthly purchases of government bonds. As expected the Bank of Japan left its key interest rate at 0.1 percent where it has been since its December 2008 meeting. The monetary policy board also did not announce any new measure to enhance credit. Since cutting the key rate in December, the BoJ has been buying corporate debt and stocks to channel cash to companies struggling to raise funds. It has also increased its monthly purchases of government bonds.
In a speech earlier this month, governor Masaaki Shirakawa said that the economy has underperformed since January and weakening spending by companies and consumers would impair growth even as declines in exports and production moderate. Japan has been pummeled by a collapse in exports and industrial production since last September.
But most attention was paid to the Bank’s semi-annual economic outlook which was released after the meeting. The Bank of Japan releases the Outlook in April and October and reviews it each January and July. The Board downgraded its growth forecast for the fiscal year ending March 2010. The GDP forecast was revised down from a 2.0 percent contraction forecast in January to 3.1 percent. The revision follows the government’s downward revision earlier in the week when they admitted that its forecast for no contraction was too optimistic. The government now forecasts a contraction of 3.3 percent for fiscal year 2009 while the IMF recently downgraded its calendar year forecast to a decline of a 6.2 percent from a drop of 0.2 percent.
 The yen fell against both the dollar and euro last week. Poor economic data contributed to the decline. Japan’s unemployment rate rose to a four-year high and signs of economic recovery in China and the U.S. encouraged investors to seek higher yields on evidence the global recession may be abating. The jump in Japan’s unemployment rate to 4.8 percent in March, from 4.4 percent the month before, showed that economies are still fragile. And the core CPI declined for the first time in more than a year. The yen declined as investors bought currencies to take advantage of higher returns outside Japan where the key interest rate is 0.1 percent, compared with 1.25 percent in the eurozone, 3 percent in Australia and 8.5 percent in South Africa. The yen fell against both the dollar and euro last week. Poor economic data contributed to the decline. Japan’s unemployment rate rose to a four-year high and signs of economic recovery in China and the U.S. encouraged investors to seek higher yields on evidence the global recession may be abating. The jump in Japan’s unemployment rate to 4.8 percent in March, from 4.4 percent the month before, showed that economies are still fragile. And the core CPI declined for the first time in more than a year. The yen declined as investors bought currencies to take advantage of higher returns outside Japan where the key interest rate is 0.1 percent, compared with 1.25 percent in the eurozone, 3 percent in Australia and 8.5 percent in South Africa.
Both the Australian and New Zealand dollars staged a rally against their major counterparts as rising global equities boosted optimism that the worst of the global financial turmoil is over and as a result, the demand for high-yielding currencies increased. The U.S. dollar was virtually unchanged against the euro on the week.
Selected currencies — weekly results
|
|
2008 |
2009 |
% change |
|
|
Dec 31 |
Apr 24 |
May 1 |
Week |
2009 |
| U.S. $ per currency |
|
|
|
|
|
|
| Australia |
A$ |
0.686 |
0.722 |
0.730 |
1.1% |
2.7% |
| New Zealand |
NZ$ |
0.579 |
0.573 |
0.571 |
-0.4% |
-2.8% |
| Canada |
C$ |
0.819 |
0.827 |
0.844 |
2.0% |
2.7% |
| Eurozone |
euro (€) |
1.405 |
1.324 |
1.326 |
0.1% |
-5.1% |
| UK |
pound sterling (£) |
1.467 |
1.465 |
1.491 |
1.8% |
2.2% |
|
|
|
|
|
|
|
| Currency per U.S. $ |
|
|
|
|
|
|
| China |
yuan |
6.841 |
6.827 |
6.823 |
0.1% |
0.0% |
| Hong Kong |
HK$* |
7.750 |
7.750 |
7.750 |
0.0% |
0.0% |
| India |
rupee |
48.435 |
49.810 |
50.155 |
-0.7% |
-3.0% |
| Japan |
yen |
90.607 |
97.145 |
99.271 |
-2.1% |
-8.6% |
| Malaysia |
ringgit |
3.479 |
3.581 |
3.569 |
0.4% |
-3.3% |
| Singapore |
Singapore $ |
1.450 |
1.489 |
1.481 |
0.5% |
-3.3% |
| South Korea |
won |
1299.550 |
1324.100 |
1287.375 |
2.9% |
-2.2% |
| Taiwan |
Taiwan $ |
33.050 |
33.701 |
32.920 |
2.4% |
-0.3% |
| Thailand |
baht |
34.975 |
35.385 |
35.290 |
0.3% |
-1.5% |
| Switzerland |
Swiss franc |
1.068 |
1.140 |
1.137 |
0.3% |
-6.2% |
|
|
|
|
|
|
|
| *Pegged to U.S. dollar |
|
|
|
|
|
|
| Source: Bloomberg |
|
|
|
|
|
|
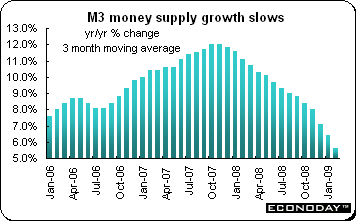 M3 money supply for the three months ending in March declined to 5.6 percent when compared with the same three months a year ago and from 6.4 percent for the previous three months. For March alone, M3 decelerated to an increase of 5.1 percent on the year from 5.8 percent. Key to the latest slowdown was a further diminution in private sector credit where 12-month growth fell from 5.7 percent to 4.7 percent. Within this, lending to the private sector eased to 3.2 percent, down 1.1 percentage points from the February pace. Loans to non-financial corporations dropped a hefty 1.4 percentage points to 6.3 percent while lending to households slid 0.3 percentage points to just 0.4 percent. Borrowing for house purchase was up a minimal 0.1 percent on the year after a 0.4 percent gain in February. By contrast, annual growth in credit extended to general government accelerated from 6.7 percent to 7.7 percent. M3 money supply for the three months ending in March declined to 5.6 percent when compared with the same three months a year ago and from 6.4 percent for the previous three months. For March alone, M3 decelerated to an increase of 5.1 percent on the year from 5.8 percent. Key to the latest slowdown was a further diminution in private sector credit where 12-month growth fell from 5.7 percent to 4.7 percent. Within this, lending to the private sector eased to 3.2 percent, down 1.1 percentage points from the February pace. Loans to non-financial corporations dropped a hefty 1.4 percentage points to 6.3 percent while lending to households slid 0.3 percentage points to just 0.4 percent. Borrowing for house purchase was up a minimal 0.1 percent on the year after a 0.4 percent gain in February. By contrast, annual growth in credit extended to general government accelerated from 6.7 percent to 7.7 percent.
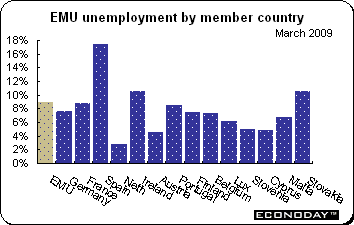 March unemployment jumped 0.2 percentage points to an 8.7 percent rate from 8.5 percent in the previous month. The number out of work swelled by 419,000 following a 395,000 increase in February raising the total unemployed to almost 14.16 million. Joblessness was up in all EMU states with the exception of the Netherlands where the rate held steady at 2.7 percent. Particularly large increases were seen in Ireland (10.0 percent from 9.4 percent), Spain (16.5 percent from 15.7 percent) and Slovakia (10.0 percent from 9.6 percent). March unemployment jumped 0.2 percentage points to an 8.7 percent rate from 8.5 percent in the previous month. The number out of work swelled by 419,000 following a 395,000 increase in February raising the total unemployed to almost 14.16 million. Joblessness was up in all EMU states with the exception of the Netherlands where the rate held steady at 2.7 percent. Particularly large increases were seen in Ireland (10.0 percent from 9.4 percent), Spain (16.5 percent from 15.7 percent) and Slovakia (10.0 percent from 9.6 percent).
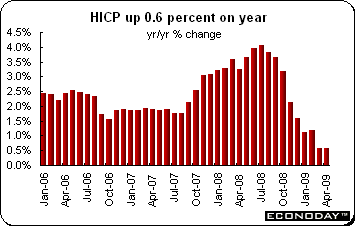 April flash harmonized index of consumer prices was up 0.6 percent on the year for a second month. As usual, no detail is available in flash releases. The stable rate was somewhat surprising given the likely effects of a late Easter which, having prompted a misleadingly sharp deceleration in March, should have made for a deceptively high reading this month. April flash harmonized index of consumer prices was up 0.6 percent on the year for a second month. As usual, no detail is available in flash releases. The stable rate was somewhat surprising given the likely effects of a late Easter which, having prompted a misleadingly sharp deceleration in March, should have made for a deceptively high reading this month.
 April economic sentiment edged up to 67.2 from 64.7 — its best reading since January. The limited recovery reflected improvements in a number of areas. Confidence was up in both the consumer (3 points to minus 31) and industrial (3 points to minus 35) sectors as well as in services (1 point to minus 24). However, both retail sentiment (minus 19 from minus 17) and construction (minus 34 from minus 32) declined. Gains in sentiment were quite widespread including Germany, France, Spain and Italy. However, there were some declines, notably Portugal and Slovenia. April economic sentiment edged up to 67.2 from 64.7 — its best reading since January. The limited recovery reflected improvements in a number of areas. Confidence was up in both the consumer (3 points to minus 31) and industrial (3 points to minus 35) sectors as well as in services (1 point to minus 24). However, both retail sentiment (minus 19 from minus 17) and construction (minus 34 from minus 32) declined. Gains in sentiment were quite widespread including Germany, France, Spain and Italy. However, there were some declines, notably Portugal and Slovenia.
 April joblessness continued to spiral higher this month with another 58,000 increase in the number out of work. It was the fifth monthly increase in a row and lifted the unemployment rate from 8.1 percent to 8.3 percent. Total unemployment now stands at 3,463 million. Vacancies followed a 17,000 decline in March with a 14,000 drop in April. April joblessness continued to spiral higher this month with another 58,000 increase in the number out of work. It was the fifth monthly increase in a row and lifted the unemployment rate from 8.1 percent to 8.3 percent. Total unemployment now stands at 3,463 million. Vacancies followed a 17,000 decline in March with a 14,000 drop in April.
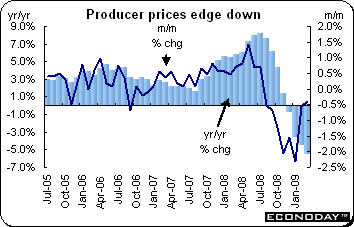 March domestic producer prices excluding construction declined 0.4 percent and were down 5.5 percent when compared with last year. The latest monthly slide was led by sharply lower prices for coke & refined petroleum products (down 3.0 percent), but there were also declines in food, drink & tobacco (down 0.2 percent), electrical equipment & computers (down 0.1 percent) and in the other manufactured products category (down 0.4 percent). The manufacturing PPI dropped 0.5 percent and was down 6.6 percent on the year. The PPI for industries dedicated to non-domestic markets was down 0.9 percent on the month and 3.0 percent on the year while import prices declined 0.3 percent and 6.7 percent respectively. March domestic producer prices excluding construction declined 0.4 percent and were down 5.5 percent when compared with last year. The latest monthly slide was led by sharply lower prices for coke & refined petroleum products (down 3.0 percent), but there were also declines in food, drink & tobacco (down 0.2 percent), electrical equipment & computers (down 0.1 percent) and in the other manufactured products category (down 0.4 percent). The manufacturing PPI dropped 0.5 percent and was down 6.6 percent on the year. The PPI for industries dedicated to non-domestic markets was down 0.9 percent on the month and 3.0 percent on the year while import prices declined 0.3 percent and 6.7 percent respectively.
 March retail sales swooned by 0.7 percent on the month and were 3.1 percent lower on the year, the worst performance in eight months. The latest monthly drop would have been steeper but for a 0.3 percent increase in food purchases. Sales of other items declined 1.0 percent. March retail sales swooned by 0.7 percent on the month and were 3.1 percent lower on the year, the worst performance in eight months. The latest monthly drop would have been steeper but for a 0.3 percent increase in food purchases. Sales of other items declined 1.0 percent.
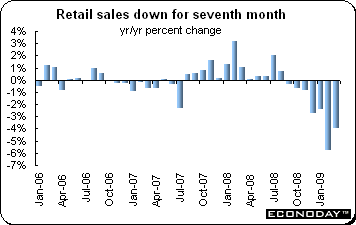 March retail sales dropped 3.9 percent when compared with last year after sinking 5.7 percent in February. This was the seventh consecutive monthly decline. The decline was less than expected. Large scale retailer swooned 6.7 percent after sinking 6.5 percent in February. March retail sales dropped 3.9 percent when compared with last year after sinking 5.7 percent in February. This was the seventh consecutive monthly decline. The decline was less than expected. Large scale retailer swooned 6.7 percent after sinking 6.5 percent in February.
 March industrial production was up 1.6 percent after plunging between 9 percent and 10 percent in each of the previous three months. This was the first month in six that industrial production increased. When compared with March 2008, output was down 35.1 percent. Production of electronic parts and devices, general machinery and electrical machinery were up on the month. Parts and accessories of steam turbines, large passenger cars and metal oxide semiconductor ICs (logic) were also up for the month. Shipments were up 1.4 percent. According to the Survey of Production Forecast in Manufacturing, production is expected to increase 4.3 percent in April and to increase 6.1 percent in May. In March, manufacturers cut inventories of unsold goods by a substantial 3.3 percent after slashing them by 4.2 percent in February. That was the biggest reduction to stocks ever made in any month since the METI began publishing data over 50 years ago. Inventories are now lower than a year ago. March industrial production was up 1.6 percent after plunging between 9 percent and 10 percent in each of the previous three months. This was the first month in six that industrial production increased. When compared with March 2008, output was down 35.1 percent. Production of electronic parts and devices, general machinery and electrical machinery were up on the month. Parts and accessories of steam turbines, large passenger cars and metal oxide semiconductor ICs (logic) were also up for the month. Shipments were up 1.4 percent. According to the Survey of Production Forecast in Manufacturing, production is expected to increase 4.3 percent in April and to increase 6.1 percent in May. In March, manufacturers cut inventories of unsold goods by a substantial 3.3 percent after slashing them by 4.2 percent in February. That was the biggest reduction to stocks ever made in any month since the METI began publishing data over 50 years ago. Inventories are now lower than a year ago.
 March unemployment rate jumped to 4.8 percent from 4.4 percent in February. Analysts had anticipated that the rate would edge up to 4.5 percent. Employment was down 62,000 on the month. Employment dropped by 910,000 when compared with last year with the employment rate declining to 56.5 percent. The labor participation rate dropped by 0.2 percent to 59.6 percent. Sinking exports and recent reductions in industrial production continue to negatively impact employment as manufacturers try to reduce their inventory over-hang. However, industrial production did rise in March giving a hopeful sign that the worst is behind. March unemployment rate jumped to 4.8 percent from 4.4 percent in February. Analysts had anticipated that the rate would edge up to 4.5 percent. Employment was down 62,000 on the month. Employment dropped by 910,000 when compared with last year with the employment rate declining to 56.5 percent. The labor participation rate dropped by 0.2 percent to 59.6 percent. Sinking exports and recent reductions in industrial production continue to negatively impact employment as manufacturers try to reduce their inventory over-hang. However, industrial production did rise in March giving a hopeful sign that the worst is behind.
 March household spending was down 0.4 percent when compared with last year. Spending sank by 3.5 percent in February. Worker household spending dropped 2 percent on the year. These data combined with retail sales released earlier this week paint a picture of a consumer who continues to be reluctant to spend. March household spending was down 0.4 percent when compared with last year. Spending sank by 3.5 percent in February. Worker household spending dropped 2 percent on the year. These data combined with retail sales released earlier this week paint a picture of a consumer who continues to be reluctant to spend.
 March national consumer price index was up 0.3 percent but down 0.3 percent when compared with last year. Core CPI excluding only fresh food was up 0.3 percent but down 0.1 percent on the year. Excluding both food and energy, the CPI was up 0.3 percent but down 0.3 percent on the year. Prices were down in seven of 11 categories on the year including food, transportation & communication, reading & recreation, clothes & footwear and furniture & utensils. Prices for goods were up 0.4 percent and down 0.7 percent on the year while services prices were up 0.2 percent both on the month and on the year. April Tokyo CPI was down 0.1 percent and down 0.2 percent on the year. Core CPI excluding fresh food was unchanged both on the month and on the year. Excluding both food and energy, the CPI edged up 0.1 percent on the month but dropped 0.6 percent on the year. March national consumer price index was up 0.3 percent but down 0.3 percent when compared with last year. Core CPI excluding only fresh food was up 0.3 percent but down 0.1 percent on the year. Excluding both food and energy, the CPI was up 0.3 percent but down 0.3 percent on the year. Prices were down in seven of 11 categories on the year including food, transportation & communication, reading & recreation, clothes & footwear and furniture & utensils. Prices for goods were up 0.4 percent and down 0.7 percent on the year while services prices were up 0.2 percent both on the month and on the year. April Tokyo CPI was down 0.1 percent and down 0.2 percent on the year. Core CPI excluding fresh food was unchanged both on the month and on the year. Excluding both food and energy, the CPI edged up 0.1 percent on the month but dropped 0.6 percent on the year.
 February monthly gross domestic product edged down 0.1 percent and was down 2.3 percent when compared with last year. Monthly GDP was down an unrevised 0.7 percent in January. The report reflected weakness in the goods producing sector where output fell 0.6 percent on the month. The drop here was led by construction (down 2.1 percent) but there were also significant declines in both utilities & mining and oil & gas extraction. Agriculture, forestry & fishing contracted but manufacturing output edged up 0.1 percent. Economic activity in services was little changed with a 0.1 percent gain on January which was the net result of a very mixed performance by the various constituent industries. The largest increase was seen in arts & entertainment (0.7 percent) followed by accommodation & food services (0.6 percent). Education, professional & scientific services and finance, insurance & real estate all posted a 0.4 percent monthly gain. Weakness in services was largely restricted to administrative & waste management, wholesale trade and retail trade. February monthly gross domestic product edged down 0.1 percent and was down 2.3 percent when compared with last year. Monthly GDP was down an unrevised 0.7 percent in January. The report reflected weakness in the goods producing sector where output fell 0.6 percent on the month. The drop here was led by construction (down 2.1 percent) but there were also significant declines in both utilities & mining and oil & gas extraction. Agriculture, forestry & fishing contracted but manufacturing output edged up 0.1 percent. Economic activity in services was little changed with a 0.1 percent gain on January which was the net result of a very mixed performance by the various constituent industries. The largest increase was seen in arts & entertainment (0.7 percent) followed by accommodation & food services (0.6 percent). Education, professional & scientific services and finance, insurance & real estate all posted a 0.4 percent monthly gain. Weakness in services was largely restricted to administrative & waste management, wholesale trade and retail trade.
 March industrial product price index was up 0.3 percent and down 0.1 percent from a year ago. Primary metals were up 1.3 percent and motor vehicles and transport equipment were up 0.9 percent. Meat, fish & dairy products were up 0.6 percent. Petroleum & coal product prices were down a modest 0.3 percent, however the steepest decline was registered by metal fabricated products, which were down 0.8 percent. Raw material prices jumped a hefty 12.1 percent on the month but still left prices 27.2 percent below their level a year ago. Higher prices for mineral fuels (25.9 percent) dominated the monthly increase. Excluding mineral fuels, the RMPI was up just 2.5 percent on the month and declined 13.9 percent from a year ago. Among the other components, prices increased for non-ferrous metals (4.8 percent), animals & animal products (3.7 percent), vegetables (1.3 percent) and ferrous metals (0.8 percent). Weaker prices were seen only in wood (0.8 percent) while non-metallic mineral costs were unchanged. March industrial product price index was up 0.3 percent and down 0.1 percent from a year ago. Primary metals were up 1.3 percent and motor vehicles and transport equipment were up 0.9 percent. Meat, fish & dairy products were up 0.6 percent. Petroleum & coal product prices were down a modest 0.3 percent, however the steepest decline was registered by metal fabricated products, which were down 0.8 percent. Raw material prices jumped a hefty 12.1 percent on the month but still left prices 27.2 percent below their level a year ago. Higher prices for mineral fuels (25.9 percent) dominated the monthly increase. Excluding mineral fuels, the RMPI was up just 2.5 percent on the month and declined 13.9 percent from a year ago. Among the other components, prices increased for non-ferrous metals (4.8 percent), animals & animal products (3.7 percent), vegetables (1.3 percent) and ferrous metals (0.8 percent). Weaker prices were seen only in wood (0.8 percent) while non-metallic mineral costs were unchanged.
Both the Bank of Japan and the Federal Reserve did not make any policy changes in their announcements last week. However, the Reserve Bank of New Zealand lowered its key interest rate to a record low of 2.5 percent. The Bank of Japan along with the Japanese government lowered their forecasts for the 2009 fiscal year that ends March 31, 2010. Data continued to be dour but they also tantalized with signs that the economies are leveling off.
The Reserve Bank of Australia, Bank of England and the European Central Bank meet this week. The RBA is expected to maintain its current interest rate at 3 percent and the Bank of England keeps its key rate at 0.5 percent. Only the ECB is expected to inch down its key rate by 25 basis points to 1 percent. And the results of the U.S. bank stress tests are now scheduled to be released on Thursday May 7.
| Central Bank activities |
|
| May 4 |
Australia |
Reserve Bank of Australia Monetary Policy Meeting |
| May 6,7 |
UK |
Bank of England Monetary Policy Meeting |
| May 7 |
EMU |
European Central Bank Policy Meeting |
|
|
|
| The following indicators will be released this week... |
| Europe |
|
|
| May 4 |
Germany |
Retail Sales (March) |
| May 5 |
EMU |
Producer Price Index (March) |
| May 6 |
EMU |
Retail Sales (March) |
| May 7 |
Germany |
manufacturers Orders (March) |
|
France |
Merchandise Trade (March) |
| May 8 |
Germany |
Industrial Production (March) |
|
|
Merchandise Trade (March) |
|
UK |
Producer Input and Output Price Index (April) |
|
|
|
| Asia/Pacific |
|
|
| May 6 |
Australia |
Retail Sales (March) |
| May 7 |
Australia |
Employment/Unemployment (April) |
|
|
|
| Americas |
|
|
| May 6 |
Canada |
Ivey Purchasing Managers Index (April) |
| May 8 |
Canada |
Employment Report (April) |
Anne D Picker is the author of International Economic Indicators and Central Banks.
|
