|
Although equities were mixed Friday as global investors paused for breath, all indexes followed here were up last week with several gaining a positive foothold over their December 31, 2008 close. Indexes in Europe, U.S. and Canada gained for the third consecutive week while those in Asia/Pacific were mixed with Taiwan’s Taiex recording five consecutive weekly gains and Indonesia’s Jakarta Composite, four. With two trading days remaining in March, all indexes with the possible exception of Malaysia’s KLSE Composite are up for the month.
U.S. economic data, which in part surprised on the upside, provided a partial catalyst to the gains. And a plethora of Congressional testimony from Treasury secretary Timothy Geithner and Fed chairman Ben Bernanke about bailout plans appeared to please investors. Gains tailed off as profit taking set in and a group of cautionary speeches by Federal Reserve district bank presidents cut into gains.
On Monday, investors were cheered by the U.S. Treasury plan details to buy up the toxic (or legacy) assets through a combination of $100 billion in TARP funds and private investment.
Risk appetite improved Thursday as economic data were not as bad as feared. Hopes that the U.S. economy was close to bottoming helped equities continue their winning streak, helped credit spreads to narrow and oil to reach a four-month high. And high-yielding currencies such as the New Zealand and Australian dollars staged a broad advance while the yen declined.
|
|
2008 |
2009 |
% Change |
|
Index |
Dec 31 |
Mar 20 |
Mar 27 |
Week |
Year |
| Asia |
|
|
|
|
|
|
| Australia |
All Ordinaries |
3659.3 |
3405.0 |
3615.6 |
6.2% |
-1.2% |
| Japan |
Nikkei 225 |
8859.6 |
7946.0 |
8627.0 |
8.6% |
-2.6% |
|
Topix |
859.2 |
764.8 |
824.5 |
7.8% |
-4.0% |
| Hong Kong |
Hang Seng |
14387.5 |
12833.5 |
14119.5 |
10.0% |
-1.9% |
| S. Korea |
Kospi |
1124.5 |
1170.9 |
1237.5 |
5.7% |
10.1% |
| Singapore |
STI |
1761.6 |
1596.9 |
1745.7 |
9.3% |
-0.9% |
| China |
Shanghai Composite |
1820.8 |
2281.1 |
2374.4 |
4.1% |
30.4% |
|
|
|
|
|
|
|
| India |
Sensex 30 |
9647.3 |
8966.7 |
10048.5 |
12.1% |
4.2% |
| Indonesia |
Jakarta Composite |
1355.4 |
1360.9 |
1462.7 |
7.5% |
7.9% |
| Malaysia |
KLSE Composite |
876.8 |
856.8 |
885.4 |
3.3% |
1.0% |
| Philippines |
PSEi |
1872.9 |
1833.9 |
2040.3 |
11.3% |
8.9% |
| Taiwan |
Taiex |
4591.2 |
4961.6 |
5390.7 |
8.6% |
17.4% |
| Thailand |
SET |
450.0 |
429.6 |
440.8 |
2.6% |
-2.0% |
|
|
|
|
|
|
|
| Europe |
|
|
|
|
|
|
| UK |
FTSE 100 |
4434.2 |
3842.9 |
3898.9 |
1.5% |
-12.1% |
| France |
CAC |
3218.0 |
2791.1 |
2840.6 |
1.8% |
-11.7% |
| Germany |
XETRA DAX |
4810.2 |
4068.7 |
4203.6 |
3.3% |
-12.6% |
|
|
|
|
|
|
|
| North America |
|
|
|
|
|
|
| United States |
Dow |
8776.4 |
7278.4 |
7776.2 |
6.8% |
-11.4% |
|
NASDAQ |
1577.0 |
1457.3 |
1545.2 |
6.0% |
-2.0% |
|
S&P 500 |
903.3 |
768.5 |
815.9 |
6.2% |
-9.7% |
| Canada |
S&P/TSX Comp. |
8987.7 |
8506.4 |
8821.1 |
3.7% |
-1.9% |
| Mexico |
Bolsa |
22380.3 |
19363.3 |
20315.2 |
4.9% |
-9.2% |
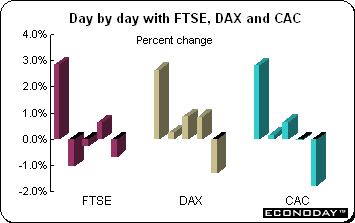 The FTSE, DAX and CAC were up for the third week and with two days of trading remaining, they are also up for the month of March. Equities responded favorably to U.S. economic data that hinted that a bottom might be near as well as the U.S. Treasury’s plan to help banks remove as much as $1 trillion in bad assets from their books. The FTSE was down three of five days. UK economic data were grim — retail sales dropped and contraction in fourth quarter gross domestic product was slightly larger than previously estimated. Investors got a scare after a UK government bond auction failed for the first time in seven years on Wednesday. The DAX gained for seven consecutive days before losing ground on Friday. The key Ifo index continued to soften while consumer prices were weaker than expected. The FTSE, DAX and CAC were up for the third week and with two days of trading remaining, they are also up for the month of March. Equities responded favorably to U.S. economic data that hinted that a bottom might be near as well as the U.S. Treasury’s plan to help banks remove as much as $1 trillion in bad assets from their books. The FTSE was down three of five days. UK economic data were grim — retail sales dropped and contraction in fourth quarter gross domestic product was slightly larger than previously estimated. Investors got a scare after a UK government bond auction failed for the first time in seven years on Wednesday. The DAX gained for seven consecutive days before losing ground on Friday. The key Ifo index continued to soften while consumer prices were weaker than expected.
The European Union has set deadlines for Member States to bring their fiscal deficits down in the next few years to limits set by the Stability and Growth Pact adopted in 1997. Under the Pact, all member nations must have an annual budget deficit of no higher than 3 percent of GDP, with some flexibility provided in times of economic slump. The EU has given Greece until 2010 to bring its deficit back under the agreed-upon limit, and France and Spain until 2012. The Commission said the UK's budget situation has worsened substantially and gave the UK until 2013-14 to get its deficit under control. The statement said the UK has not taken effective action to reduce its deficit. Ireland was given a deadline of 2013. The Commission said Ireland needs a consolidation effort amid a weak economic situation. Each nation was given six months to provide an outline of steps it will take to reign in deficits.
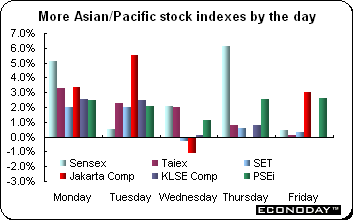
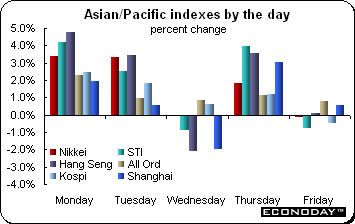 Asia/Pacific indexes followed here were up last week with gains ranging from 2.6 percent for the SET to a hefty 12.1 percent for the Sensex despite some profit-taking on Friday. Equities followed the lead set elsewhere. Details of U.S. bailout plans plus a glimmer of hope that the U.S. economy might have hit its nadir, encouraged investors. With all but two trading days left in March, all indexes save the KLSE Composite were up for the month. Several indexes in the region have narrowed their 2009 losses while others — including the Shanghai Composite, Taiex, Kospi, PSEi, Jakarta Composite, Sensex and KLSE Composite — show gains for the year. Asia/Pacific indexes followed here were up last week with gains ranging from 2.6 percent for the SET to a hefty 12.1 percent for the Sensex despite some profit-taking on Friday. Equities followed the lead set elsewhere. Details of U.S. bailout plans plus a glimmer of hope that the U.S. economy might have hit its nadir, encouraged investors. With all but two trading days left in March, all indexes save the KLSE Composite were up for the month. Several indexes in the region have narrowed their 2009 losses while others — including the Shanghai Composite, Taiex, Kospi, PSEi, Jakarta Composite, Sensex and KLSE Composite — show gains for the year.
 In Japan, investors were encouraged to buy exporters’ stocks as the yen weakened on the week and on a less pessimistic view of the U.S. economy. A weaker yen helps repatriated profits along with making products more competitive overseas. Data released on Friday showed that retail sales plunged 5.8 percent on the year, the most in seven years. It was the sixth straight monthly decline. Sales by large scale retailers were down 8.2 percent following an upwardly revised decline of 5.5 percent in January. And consumer price data teetered around zero, threatening that deflation could once again hammer the beleaguered economy. The February national price data were partially offset by the March Tokyo data for both the overall index and core. The Tokyo data which are considered an indicator of the next month’s national data were up. In Japan, investors were encouraged to buy exporters’ stocks as the yen weakened on the week and on a less pessimistic view of the U.S. economy. A weaker yen helps repatriated profits along with making products more competitive overseas. Data released on Friday showed that retail sales plunged 5.8 percent on the year, the most in seven years. It was the sixth straight monthly decline. Sales by large scale retailers were down 8.2 percent following an upwardly revised decline of 5.5 percent in January. And consumer price data teetered around zero, threatening that deflation could once again hammer the beleaguered economy. The February national price data were partially offset by the March Tokyo data for both the overall index and core. The Tokyo data which are considered an indicator of the next month’s national data were up.
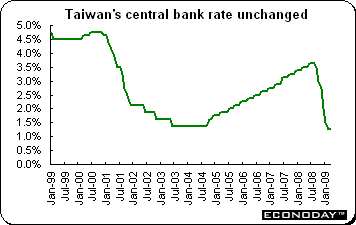 The Taiwanese central bank left its policy discount interest rate unchanged at 1.25 percent — an historical low — at its quarterly policy meeting. The Bank had lowered rates seven times since last September, with total rate cut of 237.5 basis points. The Bank noted that while the global economic outlook remains uncertain, there have been gathering signs that the previous sharp slide in economic activity may have begun to stabilize, as seen in recent improvement in export orders for selected industries; generally positive response to the government's shopping coupon program, improving tourist inflows and the stabilizing stock market. It said that Taiwan’s financial system remains stable with abundant liquidity. The Taiwanese central bank left its policy discount interest rate unchanged at 1.25 percent — an historical low — at its quarterly policy meeting. The Bank had lowered rates seven times since last September, with total rate cut of 237.5 basis points. The Bank noted that while the global economic outlook remains uncertain, there have been gathering signs that the previous sharp slide in economic activity may have begun to stabilize, as seen in recent improvement in export orders for selected industries; generally positive response to the government's shopping coupon program, improving tourist inflows and the stabilizing stock market. It said that Taiwan’s financial system remains stable with abundant liquidity.
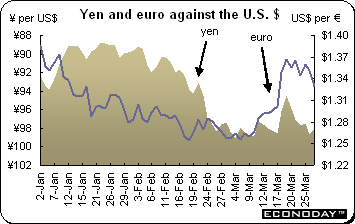 Both the euro and yen were down against the U.S. dollar last week. The euro extended losses after Germany warned that fiscal irresponsibility in Europe threatened the currency. Peer Steinbrück, Germany’s finance minister, said the euro was at risk if the European Union’s stability and growth pact was not taken seriously by its members. The EU’s Stability and Growth Pact limits debt to 3 percent of gross domestic product. EU nations’ budget shortfall will more than double to 4.4 percent of GDP this year, the biggest deficit in 13 years, as governments pump billions of euros into their economies to stave off the worst economic slump since World War II. More than 20 EU countries may overshoot the euro area’s 3 percent budget-deficit rule in 2010. Both the euro and yen were down against the U.S. dollar last week. The euro extended losses after Germany warned that fiscal irresponsibility in Europe threatened the currency. Peer Steinbrück, Germany’s finance minister, said the euro was at risk if the European Union’s stability and growth pact was not taken seriously by its members. The EU’s Stability and Growth Pact limits debt to 3 percent of gross domestic product. EU nations’ budget shortfall will more than double to 4.4 percent of GDP this year, the biggest deficit in 13 years, as governments pump billions of euros into their economies to stave off the worst economic slump since World War II. More than 20 EU countries may overshoot the euro area’s 3 percent budget-deficit rule in 2010.
Elsewhere the dollar was supported by comments from Japanese and Russian officials saying the currency’s global reserve status would not be questioned at Thursday’s G20 meeting. This was after China’s call for a global reserve currency to take the place of the dollar won the support of central bank heads in Indonesia, Malaysia and Thailand, who said it would help curb volatility and foster trade.
A rebound in global equity markets appears to have prompted the return of the carry trade. The strategy, which involves selling lower-yielding currencies, such as the yen, to fund the purchase of higher-yielding assets elsewhere, was popular among investors prior to the financial crisis. The strategy rests not just on interest differentials, but also on stability in asset markets since a sharp fall in the value of an investor’s target investment can wipe out any yield advantage of funding through a low-yielding currency. Indeed, the turmoil on financial markets saw investors scramble to unwind carry trades as asset prices plunged. This deleveraging sent the yen sharply higher.
Selected currencies — weekly results
|
|
2008 |
2009 |
% change |
|
|
Dec 31 |
Mar 20 |
Mar 27 |
Week |
2009 |
| U.S. $ per currency |
|
|
|
|
|
|
| Australia |
A$ |
0.686 |
0.686 |
0.693 |
1.0% |
-2.6% |
| New Zealand |
NZ$ |
0.579 |
0.558 |
0.570 |
2.1% |
-3.0% |
| Canada |
C$ |
0.819 |
0.807 |
0.808 |
0.2% |
-1.7% |
| Eurozone |
euro (€) |
1.405 |
1.355 |
1.330 |
-1.9% |
-4.8% |
| UK |
pound sterling (£) |
1.467 |
1.443 |
1.430 |
-0.9% |
-2.0% |
|
|
|
|
|
|
|
| Currency per U.S. $ |
|
|
|
|
|
|
| China |
yuan |
6.841 |
6.828 |
6.833 |
-0.1% |
-0.1% |
| Hong Kong |
HK$* |
7.750 |
7.750 |
7.750 |
0.0% |
0.0% |
| India |
rupee |
48.435 |
50.650 |
50.575 |
0.1% |
-3.8% |
| Japan |
yen |
90.607 |
95.913 |
97.932 |
-2.1% |
-7.3% |
| Malaysia |
ringgit |
3.479 |
3.665 |
3.635 |
0.8% |
-5.0% |
| Singapore |
Singapore $ |
1.450 |
1.516 |
1.514 |
0.1% |
-5.4% |
| South Korea |
won |
1299.550 |
1406.700 |
1351.450 |
4.1% |
-6.8% |
| Taiwan |
Taiwan $ |
33.050 |
33.787 |
33.769 |
0.1% |
-2.8% |
| Thailand |
baht |
34.975 |
35.325 |
35.361 |
-0.1% |
-1.7% |
| Switzerland |
Swiss franc |
1.068 |
1.129 |
1.143 |
-1.2% |
-6.7% |
|
|
|
|
|
|
|
| *Pegged to U.S. dollar |
|
|
|
|
|
|
| Source: Bloomberg |
|
|
|
|
|
|
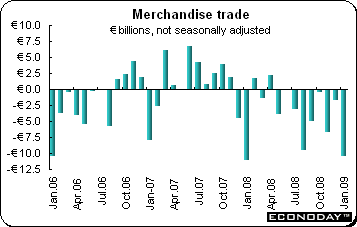 January seasonally adjusted merchandise trade gap widened out to €5.5 billion. At the same time, the cumulative red ink for the previous three months was also revised up by nearly 47 percent to €9.4 billion. Imports slumped 7.3 percent on the month only to be eclipsed by an even steeper 10.7 percent slump in exports. Compared with January 2008, imports were down 22.5 percent and exports were off 24.1 percent. The unadjusted deficit in January alone stood at €10.5 billion compared with €11.1 billion in the year ago period. January seasonally adjusted merchandise trade gap widened out to €5.5 billion. At the same time, the cumulative red ink for the previous three months was also revised up by nearly 47 percent to €9.4 billion. Imports slumped 7.3 percent on the month only to be eclipsed by an even steeper 10.7 percent slump in exports. Compared with January 2008, imports were down 22.5 percent and exports were off 24.1 percent. The unadjusted deficit in January alone stood at €10.5 billion compared with €11.1 billion in the year ago period.
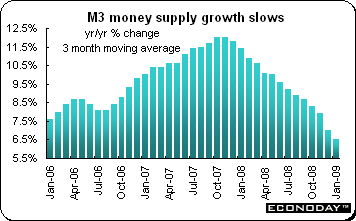 M3 money supply for the three months to February was up 6.5 percent when compared with the same three months a year earlier. For February, M3 was up 5.9 percent on the year. Key to the latest deceleration was a further decline in credit growth. Loans to the private sector were up 4.2 percent on the year in February compared with 5.0 percent in the previous month. Within this lending to business eased to a 7.6 percent annual pace from 8.8 percent while household loan growth slowed to just 0.7 percent from 1.2 percent. M3 money supply for the three months to February was up 6.5 percent when compared with the same three months a year earlier. For February, M3 was up 5.9 percent on the year. Key to the latest deceleration was a further decline in credit growth. Loans to the private sector were up 4.2 percent on the year in February compared with 5.0 percent in the previous month. Within this lending to business eased to a 7.6 percent annual pace from 8.8 percent while household loan growth slowed to just 0.7 percent from 1.2 percent.
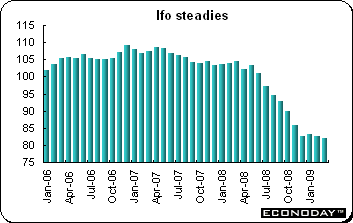 February Ifo economic sentiment index edged down to a new record low of 82.1. The decline reflected a modest slip in current conditions to 82.7 and a further small gain in expectations to 81.6. At a sector level, confidence fell in all areas except construction. Retail saw a disappointingly large 3.9 point drop to minus 28.2 while wholesale declined 3.7 points to minus 31.6 and services shed 3.5 points to minus 10.0. Manufacturing was essentially unchanged but still very weak. February Ifo economic sentiment index edged down to a new record low of 82.1. The decline reflected a modest slip in current conditions to 82.7 and a further small gain in expectations to 81.6. At a sector level, confidence fell in all areas except construction. Retail saw a disappointingly large 3.9 point drop to minus 28.2 while wholesale declined 3.7 points to minus 31.6 and services shed 3.5 points to minus 10.0. Manufacturing was essentially unchanged but still very weak.
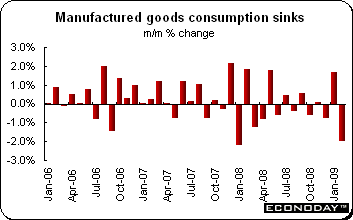 February consumption of manufactured goods sank 2 percent both on the month and on the year. The largest decline among the main product categories occurred in textiles & leather where purchases slumped 8.7 percent on the month. However, outside of the auto sector where sales edged up 0.3 percent, declines were broad-based. Total durables slid 0.5 percent while household durables were down 1.2 percent. Other manufactured goods were off 0.3 percent. February consumption of manufactured goods sank 2 percent both on the month and on the year. The largest decline among the main product categories occurred in textiles & leather where purchases slumped 8.7 percent on the month. However, outside of the auto sector where sales edged up 0.3 percent, declines were broad-based. Total durables slid 0.5 percent while household durables were down 1.2 percent. Other manufactured goods were off 0.3 percent.
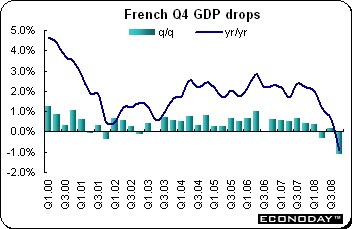 Final fourth quarter gross domestic product contracted 1.1 percent and was down 0.9 percent when compared with last year. Calendar year growth in 2008 was 0.7 percent, down from 2.1 percent in 2007. Investment dropped 1.4 percent. It was weighed down by a decline among non-financial corporations (2.0 percent). Weakness here combined with a negative contribution from both inventories (down 0.8 percent) and net exports (down 0.3 percent). Private consumption posted a modest advance (0.3 percent) while government current spending edged up 0.2 percent. Final domestic demand declined by 0.1 percent. Final fourth quarter gross domestic product contracted 1.1 percent and was down 0.9 percent when compared with last year. Calendar year growth in 2008 was 0.7 percent, down from 2.1 percent in 2007. Investment dropped 1.4 percent. It was weighed down by a decline among non-financial corporations (2.0 percent). Weakness here combined with a negative contribution from both inventories (down 0.8 percent) and net exports (down 0.3 percent). Private consumption posted a modest advance (0.3 percent) while government current spending edged up 0.2 percent. Final domestic demand declined by 0.1 percent.
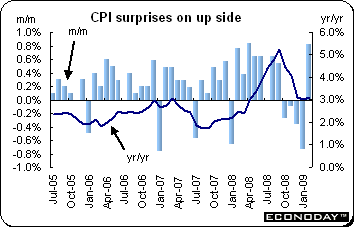 February consumer price index jumped 0.9 percent and was up 3.2 percent when compared with last year. There were hefty jumps in food & non-alcoholic beverages (11.5 percent from 10.2 percent) and in furniture & household equipment (3.2 percent from 2.2 percent) but 12-months rates also accelerated in alcohol & tobacco (5.7 percent from 5.3 percent), health (2.4 percent from 2.2 percent) and miscellaneous goods & services (3.2 percent from 3.0 percent). In addition, disinflation in communication became much less marked (0.7 percent from 2.0 percent). The only group to see a significant deceleration in prices was housing, utilities & fuels (10.0 percent from 13.6 percent) while inflation rates in education and restaurants & hotels were unchanged. February consumer price index jumped 0.9 percent and was up 3.2 percent when compared with last year. There were hefty jumps in food & non-alcoholic beverages (11.5 percent from 10.2 percent) and in furniture & household equipment (3.2 percent from 2.2 percent) but 12-months rates also accelerated in alcohol & tobacco (5.7 percent from 5.3 percent), health (2.4 percent from 2.2 percent) and miscellaneous goods & services (3.2 percent from 3.0 percent). In addition, disinflation in communication became much less marked (0.7 percent from 2.0 percent). The only group to see a significant deceleration in prices was housing, utilities & fuels (10.0 percent from 13.6 percent) while inflation rates in education and restaurants & hotels were unchanged.
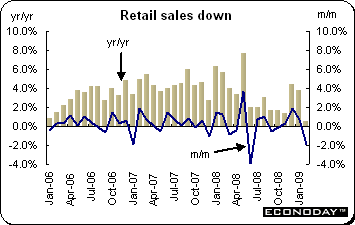 February retail sales dropped 1.9 percent after gains in both December and January. On the year, sales volumes were up 0.5 percent. Overall purchases were undermined by particular weakness in the non-food area where volumes collapsed by 3.2 percent on the month. Clothing & footwear swooned by 3.7 percent and may well have been affected by unseasonably poor weather. Sales at non-specialized stores and in household goods, other stores (4.8 percent) and in non-store retailing all declined as well. Food sales edged down a relatively mild 0.3 percent. February retail sales dropped 1.9 percent after gains in both December and January. On the year, sales volumes were up 0.5 percent. Overall purchases were undermined by particular weakness in the non-food area where volumes collapsed by 3.2 percent on the month. Clothing & footwear swooned by 3.7 percent and may well have been affected by unseasonably poor weather. Sales at non-specialized stores and in household goods, other stores (4.8 percent) and in non-store retailing all declined as well. Food sales edged down a relatively mild 0.3 percent.
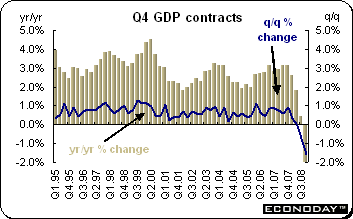 Fourth quarter gross domestic product contracted 1.6 percent and was the worst quarterly performance since 1980. The annual decline was 2.0 percent. The quarterly decline had previously been estimated at 1.5 percent and the annual decline, 1.9 percent. The quarterly downward revision mainly reflected a sharper revised drop in household spending (1.0 percent from 0.7 percent) that more than offset a shallower fall in fixed investment (1.4 percent from 2.3 percent). Growth was also made more negative courtesy of a smaller increase in government spending (1.3 percent from 1.5 percent) but would have been markedly worse still but for a 0.7 percentage point contribution from net exports. By sector, industrial production slumped 4.5 percent on the quarter while services output fell 0.8 percent. At the same time, construction sector activity was revised sharply weaker and now shows a 4.9 percent drop on the quarter compared with the 1.1 percent original estimate, the largest decline since the end of 1980. Fourth quarter gross domestic product contracted 1.6 percent and was the worst quarterly performance since 1980. The annual decline was 2.0 percent. The quarterly decline had previously been estimated at 1.5 percent and the annual decline, 1.9 percent. The quarterly downward revision mainly reflected a sharper revised drop in household spending (1.0 percent from 0.7 percent) that more than offset a shallower fall in fixed investment (1.4 percent from 2.3 percent). Growth was also made more negative courtesy of a smaller increase in government spending (1.3 percent from 1.5 percent) but would have been markedly worse still but for a 0.7 percentage point contribution from net exports. By sector, industrial production slumped 4.5 percent on the quarter while services output fell 0.8 percent. At the same time, construction sector activity was revised sharply weaker and now shows a 4.9 percent drop on the quarter compared with the 1.1 percent original estimate, the largest decline since the end of 1980.
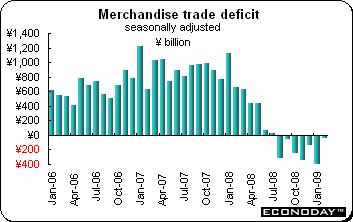 February unadjusted merchandise trade once again recorded a surplus of 82.4 billion yen after January’s deficit of 952.6 billion yen deficit. Unadjusted exports plunged 49.4 percent when compared with February a year ago while imports sank 43 percent. Exports and imports with the U.S. swooned 58.4 percent and 36.2 percent respectively on the year. The balance with the U.S. was down 79 percent. Exports to the U.S. are now down for 18 consecutive months. Exports also plummeted with the European Union – they were down 54.7 percent while imports dropped 29.5 percent. Trade with Asia dropped 46.3 percent while imports declined by 41.5 percent on the year. On a seasonally adjusted basis, the trade balance was negative for the seventh month. In February the trade deficit was 43.3 billion yen. Sinking trade has dramatically fed through to the rest of the economy and especially industrial production which has plummeted about 10 percent in each of the last two months. February unadjusted merchandise trade once again recorded a surplus of 82.4 billion yen after January’s deficit of 952.6 billion yen deficit. Unadjusted exports plunged 49.4 percent when compared with February a year ago while imports sank 43 percent. Exports and imports with the U.S. swooned 58.4 percent and 36.2 percent respectively on the year. The balance with the U.S. was down 79 percent. Exports to the U.S. are now down for 18 consecutive months. Exports also plummeted with the European Union – they were down 54.7 percent while imports dropped 29.5 percent. Trade with Asia dropped 46.3 percent while imports declined by 41.5 percent on the year. On a seasonally adjusted basis, the trade balance was negative for the seventh month. In February the trade deficit was 43.3 billion yen. Sinking trade has dramatically fed through to the rest of the economy and especially industrial production which has plummeted about 10 percent in each of the last two months.
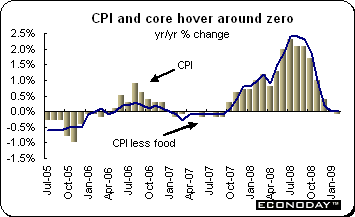 February national consumer price index declined 0.3 percent and was down 0.1 percent when compared with last year. Core CPI which excludes just fresh food edged down 0.1 percent on the month and was unchanged on the year. Core excluding both food and energy was down 0.2 percent and down 0.1 percent on the year. March Tokyo CPI which is often considered a precursor of the national data was up 0.3 percent and 0.2 percent on the year. Core excluding fresh food for the Tokyo index was up 0.3 percent and 0.4 percent on the year. The CPI has straddled the unchanged mark for three months. For the national CPI, most major categories were down on the month with the exception of transportation & communication and education. On the year, prices were mixed with transportation & communication down 5.5 percent and reading & recreation down 1.3 percent. The goods CPI dropped 0.5 percent on the month and 0.3 percent on the year while services edged down 0.1 percent on the month but inched up 0.2 percent on the year. February national consumer price index declined 0.3 percent and was down 0.1 percent when compared with last year. Core CPI which excludes just fresh food edged down 0.1 percent on the month and was unchanged on the year. Core excluding both food and energy was down 0.2 percent and down 0.1 percent on the year. March Tokyo CPI which is often considered a precursor of the national data was up 0.3 percent and 0.2 percent on the year. Core excluding fresh food for the Tokyo index was up 0.3 percent and 0.4 percent on the year. The CPI has straddled the unchanged mark for three months. For the national CPI, most major categories were down on the month with the exception of transportation & communication and education. On the year, prices were mixed with transportation & communication down 5.5 percent and reading & recreation down 1.3 percent. The goods CPI dropped 0.5 percent on the month and 0.3 percent on the year while services edged down 0.1 percent on the month but inched up 0.2 percent on the year.
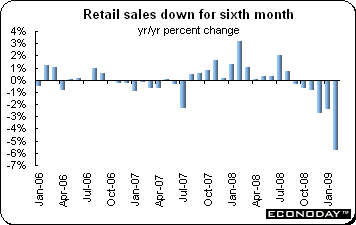 February retail sales plunged 5.8 percent when compared with the same month a year ago. This was the sixth straight month that sales have declined. However, the drop in sales for large scale retailers was much worse – they dropped 8.2 percent. February retail sales plunged 5.8 percent when compared with the same month a year ago. This was the sixth straight month that sales have declined. However, the drop in sales for large scale retailers was much worse – they dropped 8.2 percent.
A little ray of sunshine basked investors last week as many U.S. indicators registered results that were better than expected. However in Japan, retail sales plummeted and consumer prices hovered around zero. Investors finally learned the details of the U.S. Treasury’s bailout plan while in the UK the Bank of England began its quantitative easing program in earnest.
The European Central Bank meets Thursday and is expected to cut its key interest rate for the second month to 1 percent. Also on Thursday, attention will turn to London for the Group of 20 economic summit. A number of key issues are on the table, but much attention will be paid to whether a coherent approach to the global economic crisis can be hammered out. Most countries continue to look to the U.S. for a way out of this mess.
| Central Bank activities |
|
| April 2 |
EMU |
European Central Bank Meeting |
|
|
|
| Other Events |
|
|
| April 2 |
London |
Group of 20 Summit |
|
|
|
| The following indicators will be released this week... |
| Europe |
|
|
| March 30 |
EU |
Business and Consumer Confidence (March) |
|
Germany |
Retail Sales (February) |
| March 31 |
EMU |
Harmonized Index of Consumer Prices (March, flash) |
|
Germany |
Unemployment Rate (March) |
| April 1 |
EMU |
Unemployment Rate (February) |
| April 2 |
France |
Producer Price Index (February) |
| April 3 |
Italy |
Producer Price Index (February) |
|
|
|
| Asia/Pacific |
|
|
| March 30 |
Japan |
Industrial Production (February) |
| March 31 |
Japan |
Unemployment Rate (February) |
|
|
Household Spending (February) |
| April 1 |
Japan |
Tankan Survey (Q1.2009) |
|
Australia |
Retail Sales (February) |
|
|
|
| Americas |
|
|
| March 31 |
Canada |
Monthly Gross Domestic Product (January) |
|
|
Industrial Product Price Index (February) |
Anne D Picker is the author of International Economic Indicators and Central Banks.
|

