|
Investors remained indifferent at best to official attempts to ease credit conditions and continued to dump equities. The credit markets remained frozen. The yen traded around the 100 yen to the U.S. dollar level as carry trade became a thing of the past. Glamour currencies such as the New Zealand and Australian dollars sank along with those in emerging markets including the Mexican peso, Malaysian ringgit and the Indian rupee. And equity markets, Indonesia suspended share trading indefinitely while Russia’s most liquid stock exchange, the ruble-denominated MICEX, suspended trading for two days after blue chips tracked Wall Street’s hefty losses.
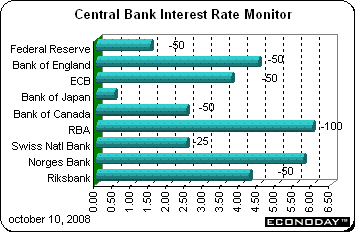 A flurry of central bank activity in concert with other banks and alone marked the week. The Reserve Bank of Australia, at its regularly scheduled meeting Tuesday (local time) surprised analysts and lowered its key rate by 1 full percentage point to 6 percent. At the same time, the Bank of Japan, with little room to maneuver, left its key rate at 0.5 percent. A flurry of central bank activity in concert with other banks and alone marked the week. The Reserve Bank of Australia, at its regularly scheduled meeting Tuesday (local time) surprised analysts and lowered its key rate by 1 full percentage point to 6 percent. At the same time, the Bank of Japan, with little room to maneuver, left its key rate at 0.5 percent.
A wakeup call came 7 AM U.S. ET Wednesday morning when the Federal Reserve, Banks of Canada and England, European Central Bank, Swiss National Bank and Sweden’s Riksbank lowered their policy rates in a coordinated move. All lowered rates by 50 basis points with the exception of the SNB — the Swiss lowered rates by 25 basis points. The Bank of Japan supported the action. Shortly thereafter, the People’s Bank of China also lowered its interest rate by 27 basis points along with a reduction in reserve requirements. And the Reserve Bank of India also lowered its key interest rate by 50 basis points. Other central banks followed included the Central Bank of the Republic of China (Taiwan), the United Arab Emirates, South Korea and Hong Kong. The Monetary Authority of Singapore, which relies on currency rather than interest rates as its policy tool, said it was shifting to a “zero-percent appreciation” stance — that is easing policy.
But the coordinated cut in interest rates by central banks around the world failed to lift the gloom hanging over global financial markets. The dramatic moves, although initially buoying equities, increased worries over the state of the global economy and the damaging effects of the financial crisis.
Group of Seven meets, announces plan
The Group of Seven — Japan, Canada, Britain, Germany, France, Italy and the United States — agreed on guidelines but did not put forth a joint effort to repair the broken global financial system that investors sought. Rather it was left to the individual countries to decide their own direction. In the five-point plan the Group of Seven broadly endorsed the idea of taking ownership positions in banks — a strategy first adopted by Britain and now emerging as a major part of the rescue effort in the United States. But the nations were vague on how or when that will happen, and did not endorse a proposal by Britain to provide coordinated guarantees of lending between banks as a way to melt frozen credit markets. Many investors had hoped the meeting would result in more concrete steps to restore the paralyzed credit markets and lay out a blueprint for recapitalizing banks.
The discussions focused on the growing likelihood that the United States and several major European countries would have to partially nationalize their banking systems. Germany remains deeply reluctant about such a course because of fears that it would end up bailing out the banks of its neighbors. While the leaders managed to gloss over any rifts when they emerged from their meeting, their lack of agreement on a British-style guarantee of loans made between banks was worrisome. None of the ministers or central bankers was sure the emerging plan would work, but with stock markets plummeting and banks unable to borrow from each other even overnight, they agreed a bold initiative was essential.
Many investors and traders had hoped for a dramatic G-7 accord, such as an agreement to guarantee bank debt to quell further market chaos. Instead, the countries said they would use all tools to prevent systemically important financial institutions from failing. They also said they would ensure that bank deposit insurance programs are solid and that banks can raise capital from private or government sources. They would take steps to unfreeze credit and money markets and ensure that financial institutions have access to liquidity. One principle is that no country should take a step that worsens conditions in another.
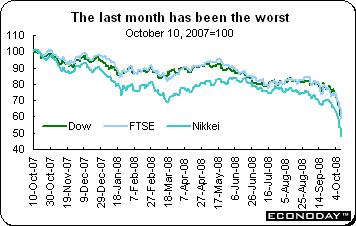
What a week in equities! Analysts were sent scurrying for the record books as each successive low was passed and as distressed selling pulled indexes ever lower. Several markets did not open including Indonesia and Russia. Even though the credit crunch began with the demise of Bear Stearns in March, equities did not crumble until mid-September when Lehman was allowed to go under. A recession mentality set in — and with it, the recognition that the problems are global. Investors dumped stocks. The positive note is that many governments are addressing the problems — some at warp speed. But investors have little patience to wait until mechanisms can be put in place to begin the cure. At the end of the week, many records — of the wrong kind — had been broken including the steepest drop for a week’s trading.
 Volatility ruled as investors remained unconvinced that government and central bank efforts — even the coordinated interest rate reduction — would get a grip on the credit crisis. Equities gyrated between losses and gains. Bond volatility was also higher amid continued stress in money markets. Recession fears pulled down commodity prices, which in turn, pulled down the companies most associated with them including major energy and mineral producing companies. Volatility ruled as investors remained unconvinced that government and central bank efforts — even the coordinated interest rate reduction — would get a grip on the credit crisis. Equities gyrated between losses and gains. Bond volatility was also higher amid continued stress in money markets. Recession fears pulled down commodity prices, which in turn, pulled down the companies most associated with them including major energy and mineral producing companies.
Emerging markets stocks, the darlings of risk-takers not that long ago, got pummeled in the rising climate of risk-aversion. Russia bore the brunt of the selling pressure and was forced to stop trading after its key stock index plummeted 14 percent and fell to its lowest level in more than three years. Emerging market currencies were also hit hard with the Mexican peso tumbling 20 percent against the dollar at one stage. The Brazilian real also extended its losses. It has fallen nearly 25 percent against the dollar since the start of the month. The crisis surrounding Iceland added pressure as the government seized control of a second big bank and the central bank abandoned its defense of the country’s currency, the krona.
On Tuesday, Fed chairman Ben Bernanke contributed to the gloom when he opened the door to a fed funds target rate cut. His speech sent a strong message that the Fed is pulling out all stops in its policy response. Little did the markets suspect that the rate cut would follow as soon as the next morning and in coordination with other central banks.
On the week, equity losses ranged from a low of 8.1 percent (Malaysia’s KLSE Composite) to 24.3 percent (Japan’s Nikkei). Since the beginning of 2008, losses for the indexes tracked here range from a low of 32.6 percent (Mexican Bolsa) to 62 percent (Shanghai Composite).
|
|
2007 |
2008 |
% Change |
|
Index |
Dec 31 |
Oct 3 |
Oct 10 |
Week |
Year |
| Asia |
|
|
|
|
|
|
| Australia |
All Ordinaries |
6421.0 |
4702.8 |
3939.5 |
-16.2% |
-38.6% |
| Japan |
Nikkei 225 |
15307.8 |
10938.1 |
8276.4 |
-24.3% |
-45.9% |
|
Topix |
1475.7 |
1048.0 |
840.9 |
-19.8% |
-43.0% |
| Hong Kong |
Hang Seng |
27812.7 |
17682.4 |
14796.9 |
-16.3% |
-46.8% |
| S. Korea |
Kospi |
1897.1 |
1419.7 |
1241.5 |
-12.6% |
-34.6% |
| Singapore |
STI |
3482.3 |
2297.1 |
1948.3 |
-15.2% |
-44.1% |
| China |
Shanghai Composite |
5261.6 |
2293.8 |
2000.6 |
-12.8% |
-62.0% |
|
|
|
|
|
|
|
| India |
Sensex 30 |
20287.0 |
12526.3 |
10527.9 |
-16.0% |
-48.1% |
| Indonesia |
Jakarta Composite |
2745.8 |
1832.5 |
1451.7 |
-20.8% |
-47.1% |
| Malaysia |
KLSE Composite |
1445.0 |
1016.7 |
934.0 |
-8.1% |
-35.4% |
| Philippines |
PSEi |
3621.6 |
2566.2 |
2097.8 |
-18.3% |
-42.1% |
| Taiwan |
Taiex |
8506.3 |
5742.2 |
5130.7 |
-10.6% |
-39.7% |
| Thailand |
SET |
858.1 |
590.1 |
452.0 |
-23.4% |
-47.3% |
|
|
|
|
|
|
|
| Europe |
|
|
|
|
|
|
| UK |
FTSE 100 |
6456.9 |
4980.3 |
3932.1 |
-21.0% |
-39.1% |
| France |
CAC |
5614.1 |
4080.8 |
3176.5 |
-22.2% |
-43.4% |
| Germany |
XETRA DAX |
8067.3 |
5797.0 |
4544.3 |
-21.6% |
-43.7% |
|
|
|
|
|
|
|
| North America |
|
|
|
|
|
|
| United States |
Dow |
13264.8 |
10325.4 |
8451.2 |
-18.2% |
-36.3% |
|
NASDAQ |
2652.3 |
1947.4 |
1649.5 |
-15.3% |
-37.8% |
|
S&P 500 |
1468.4 |
1099.2 |
899.2 |
-18.2% |
-38.8% |
| Canada |
S&P/TSX Comp. |
13833.1 |
10803.4 |
9065.2 |
-16.1% |
-34.5% |
| Mexico |
Bolsa |
29536.8 |
22989.5 |
19905.3 |
-13.4% |
-32.6% |
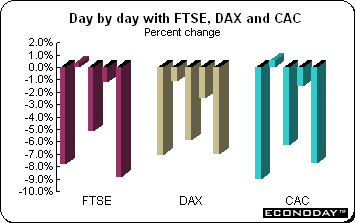 The FTSE, CAC and DAX sank along with other world equity indexes, plumbing lows not seen for about five years. Trading was extremely volatile as money markets remained frozen and investors fled risk in panic. This was despite the long awaited coordinated central bank rate cuts. Both the Bank and England and the European Central Bank along with several other key European banks cut interest rates. The FTSE, CAC and DAX sank along with other world equity indexes, plumbing lows not seen for about five years. Trading was extremely volatile as money markets remained frozen and investors fled risk in panic. This was despite the long awaited coordinated central bank rate cuts. Both the Bank and England and the European Central Bank along with several other key European banks cut interest rates.
Measures to stem the negative flows that were adopted by national governments did little to help as European Union members could not agree among themselves on a plan of coordinated action. The turmoil has grown and intensified in the last four weeks after the U.S. government allowed the investment bank Lehman Brothers to fail. The three indexes, now down for four weeks, each lost more than 21 percent last week alone. An analyst pointed out that this was the reverse of when momentum buying created irrational enthusiasm in anything housing, credit or commodity based. Now redemption and fear-based selling is causing the opposite effect of excessive despair. The growing flight from risk pushed commodities sharply lower.
Britain’s proposed injection of £50 billion of taxpayer’s money into the banking sector — in effect a part nationalization of British banks — failed to lift spirits. However, investors were concerned that efforts by the central banks and governments to support the banking system were too late to prevent a global recession.
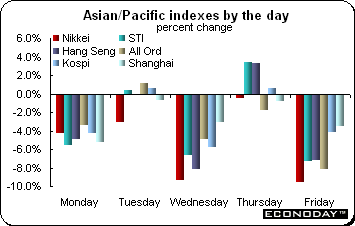 Equity losses across the Asia/Pacific area ranged from 8.1 percent for the KLSE composite to 24.3 percent for the Nikkei. Enthusiasm about the spate of interest rate cuts by central banks across the area quickly dissipated and worries about the prospects of a global recession and the credit woes took precedence once again. South Korea, Hong Kong and Taiwan lowered interest rates and joined the parade of central banks elsewhere (including the U.S., Canada, Europe, China and Australia) with the aim of stabilizing global markets and fending off recession. The Indonesian stock market remained closed at week’s end to fend off panic selling. Equity losses across the Asia/Pacific area ranged from 8.1 percent for the KLSE composite to 24.3 percent for the Nikkei. Enthusiasm about the spate of interest rate cuts by central banks across the area quickly dissipated and worries about the prospects of a global recession and the credit woes took precedence once again. South Korea, Hong Kong and Taiwan lowered interest rates and joined the parade of central banks elsewhere (including the U.S., Canada, Europe, China and Australia) with the aim of stabilizing global markets and fending off recession. The Indonesian stock market remained closed at week’s end to fend off panic selling.
The Nikkei, now down for seven straight sessions, lost 24.3 percent last week, settling below the 8,300 level for the first time since May 2003. The index is down 45.9 percent so far in 2008. Tokyo shares were down across the board as the likelihood of recession depressed investors. They grew even more pessimistic about the economic outlook amid widespread disappointment over Washington's response to the financial crisis. On Wednesday the index lost 9.4 percent and on Friday, it tumbled 9.6 percent — the largest drops in over 21 years. Further, a stronger yen weighed on exporters.
The Bank of Japan said in its October monthly economic assessment report that Japan's economic growth will likely remain sluggish for the time being as growth slowed to a crawl overseas. However, the BoJ reiterated that it expected the economy to return gradually onto a moderate growth path in the longer run as the effects of earlier increases in energy and materials prices abate and overseas economies move out of their deceleration phase.
The Indian Sensex index plummeted as investors abandoned emerging market stocks and the rupee dropped. Stocks sank almost 2,000 points or 16 percent on the week. The index is down 48.1 percent in 2008. Some Indian traders opined that that many foreign institutional investors, faced with increased problems at home and an unwillingness to take on extra risks, would sell their holdings and leave the market.
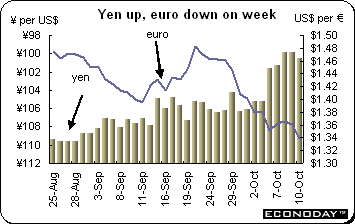 The yen was up last week as investors poured out of carry trade transactions and purchased yen. The darlings of the carry trade had been the Australian and New Zealand dollars along with emerging market currencies. Against the U.S. dollar, the yen hovered around the key 100 yen to the dollar mark. Because interest rates are already very low in Japan, the currency’s appeal should improve as others are forced to lower their rates. After its giant financial bubble burst in 1989, Japan suffered a multi-year hang-over as banks wrote off bad loans and companies rebuilt their balance sheets. As a result, Japan’s private sector has entered the global economic downturn in better shape than many western nations. And investors are treating the country’s currency as a quality asset amid the current turmoil. The yen was up last week as investors poured out of carry trade transactions and purchased yen. The darlings of the carry trade had been the Australian and New Zealand dollars along with emerging market currencies. Against the U.S. dollar, the yen hovered around the key 100 yen to the dollar mark. Because interest rates are already very low in Japan, the currency’s appeal should improve as others are forced to lower their rates. After its giant financial bubble burst in 1989, Japan suffered a multi-year hang-over as banks wrote off bad loans and companies rebuilt their balance sheets. As a result, Japan’s private sector has entered the global economic downturn in better shape than many western nations. And investors are treating the country’s currency as a quality asset amid the current turmoil.
The yen, up 4.6 percent, was about the only currency that gained on the U.S. dollar — only the yuan gained 0.2 percent while the Hong Kong dollar, which is pegged to its U.S. counterpart, edged up 0.1 percent. The Australian and New Zealand dollars were the big losers, down 16.4 percent and 9.4 percent respectively. The South Korean won, which had already been declining steadily, was down 5 percent while the Indian rupee was down 2.9 percent. In Europe, the euro was down 3 percent and the pound sterling, 4 percent.
Selected currencies — weekly results
|
|
2007 |
2008 |
% change |
|
|
Dec 31 |
Oct 3 |
Oct 10 |
Week |
Year |
| U.S. $ per currency |
|
|
|
|
|
|
| Australia |
A$ |
0.878 |
0.774 |
0.646 |
-16.4% |
-26.3% |
| New Zealand |
NZ$ |
0.774 |
0.661 |
0.599 |
-9.4% |
-22.6% |
| Canada |
C$ |
1.012 |
0.925 |
0.849 |
-8.2% |
-16.1% |
| Eurozone |
euro (€) |
1.460 |
1.380 |
1.339 |
-3.0% |
-8.3% |
| UK |
pound sterling (£) |
1.984 |
1.775 |
1.704 |
-4.0% |
-14.1% |
|
|
|
|
|
|
|
| Currency per U.S. $ |
|
|
|
|
|
|
| China |
yuan |
7.295 |
6.849 |
6.835 |
0.2% |
6.7% |
| Hong Kong |
HK$* |
7.798 |
7.771 |
7.764 |
0.1% |
0.4% |
| India |
rupee |
39.410 |
47.070 |
48.455 |
-2.9% |
-18.7% |
| Japan |
yen |
111.710 |
105.170 |
100.505 |
4.6% |
11.1% |
| Malaysia |
ringgit |
3.306 |
3.468 |
3.508 |
-1.2% |
-5.8% |
| Singapore |
Singapore $ |
1.436 |
1.448 |
1.481 |
-2.2% |
-3.1% |
| South Korea |
won |
935.800 |
1227.000 |
1292.250 |
-5.0% |
-27.6% |
| Taiwan |
Taiwan $ |
32.430 |
32.140 |
32.610 |
-1.4% |
-0.6% |
| Thailand |
baht |
29.500 |
34.160 |
34.348 |
-0.5% |
-14.1% |
| Switzerland |
Swiss franc |
1.133 |
1.127 |
1.137 |
-0.8% |
-0.3% |
|
|
|
|
|
|
|
| *Pegged to U.S. dollar |
|
|
|
|
|
|
| Source: Bloomberg |
|
|
|
|
|
|
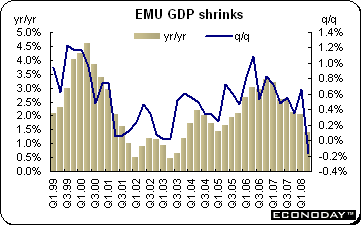 Second quarter gross domestic product was unrevised with a decline of 0.2 percent on the quarter and an increase of 1.4 percent on the year. Expenditure components adjustments were minor. Private consumption was down an unrevised 0.2 percent on the quarter while government spending was up an unmodified 0.5 percent. Fixed investment is now put down a quarterly 1.0 percent from 1.2 percent previously while the drop in exports has been halved to 0.2 percent and the slide in imports increased a tick from 0.4 percent to 0.5 percent. Inventory accumulation had a zero impact upon the bottom line. Second quarter gross domestic product was unrevised with a decline of 0.2 percent on the quarter and an increase of 1.4 percent on the year. Expenditure components adjustments were minor. Private consumption was down an unrevised 0.2 percent on the quarter while government spending was up an unmodified 0.5 percent. Fixed investment is now put down a quarterly 1.0 percent from 1.2 percent previously while the drop in exports has been halved to 0.2 percent and the slide in imports increased a tick from 0.4 percent to 0.5 percent. Inventory accumulation had a zero impact upon the bottom line.
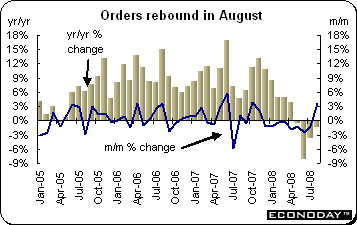 August manufacturing orders jumped 3.6 percent but were down 1.3 percent when compared with last year. The monthly bounce was quite evenly split between the domestic (3.7 percent) and foreign (3.5 percent) components and the former was strong enough to nudge annual growth back into positive territory (0.4 percent). Overseas orders however, were down 3.0 percent on the year. Within the domestic contribution, there were increases in all of the main groupings. The most significant advance was posted by capital goods (7.4 percent) but there was also a solid increase in consumer and durable goods (3.4 percent). Basics however, were unchanged. Among the foreign sector, capital goods (4.3 percent) and basics (3.1 percent) led the way while consumer and durables declined (0.5 percent). August manufacturing orders jumped 3.6 percent but were down 1.3 percent when compared with last year. The monthly bounce was quite evenly split between the domestic (3.7 percent) and foreign (3.5 percent) components and the former was strong enough to nudge annual growth back into positive territory (0.4 percent). Overseas orders however, were down 3.0 percent on the year. Within the domestic contribution, there were increases in all of the main groupings. The most significant advance was posted by capital goods (7.4 percent) but there was also a solid increase in consumer and durable goods (3.4 percent). Basics however, were unchanged. Among the foreign sector, capital goods (4.3 percent) and basics (3.1 percent) led the way while consumer and durables declined (0.5 percent).
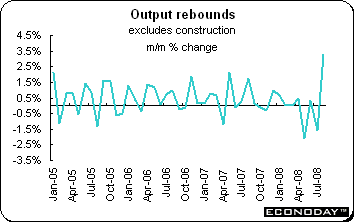 August industrial production surged 3.4 percent on the month and grew 1.7 percent on the year. The industrial production data can be volatile on a monthly basis and this report is particularly so. With industrial orders in the same month posting an equally surprising surge of 3.6 percent, it may be that demand saw a seasonal swing not accounted for in seasonal adjustments. Fewer holidays taken certainly appears to have had an impact. The August figures show monthly increases in output across the board. The strongest gain was in consumer durable goods (8.7 percent) followed by construction (5.5 percent) and capital goods (3.9 percent). Energy output was up 3.6 percent, intermediates 2.6 percent and non-durable consumer goods 1.9 percent. August industrial production surged 3.4 percent on the month and grew 1.7 percent on the year. The industrial production data can be volatile on a monthly basis and this report is particularly so. With industrial orders in the same month posting an equally surprising surge of 3.6 percent, it may be that demand saw a seasonal swing not accounted for in seasonal adjustments. Fewer holidays taken certainly appears to have had an impact. The August figures show monthly increases in output across the board. The strongest gain was in consumer durable goods (8.7 percent) followed by construction (5.5 percent) and capital goods (3.9 percent). Energy output was up 3.6 percent, intermediates 2.6 percent and non-durable consumer goods 1.9 percent.
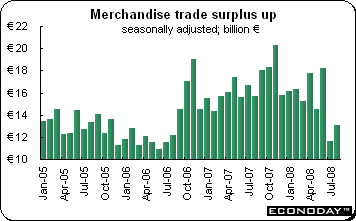 August seasonally adjusted merchandise trade surplus widened to €13.1 billion from a slightly smaller revised €11.6 billion in July. The data reflected a 0.5 percent monthly drop in exports that was easily outpaced by a 2.5 percent decline in imports. Exports have now declined in three of the last four months and in five of the last seven. Imports have weakened in three of the last five months. Annual growth in exports now stands at just 1.8 percent, down from 8.7 percent at the start of the year while on the same basis, import growth has shrunk to 6.1 percent from 9.9 percent. August seasonally adjusted merchandise trade surplus widened to €13.1 billion from a slightly smaller revised €11.6 billion in July. The data reflected a 0.5 percent monthly drop in exports that was easily outpaced by a 2.5 percent decline in imports. Exports have now declined in three of the last four months and in five of the last seven. Imports have weakened in three of the last five months. Annual growth in exports now stands at just 1.8 percent, down from 8.7 percent at the start of the year while on the same basis, import growth has shrunk to 6.1 percent from 9.9 percent.
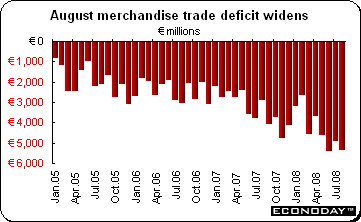 August merchandise trade deficit widened to €5.4 billion from €4.9 billion in July. The deterioration reflected a 2.3 percent monthly increase in nominal exports that was insufficient to offset a 1.8 percent gain in imports. Over the first eight months of the year exports have risen 5.6 percent from the same period of 2007 while imports have expanded 9.2 percent. As a result, the cumulative trade gap has widened by more than 50 percent to €34.4 billion. In unadjusted terms, August saw the usual hefty shortfall on energy (€5.8 billion) which grew 6.8 percent on the month but the total deficit on trade in non-military goods narrowed by 24.1 percent to €1.2 billion over the same period. By trading partner, the largest bilateral shortfall was inevitably with Germany (€1.5 billion) while the biggest surplus was with the UK (€0.7 billion). August merchandise trade deficit widened to €5.4 billion from €4.9 billion in July. The deterioration reflected a 2.3 percent monthly increase in nominal exports that was insufficient to offset a 1.8 percent gain in imports. Over the first eight months of the year exports have risen 5.6 percent from the same period of 2007 while imports have expanded 9.2 percent. As a result, the cumulative trade gap has widened by more than 50 percent to €34.4 billion. In unadjusted terms, August saw the usual hefty shortfall on energy (€5.8 billion) which grew 6.8 percent on the month but the total deficit on trade in non-military goods narrowed by 24.1 percent to €1.2 billion over the same period. By trading partner, the largest bilateral shortfall was inevitably with Germany (€1.5 billion) while the biggest surplus was with the UK (€0.7 billion).
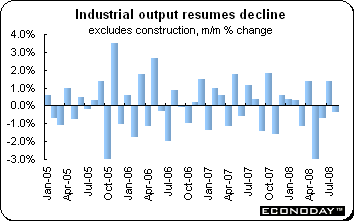 August industrial production excluding construction was down 0.4 percent and down 2.6 percent when compared with last year. In July, output was up 1.4 percent on the month in an otherwise negative trend. The monthly decline was led by food & agriculture (down 2.6 percent) but there were also drops in semi-finished goods (down 0.9 percent) where mineral products were off 3.3 percent, autos (down 0.4 percent) and consumer goods (down 0.1 percent) where household durables slumped 1.8 percent. With no change in production in the capital goods sector it was left to the energy industry (up 1.3 percent) to post the only gain. Output in the overall manufacturing sector fell by 0.5 percent and in construction by 0.7 percent. August industrial production excluding construction was down 0.4 percent and down 2.6 percent when compared with last year. In July, output was up 1.4 percent on the month in an otherwise negative trend. The monthly decline was led by food & agriculture (down 2.6 percent) but there were also drops in semi-finished goods (down 0.9 percent) where mineral products were off 3.3 percent, autos (down 0.4 percent) and consumer goods (down 0.1 percent) where household durables slumped 1.8 percent. With no change in production in the capital goods sector it was left to the energy industry (up 1.3 percent) to post the only gain. Output in the overall manufacturing sector fell by 0.5 percent and in construction by 0.7 percent.
aly
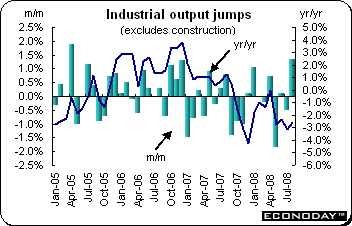 August industrial output excluding construction jumped 1.4 percent but was down 2.6 percent when compared with last year. The main area of strength in August was energy where output was up 2.4 percent on the month. There were also solid gains in intermediates (1.9 percent) and total consumer goods (1.1 percent) even though consumer durables were down. However, there was a decline capital goods production (0.4 percent) for the fourth consecutive month and the fifth month out of the last six. Overall manufacturing output was up 1.3 percent from July but down 6.4 percent from a year ago. For the first eight months of 2008, manufacturing production fell 2.1 percent from the same period in 2007. August industrial output excluding construction jumped 1.4 percent but was down 2.6 percent when compared with last year. The main area of strength in August was energy where output was up 2.4 percent on the month. There were also solid gains in intermediates (1.9 percent) and total consumer goods (1.1 percent) even though consumer durables were down. However, there was a decline capital goods production (0.4 percent) for the fourth consecutive month and the fifth month out of the last six. Overall manufacturing output was up 1.3 percent from July but down 6.4 percent from a year ago. For the first eight months of 2008, manufacturing production fell 2.1 percent from the same period in 2007.
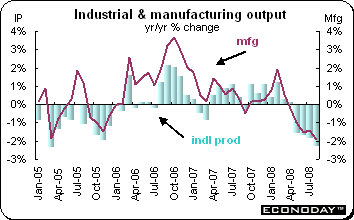 August industrial production declined by 0.6 percent — its fourth monthly drop in a row. On the year, industrial production was down 2.3 percent. The decline was widespread among the broad industry groups with monthly drops in manufacturing (0.4 percent), mining & quarrying (0.7 percent), oil & gas extraction (1.2 percent) and electricity, gas & water (1.6 percent). The main industrial groupings were similarly depressed. Hence output fell in durable goods (0.4 percent), nondurables (0.3 percent), capital goods (0.8 percent) and intermediates (0.5 percent). Within total manufacturing, monthly production declines were especially marked in engineering (0.8 percent), coke & petroleum products (0.5 percent) and chemicals and fibres (0.5 percent). There were also declines in metals (0.4 percent) and other manufacturing (0.7 percent). The only sectors to post gains were food & drink (0.8 percent) and textiles & clothing (0.5 percent). Manufacturing output was down 1.9 percent on the year. August industrial production declined by 0.6 percent — its fourth monthly drop in a row. On the year, industrial production was down 2.3 percent. The decline was widespread among the broad industry groups with monthly drops in manufacturing (0.4 percent), mining & quarrying (0.7 percent), oil & gas extraction (1.2 percent) and electricity, gas & water (1.6 percent). The main industrial groupings were similarly depressed. Hence output fell in durable goods (0.4 percent), nondurables (0.3 percent), capital goods (0.8 percent) and intermediates (0.5 percent). Within total manufacturing, monthly production declines were especially marked in engineering (0.8 percent), coke & petroleum products (0.5 percent) and chemicals and fibres (0.5 percent). There were also declines in metals (0.4 percent) and other manufacturing (0.7 percent). The only sectors to post gains were food & drink (0.8 percent) and textiles & clothing (0.5 percent). Manufacturing output was down 1.9 percent on the year.
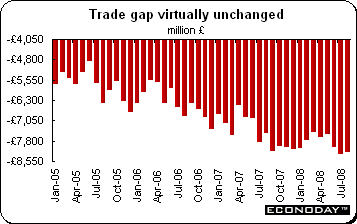 August merchandise trade gap was virtually unchanged at a near record Stg8.2 billion. Exports slumped 4.5 percent on the month while imports sank 3.4 percent. However, the steady bottom line masked a sharp deterioration in the underlying deficit which saw the red ink ex-oil and erratics jump from Stg6.7 billion to Stg7.8 billion. The deficit on oil shrank from Stg1.6 billion to just Stg0.2 billion, in part reflecting lower oil prices but also the end of rig maintenance work. There was a mixed performance regionally. The shortfall with the non-EU bloc ballooned to Stg5.2 billion from Stg4.8 billion as exports nosedived more than 11 percent. However, the red ink with EU countries actually narrowed from Stg3.5 billion to Stg3. billion. August merchandise trade gap was virtually unchanged at a near record Stg8.2 billion. Exports slumped 4.5 percent on the month while imports sank 3.4 percent. However, the steady bottom line masked a sharp deterioration in the underlying deficit which saw the red ink ex-oil and erratics jump from Stg6.7 billion to Stg7.8 billion. The deficit on oil shrank from Stg1.6 billion to just Stg0.2 billion, in part reflecting lower oil prices but also the end of rig maintenance work. There was a mixed performance regionally. The shortfall with the non-EU bloc ballooned to Stg5.2 billion from Stg4.8 billion as exports nosedived more than 11 percent. However, the red ink with EU countries actually narrowed from Stg3.5 billion to Stg3. billion.
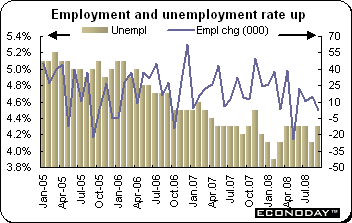 September employment edged up by 2,200 while the unemployment rate climbed to 4.3 percent from 4.1 percent in August. Full time employment was down by 15,400 while part time employment was up by 17,700. Unemployment increased by 21,700. The number of persons looking for full time work increased by 4,400 to 326,800 while the number of persons looking for part time work increased by 17,300 to 152,800. The participation rate remained steady at 65.1 percent. September employment edged up by 2,200 while the unemployment rate climbed to 4.3 percent from 4.1 percent in August. Full time employment was down by 15,400 while part time employment was up by 17,700. Unemployment increased by 21,700. The number of persons looking for full time work increased by 4,400 to 326,800 while the number of persons looking for part time work increased by 17,300 to 152,800. The participation rate remained steady at 65.1 percent.
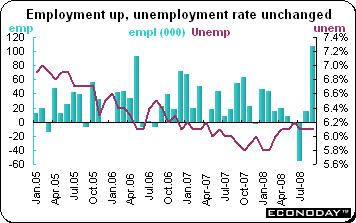 September employment surged 106,900 while the unemployment rate stayed at 6.1 percent for the third month due to a sharp increase in the size of the labor force. Full time jobs were up a modest 10,300 while part time jobs soared by 96,600. Goods producing sector gained 46,300 jobs while services was up 60,600 jobs. Manufacturing payrolls were up 19,700 and construction gained 14,400. Agriculture rose 14,700 and natural resources increased by 6,700. The only decline was in utilities (9,300). Within services, health care & social assistance was up 40,000, business, building & other support services were up 19,800, transport & warehousing gained 16,300 and other services were up 16,900. Employment declined in public administration (6,300), information, culture & recreation (10,200) and trade (3,700). The participation rate rose 0.3 percentage points to 67.8 percent while the employment rate climbed by an equal amount 63.7 percent. September employment surged 106,900 while the unemployment rate stayed at 6.1 percent for the third month due to a sharp increase in the size of the labor force. Full time jobs were up a modest 10,300 while part time jobs soared by 96,600. Goods producing sector gained 46,300 jobs while services was up 60,600 jobs. Manufacturing payrolls were up 19,700 and construction gained 14,400. Agriculture rose 14,700 and natural resources increased by 6,700. The only decline was in utilities (9,300). Within services, health care & social assistance was up 40,000, business, building & other support services were up 19,800, transport & warehousing gained 16,300 and other services were up 16,900. Employment declined in public administration (6,300), information, culture & recreation (10,200) and trade (3,700). The participation rate rose 0.3 percentage points to 67.8 percent while the employment rate climbed by an equal amount 63.7 percent.
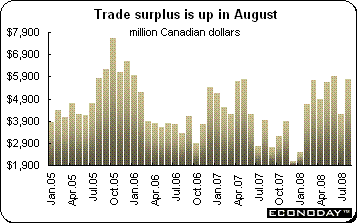 August merchandise trade surplus surged from a downward revised C$4.2 billion in July to C$5.8 billion in August. The jump reflected a 5.8 percent slump in nominal imports that easily outpaced a smaller 1.6 percent dip in exports. The real trade balance also improved markedly as import volumes nosedived 6.9 percent compared with a 1.5 percent slide in real exports. The bilateral surplus with the U.S. expanded from C$8.4 billion to C$8.6 billion while the deficit with the EU narrowed from C$1.1 billion to C$0.9 billion. A small C$0.1 billion deficit with Japan was turned into a C$0.2 billion surplus. Within the drop in total nominal exports, easily the largest was in energy (9.7 percent) which dominated declines in forestry products (2.5 percent) and automotive products (2.6 percent). On the upside, there were increases in exports of industrial goods & materials (2.8 percent), machinery & equipment (1.7 percent) and other consumer goods (4.9 percent). The slump in imports was also driven by energy (down 24.9 percent) although autos (down 14.2 percent) were very weak too. The largest advance was posted by other consumer goods (up 2.5 percent) and agriculture & fishery products (up 2.4 percent). August merchandise trade surplus surged from a downward revised C$4.2 billion in July to C$5.8 billion in August. The jump reflected a 5.8 percent slump in nominal imports that easily outpaced a smaller 1.6 percent dip in exports. The real trade balance also improved markedly as import volumes nosedived 6.9 percent compared with a 1.5 percent slide in real exports. The bilateral surplus with the U.S. expanded from C$8.4 billion to C$8.6 billion while the deficit with the EU narrowed from C$1.1 billion to C$0.9 billion. A small C$0.1 billion deficit with Japan was turned into a C$0.2 billion surplus. Within the drop in total nominal exports, easily the largest was in energy (9.7 percent) which dominated declines in forestry products (2.5 percent) and automotive products (2.6 percent). On the upside, there were increases in exports of industrial goods & materials (2.8 percent), machinery & equipment (1.7 percent) and other consumer goods (4.9 percent). The slump in imports was also driven by energy (down 24.9 percent) although autos (down 14.2 percent) were very weak too. The largest advance was posted by other consumer goods (up 2.5 percent) and agriculture & fishery products (up 2.4 percent).
Financial markets were in ferment while central banks and government officials worked feverishly to unclog the frozen financial pipes. A wide swath of central banks cut interest rates to stave off sinking growth. Investors however, seemed impervious to these efforts and abandoned investment positions sending many stock indexes down by record amounts. The Group of Seven met on Friday, but other than signs of agreement, no specific plan was put forth. One size does not fit all countries given different governmental, legal and market structures.
The International Monetary Fund/World Bank meetings including a Group of 20 meeting are continuing over this weekend and will be watched closely. U.S. Treasury Secretary Henry Paulson emphasized the importance of the G-20 meeting in his press conference Friday night. Investor reaction to the G-7 statement will be apparent soon enough when markets open for trading on Monday, despite holidays in Japan and Canada where markets will be closed.
| The following indicators will be released this week... |
| Europe |
|
|
| October 13 |
UK |
Producer Input and Output Prices (September) |
| October 14 |
EMU |
Industrial Production (August) |
|
Germany |
ZEW Business Survey (October) |
|
UK |
Consumer Price Index (September) |
| October 15 |
EMU |
Harmonized Index of Consumer Prices (September) |
|
UK |
Labour Market Report (September) |
| October 16 |
Italy |
Merchandise Trade (August) |
| October 17 |
EMU |
Merchandise Trade (August) |
|
|
|
| Asia/Pacific |
|
|
| October 14 |
Japan |
Corporate Goods Price Index (September) |
| October 17 |
Japan |
Tertiary Sector Activity Index (August) |
|
|
|
| Americas |
|
|
| October 16 |
Canada |
Manufacturing Shipments (August) |
Anne D Picker is the author of International Economic Indicators and Central Banks.
|

