Last week's economic data came in stronger than expected for retail sales and international trade. Economists are revising up their forecasts for the fourth quarter and the Fed likely is not happy that economic growth has not remained below trend to help ease inflation.
Recap of US Markets
OIL PRICES
Once again, oil prices ended the week down sharply. And again, unseasonably warm weather is the culprit. Refined stocks are up much more than expected while crude stocks are a little lower than projected for the latest round of inventory data. West Texas Intermediate spot closed as low as $51.88 per barrel on Thursday but was nudged a little higher Friday on talk that OPEC is scheduling an emergency meeting to cut production. Spot prices for West Texas Intermediate ended last week at $52.99 per barrel, down $3.32 per barrel for the week. Over the last four weeks, crude prices have fallen $10.44 per barrel. Crude oil prices are at their lowest since May of last year.

STOCKS
Equities finally got in gear in the New Year last week. All major indexes were up notably - and especially the Nasdaq. The Dow ended the week on another record close while the Nasdaq was near a six-year high. The week's drop in oil prices helped most stocks - except in the oil patch, of course. Transportations and chemicals did well as the lower oil prices mean lower costs. For the markets overall, gains were slow Monday and Tuesday with lower oil prices being the main factor along with the realization that prices ended the prior week too soft. Fed Vice Chairman Donald Kohn's comments that the economy was weathering the housing downturn well also helped support stocks on Monday. The Dow and the S&P 500 were kept just below flat on Tuesday due to declines in oil patch stock. Offsetting this was a jump in technology stocks on Tuesday as Apple unveiled its iPhone and enjoyed a nice spike in its stock value. Wednesday's report on a narrowing in the U.S. trade deficit boosted both the view of a healthy economy and stocks overall. Advances on Wednesday were led by the Nasdaq. Also, airline stocks continued healthy gains on lower oil prices. Alcoa led off earnings season for the Dow with earnings that beat expectations and helped to offset weakness in energy stocks. A drop in jobless claims and further oil price declines boosted stocks Thursday. On Friday, the markets decided that good news on retail sales really was good news - despite the belief that the Fed's rate cuts would be postponed.
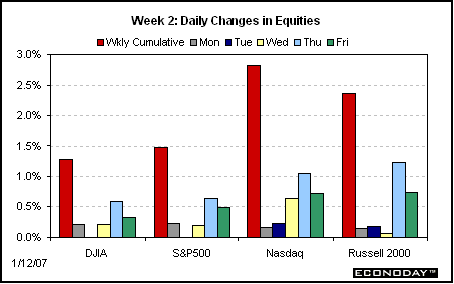
For the week, all major indexes were up smartly. Weekly gains were: the Dow, up 1.3 percent; the S&P 500, up 1.5 percent; and the Russell 2000, up 2.8 percent; and the Nasdaq was up a whopping 2.4 percent.
BONDS
Bond rates were up sharply last week despite softness in oil prices which generally are favorable for lower inflation and lower interest rates. There was not much movement early last week. But on Wednesday, the unexpected improvement in the trade deficit indicated that there was some unexpected strength in the economy. A jump in mortgage applications also helped boost rates on Wednesday. On Thursday, the Bank of England lifted its target by 25 basis points to 5.25 percent, forcing U.S. rates up somewhat to remain competitive and to provide some support for the dollar, which slipped moderately due to the change in the gap between British and U.S. rates. Friday's surge in retail sales led to the final boost in rates during last week.
Net for the week the Treasury yield curve is significantly higher except for the near end which is up slightly. Except for the near end, yields were up net 11 to 13 basis points. Yields were up as follows: 3-month Treasury bill, up 4 basis points; 2-year Treasury note, up 12 basis points; 3-year, up 13 basis points; 5-year, up 11 basis points; the 10-year bond, up 12 basis points, and the 30-year bond, up 12 basis points.
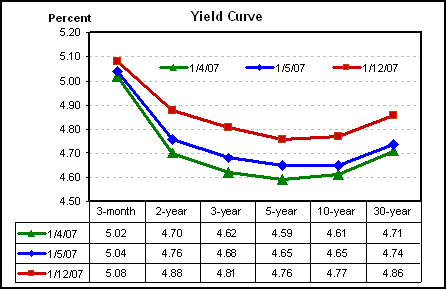
Longer rates have been on an uptrend since early December with the 10-year bond up 35 basis points from December 4's close at 4.42 percent. Even the 3-month T-bill has been on an upward trend since mid-December, rising 18 basis points since December's close at 4.90 percent.
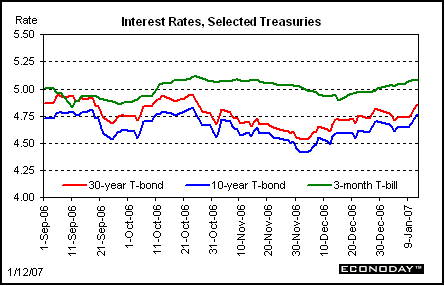
Longer rates are at their highest since mid-October 2006 but are still significantly below levels seen in June and July of last year.
Markets at a Glance
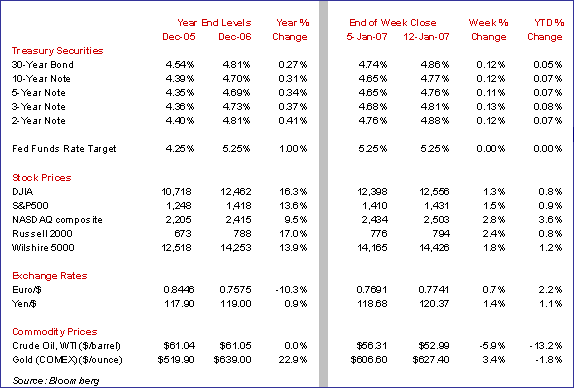
Weekly percent change column reflects percent changes for all components except interest rates. Interest rate changes are reflected in simple differences.
The Economy
Last week's economic data indicated that the economy is still quite healthy - especially in the consumer sector. Exports continue to be a positive for the economy.
The consumer jazzes up retail sales to end the year with a bang
The consumer continued to pump up the economy in December as retail sales surged for the second straight month. Retail sales jumped 0.9 percent in December, following a 0.6 percent boost in November. Excluding motor vehicles, retail sales spiked 1.0 percent in December, following a 0.7 percent jump in November. Excluding both gas station and motor vehicles components, retail sales posted a gain of 0.7 percent in December, following a 0.5 percent boost in November.
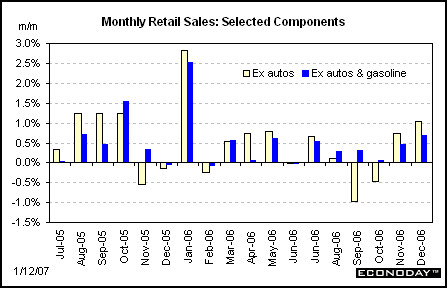
Year-on-year, overall retail sales in December were up 5.4 percent, compared to 4.9 percent in November. Excluding motor vehicles and gas station sales, year-on-year sales in December stood at 6.1 percent - up from 5.6 percent the prior month.
Strength in retail sales in December was widespread. There were at least two surprising sources of strength. Electronics sales were up 3.0 percent in December, despite the price discounting for HDTVs and large screen TVs. The increase in the quantity purchase more than offset the decrease in prices. Additionally, the fact that all of big ticket sales are counted in retail sales - even when purchased on credit - helped pushed up electronics dollar volume. Also, apparel sales were up 0.6 percent despite all of the prognostications that warm weather was hurting sales.
How do the latest retail sales numbers fit into the picture for fourth quarter economic growth overall' As seen in the chart below, if we take the quarterly averages for retail sales, the fourth quarter looks very soft. Why is this so if November and December were so strong - those two-thirds of the quarter' It has to do with quarterly levels being affected not only by current quarter percent changes but also by where the prior quarter ended. A drop at the end of the prior quarter is the starting level for the next quarter. And not only did October decline, but also September - both of which pulled down the fourth quarter average. Annualized quarter percent changes in the fourth quarter were: total, 0.3 percent; ex-autos, down 1.0 percent; and ex-autos & ex-gasoline, up 0.8 percent.

Of course, one of the issues with the markets last Friday was not just the pace for consumer spending but whether Friday's retail sales were in line with expectations - and they were notably higher. So, that is the key reason for upward revisions to GDP estimates. But what about the real pace'
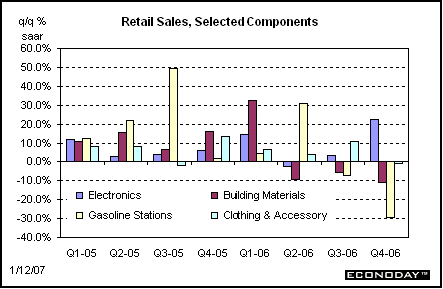
As noted above, the weakness in December was focused in a few components and that was true for the quarter also. Weakness for the quarter was mainly in gasoline sales, building materials, and in clothing. Not much can be said for building materials - that component was weak due to the decline in housing. But clothing could be stronger in real terms if the December CPI for apparel stays weak. Additionally, the drop in nominal gasoline sales will be boosted in real terms by a decline in prices. While electronic sales for the quarter were strong in nominal terms, they will be even stronger in real terms - given the level of heavy discounting this past holiday season.
So, all in all, consumer spending in real terms will likely be moderate in the fourth quarter rather than flat.
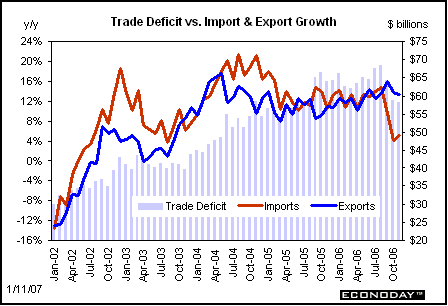
The U.S. trade deficit surprisingly narrows
The U.S. trade gap surprisingly narrowed to $58.2 billion in November from a revised $58.8 billion shortfall in October. The decrease in the trade gap was primarily due a jump in exports of civilian aircraft. In November, overall exports rose 0.9 percent while imports increased 0.3 percent. The latest numbers for the narrower gap are leading to upward revisions in fourth quarter GDP estimates. Healthy exports are a positive for manufacturing while strong imports in consumer goods and in business equipment suggest that domestic demand is still on the high side.
Import prices bump up but likely temporarily
Outside of the retail sales numbers, there was not any major economic news from the economic indicators. But there probably is more information in the import price data than noted by the markets.
Import prices spiked 1.1 percent in December due to a temporary 4.8 percent month-to-month jump in import petroleum prices. Given the current downturn in oil prices, markets shrugged off the latest numbers. But still, excluding petroleum, import prices rose a still strong 0.4 percent. Excluding all fuels, namely natural gas, import prices were up a less fearsome 0.2 percent.

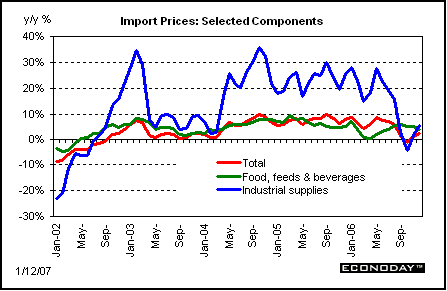
What can some of the components tell us about underlying trends' Much of the volatility in import prices are in commodities and food. As seen below those are up in December and we know industrial supplies (which include oil) are on the way down.
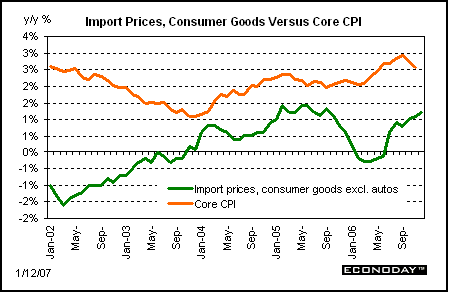
There are more consumer-specific components in import prices. Import prices for consumer goods have been on an uptrend since mid-<%Response.Write(Year(Now))%>. Import prices for consumer goods excluding autos are up 1.2 percent on a year-on-year basis. That may not seem like much but it is much higher than the minus 0.3 percent seen in May 2006. The bottom line is that import prices are not helping much to pull down consumer prices directly other than through oil prices. The Fed will be noticing.
The bottom line
Last week we had two key reports that came in stronger than expected - retail sales and international trade. As a result, private forecasters have revised up their fourth quarter GDP forecasts. Projections are now running at 3 percent and even a little higher. This is a concern for the Fed because in recent months, the Fed had lowered its estimates of trend, non-inflationary growth to 3 percent. The Fed has been counting on actual GDP growth to be below trend for a few quarters in order to pull inflation down and that is not happening. We can expect rates to remain firm for a while.
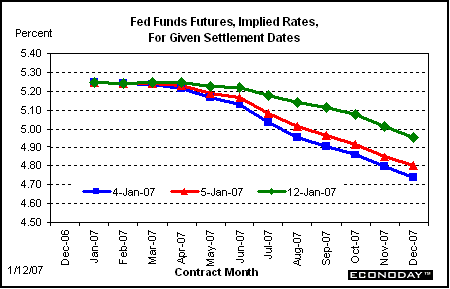
Last week, based on the fed funds futures market, expectations for near-term cuts in short-term rates fell significantly. Currently, odds for a 25 basis point cut in the fed funds target are not greater than 50 percent until the September FOMC meeting. Odds for a cut during the August meeting are just below 50 percent. Of course, if you do not like those odds, check back next week. We have a number of key indicators out, including the PPI, the CPI, and industrial production, among others.
Looking Ahead: Week of January 16 through January 19
Tuesday
The Empire State manufacturing index edged down to 23.1 in December from 26.7 in November. Despite the slippage, the New York Fed index remained at a moderately healthy level. In December, new orders were healthy although backlogs turned negative. Importantly, prices paid and prices received eased somewhat. Given that some have concerns that manufacturing may be weakening too much, markets will be focusing on the Empire State manufacturing index which comes out one day ahead of the Federal Reserve's industrial production report.
Empire State Manufacturing Survey Consensus Forecast for January 07: 20.0
Range: 15.0 to 25.0
Wednesday
The producer price index jumped 2.0 percent in November, following a 1.6 percent decline in October. Recently, the PPI has had a handful of volatile components that have made reading the underlying trend difficult. In the latest month, energy and motor vehicles and motor vehicles were responsible for the spike in the PPI. The motor vehicle component even helped boost the core PPI to a rebound of 1.3 percent, following a 0.9 percent drop in October. Markets will be watching the core PPI but also will be looking to see how the motor vehicles component is affecting the core.
PPI Consensus Forecast for December 06: +0.5 percent
Range: +0.2 to +0.9 percent
PPI ex food & energy Consensus Forecast for December 06: +0.1 percent
Range: -0.1 to +0.3 percent
Industrial production rose 0.2 percent in November, following no change in October. However, most the latest gain was due to a jump of 3.7 percent in motor vehicle output. Excluding motor vehicles, manufacturing output was flat in November, following a 0.3 percent decline in October. While the December ISM's return to positive territory (but barely) helped calm concern over manufacturing somewhat, the debate continues over the direction of manufacturing. One view is that it is joining the ranks of housing as a declining sector. The other view is that manufacturing is merely in a mild readjustment phase to slower economic growth. Broad gains in the industrial production index - however modest - in December would help support this latter view.
Industrial production Consensus Forecast for December 06: +0.1 percent
Range: -0.2 to +0.3 percent
Capacity utilization Consensus Forecast for December 06: 81.7 percent
Range: 81.5 to 81.9 percent
Thursday
The consumer price index was unchanged in November, following a 0.5 percent decline in October. The core CPI also was flat in November, following a 0.1 percent rise in October. However, the headline CPI is likely to see a reversal in the wrong direction from December's firming in oil prices - which, of course, have reversed again in the New Year. So, the markets will be discounting any firming in the CPI from oil price spillover effects and will give more attention to the core rate. We have seen notable softening over the last few months but the tight rental markets suggest that it may be too good to be true - at least for the housing component. Motor vehicles sales picked up in December and it will be interesting to see how much of the pick up in sales was due to discounting.
CPI Consensus Forecast for December 06: +0.5 percent
Range: +0.3 to +0.6 percent
CPI ex food & energy Consensus Forecast for December 06: +0.2 percent
Range: +0.1 to +0.3 percent
Housing starts rebounded 6.7 percent in November, following a 13.7 percent drop in October. November's gain occurred despite still too high inventories to sales for both existing and new homes for sale. Most likely the November firming in starts was somehow a seasonal aberration, given that pending home sales have not yet strengthened to give homebuilders enough confidence to boost speculative building and current demand simply is not yet on the upswing - though it might be in a few months.
Housing starts Consensus Forecast for December 06: 1.59 million-unit rate
Range: 1.50 million to 1.62 million-unit rate
Initial jobless claims plunged 26,000 in the week ending January 6 to a 5-1/2 month low of 299,000. The shortened holiday week likely was the key reason for the drop. A technical rebound is expected. The main question is by how much' Initial claims need not exceed a rebound of much over 30,000 to keep the view that the labor market is still strong.
Jobless Claims Consensus Forecast for 1/13/07: 315,000
Range: 290,000 to 320,000
The general business conditions component of the Philadelphia Fed's business outlook survey index fell to minus 4.3 in December from 5.1 in November. The Philly Fed index generally has been weaker than other regional manufacturing indexes in recent months. Both new orders and backlogs were negative last month and suggest further weakness ahead in the overall business conditions index.
Philadelphia Fed survey Consensus Forecast for January 07: +5.0
Range: -7.5 to +10.0
Friday
The University of Michigan's consumer sentiment index slipped back in December, to a final reading of 91.7 vs. 92.1 in November. Since the last survey, the stock market has been sluggish but oil prices have fallen. These could be offsetting factors for the preliminary January reading of the consumer sentiment index.
Consumer sentiment index Consensus Forecast for preliminary January 07: 92.5
Range: 91.0 to 94.0

