|
Simply Economics will be taking next week off.
Simply Economics will return on January 4, 2008.
Merry Christmas and Happy New Year
from all of us at Econoday!
Just as in mystery guest TV game shows of years gone by, we have various pretenders for where the economy is right now, and it is a little tough picking out which is the real economy and which are good pretenders. Is the economy headed into recession with housing and manufacturing pulling the economy down' Is the economy just in a one quarter pause with the consumer and exports putting the economy back in high gear next year' Is the economy in mild stagflation or something else' This past week’s data had a little something for all of the game show participants.
Equities got a nice boost last week due to a number of technical factors and good economic news. Last week was the last full trading week of the year as many traders settled their positions for year end and headed out for Christmas vacation and New Year’s. Also, Friday was quadruple witching, boosting demand for equities from short covering.
Company and economic events did lead to some sizeable swings during the week. Stocks saw a sharp drop at the start of the week, especially in the tech sector, primarily on continued inflation worries from the prior week’s PPI and CPI reports. Markets also worried about recession and financial stocks as former Fed Chairman Greenspan on Sunday indicated that the odds of recession were 50-50 and Moody’s had earlier warned that four key bond insurers could be downgraded over subprime mortgage losses. Tuesday was quite positive for techs and small caps with upside surprises on earnings from Adobe Systems and from Best Buy providing some impetus. Housing starts fell the same day but less than anticipated. Wednesday was mixed with markets largely already taking into account Morgan Stanley’s $5.7 billion subprime related writedown. Thursday was positive, especially for techs and Small Caps with strong earnings from Oracle leading the techs. Unexpectedly strong losses by Bear Stearns kept the blue chips at more moderate gains. Strong earnings from Research in Motion helped techs jump sharply on the last day of the week. Also, robust personal consumption numbers in the November personal income reported led to sharp gains in equities across the board as recession fears faded.
While the past week probably did not qualify for a Santa Claus rally, it was welcome relief as many traders clocked out for the rest of the year.
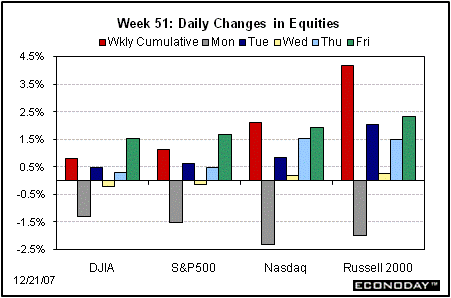
Last week, major indexes were up: the Dow, up 0.8 percent; the S&P 500, up 1.1 percent; the Nasdaq, up 2.1 percent; and the Russell 2000, up 4.2 percent.
Year-to-date, the Dow is up 7.9 percent; the S&P 500, up 4.7 percent; and the Nasdaq, up 11.5 percent. The Russell 2000 is still down 0.3 percent since year end despite last week’s upward surge.
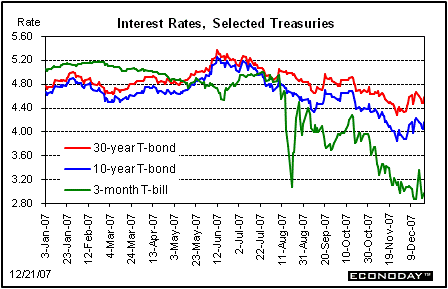
The interest rate story last week was not too complicated. For the first four days of the week, economic data generally were weak. The final revision number of 4.9 percent for third quarter GDP on Thursday did not really count since the prior estimate was already strong and the third quarter data were looking old. The Empire State manufacturing index softened and housing starts continued to decline. Also, keeping rates down and flight to quality lower was the Fed’s special auctions of credit on Monday and Thursday for $20 billion each day. The TAF (Term Auction Facility) is intended to ease current liquidity problems by by-passing the fed funds market, allegedly keeping monetary policy separate from fixing liquidity problems related to the subprime crisis. Also, the European Central Bank injected a massive $500 billion in special loans this past week for the same purpose, also keeping rates down. But on Friday, rates jumped moderately on the personal income report which included a 1.1 percent spike in personal consumption for November. And a jump in equities at week end also pressured rates. Nonetheless, yields on notes and bonds were down moderately for the week.
Treasury yields were down last week except for the near end as follows: the 2-year note; down 12 basis points; the 5-year note, down 5 basis points; the 10-year bond, down 7 basis points; and the 30-year bond, down 8 basis points. The 3-month T-bill firmed 10 basis points over the week.

Rates were down last week except on the short end. Although rates have partially recovered from the worst of the recent liquidity problems as flight to quality has tapered off, rates are still relatively low.
Oil prices were relatively quiet the first four days of last week but spiked at weekend. Early in the week, prices eased slightly as Turkish troops returned to home soil after engaging Kurdish fighters. The withdrawal eased worries that Kurds might disrupt oil flowing through Turkey. Prices for West Texas Intermediate spot did firm on Wednesday’s oil inventories report which showed a sharp drawdown that was not expected. Prices did ease somewhat on Thursday as news spread that the inventory decline was due to winter storms in Oklahoma cutting into production and bad weather outside of Houston cutting into oil deliveries. Analysts expect deliveries and production to be up significantly the next week as those two factors are reversed. The big move during the past week was Friday’s $2.30 per barrel jump on news of a 1.1 percent surge in consumer spending in November, indicating that the economy was not headed into recession and was stronger than believed.
The spot price for West Texas Intermediate rose $1.99 per barrel for the week to close at $93.26 per barrel, $5.62 below the record high of $98.88 set November 20th.


Weekly percent change column reflects percent changes for all components except interest rates. Interest rate changes are reflected in simple differences.
In recent weeks, economic data have pointed in different directions and this past week was no exception. Data have supported both arguments that the economy is weakening as well as those that say the economy is merely in a temporary soft patch and headed back to robust growth. While there are those who see an economy headed into recession and those who fear runaway inflation, the real economy is likely somewhere in between.
The most current market moving indicator last week was the personal income report for November and it clearly supported the view that the economy has potential to reignite on the hot side. The spending and inflation numbers clearly will nudge the Fed closer to a hold steady position on interest rates. Personal income strengthened in November to a 0.4 percent gain in November, following a 0.2 percent rise in October. The wages and salaries component jumped with a 0.6 percent boost, following no change in October, and also followed a robust 0.6 percent gain in September. Consumers tend to spend more out of wages and salaries than out of other components such as interest or dividends.
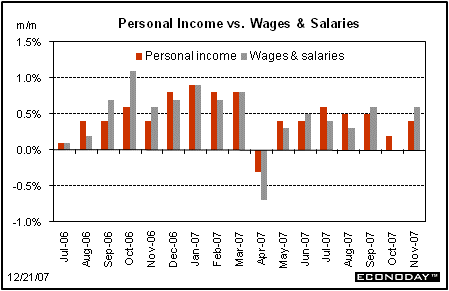
On the spending side, the consumer was on a spending spree. Personal consumption in November surged 1.1 percent, following a moderate 0.4 percent rise in October. While a good portion of the jump in spending was due to higher gasoline prices, the November gain was broad based. By components, durables advanced 0.3 percent in November, while nondurables and services jumped 2.0 percent and 0.8 percent, respectively. But to get to the real, inflation-adjusted spending numbers, overall personal consumption jumped 0.5 percent in November, following a 0.1 percent rise the month before. The latest real PCE numbers show the consumer sector doing its share to keep fourth quarter GDP notably out of negative territory and raise the odds of fourth quarter growth above 1-1/2 percent.

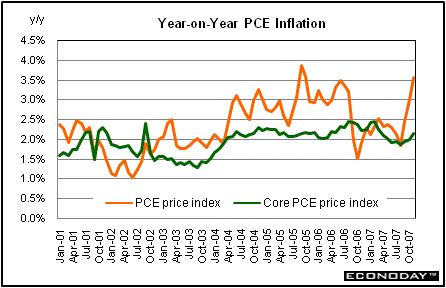
But what likely got the Fed’s attention as much as the spending numbers were the inflation numbers. Inflation heated up in November. Not surprisingly with recent sharp increases in oil prices, the overall PCE price index jumped 0.6 percent in November, up from a 0.3 percent increase in October. However, the core PCE price index rose 0.2 percent in November, the same as for the prior month and equaling expectations. But the year-on-year trend for headline and core inflation is not looking good. Headline inflation jumped to 3.6 percent in November from 3.0 percent in October. Core inflation rose to 2.2 percent year-on-year in November from 2.0 percent the previous month. These trends go against the Fed’s goal of bring headline and core PCE inflation down to a range of 1-1/2 to 2 percent annualized.
The economy was red hot as it headed into the current credit crunch. The Bureau of Economic Analysis made its final revisions to third quarter GDP, keeping its overall estimate at 4.9 percent for the quarter. Third quarter real GDP also followed above potential growth of 3.8 percent in the second quarter. While the economy had two consecutive robust quarters, the liquidity problems that arose during this past summer have created a unique situation for the economy and suggest that credit difficulties will pull growth down – but not into negative territory – in the fourth quarter.
For the inflation numbers, the GDP price index was revised upward slightly to an annualized 1.0 percent from the prior estimate of 0.9 percent. The consensus expected no revision from the prior estimate. However, the core PCE price index was revised up to an annualized 2.0 percent from the prior 1.8 percent figure for the third quarter.

For the inflation numbers, the GDP price index was revised upward slightly to an annualized 1.0 percent from the prior estimate of 0.9 percent. With the recent run up in oil prices and strong gains in monthly inflation data, the third quarter GDP inflation numbers clearly are dated.
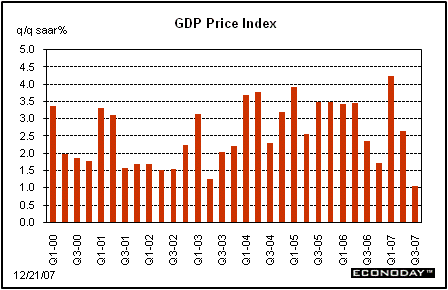
Based on the GDP data, where’s the economy' Certainly, the economy had strong momentum during the middle quarters of 2007 despite the recession in housing. This momentum from the consumer sector, exports, and even construction outside of housing will likely carry forward past difficulties in the fourth quarter but at a more moderate level. Momentum effects will likely work to contain inflation also. Yes, headline inflation is surging but if oil prices steady and the Fed does not over stimulate the economy, then inflation will ease below recent headline monthly numbers. But key questions revolve around the magnitude of the momentum in the real sector and how it affects inflation. The latest numbers are mixed.
Supporting the argument that the economy could tip into recession is the latest housing data. Housing starts in November resumed a decline, slipping 3.7 percent to a 1.187 million unit annual pace and following a revised 4.2 percent partial rebound in October. Starts are at their lowest level since the 1.186 million unit pace set in September 1992 and indicate a continued decline in residential outlays in coming months.

Within starts, weakness was led by the single-family component. Single-family starts fell 5.4 percent in November, following a 6.6 percent decline the month before. Multifamily construction is holding up surprisingly well. The multi-family component advanced 0.6 percent in November, even though this component had surged a monthly 45.9 percent in October.
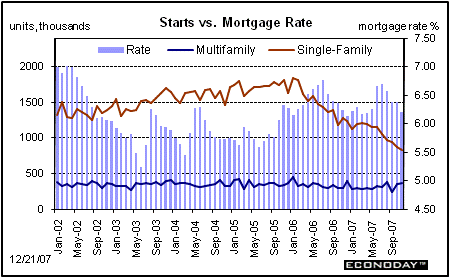
The continuing decline in housing will also be weighing on the consumer sector, cutting into sales for household durables such as washers, dryers, and other household appliances as well as furniture. Again, the starts data indicate that while talk of recession has faded, the possibility of a near-term recession remains.
Through much of 2007, the manufacturing sector helped to keep economic growth healthy overall. But there are signs of weakening in manufacturing with the sector possibly turning negative briefly. This past week, the Empire State index fell back a very steep 17 points in December for a 10.3 reading that points to only a moderate rate of growth in the area's manufacturing sector. New orders, the most important of the report's components, likewise fell back, to 14.3 from 24.5. Unfilled orders, at -10.0, contracted for a second month.

While the Empire State manufacturing index remained in positive territory, the Philly Fed index turned negative for the first time since December of 2006. The Philly Fed's main index for December fell to minus 5.7, its lowest reading in five years, from plus 8.2 in November. If the Philly Fed index is accurately forecasting the manufacturing sector, both housing and manufacturing would be tugging down on overall economic growth, making recession a more likely near-term event. But some of the report's key components are still pointing to growth. New orders are rose to 10.7 from 3.5 in November. Rather than recession in manufacturing, the overall picture may instead be one of near flat but still positive growth in the near term.
The economy is mixed according to component strength as indicated by last week’s data. The consumer sector has turned out to be stronger than expected but could be softening a bit in tandem with the labor markets. Housing remains in recession but could be leveling off, especially if lower interest rates nudge up home sales. The manufacturing outlook is a little cloudy as recent manufacturing surveys indicate some softening in production even as exports are rising and consumers are opening wide their billfolds and purses. Inflation has jumped but it could turn around should oil prices fall with a weakening economy. Which is the real economy' The Fed would like the one that “stands up” to be one somewhere in the middle with moderate growth and slow inflation. While it is uncertain which economy we have right now, the Fed will certainly be focusing on the fact that it is the Fed’s job to make sure the right economy is the one that stands up.
During this holiday shortened week, the only market moving indicator is the durable goods orders report. Next in importance is the new home sales report which us gives an update on whether housing is starting to level off or not.
SIFMA Recommends Early Market Close, 2:00 p.m. ET
Christmas Day. All markets closed.
Durable goods orders fell 0.4 percent in October, following a 1.4 percent decline in September. While this series is volatile, the numbers are adding up to softening in the manufacturing sector. Even excluding the transportation component, new orders fell 0.7 percent in October, but did follow a 1.1 percent rebound in September. More recently, manufacturing surveys have been weakening, including the Empire State survey and especially the Philly Fed survey which turned negative in December.
New orders for durable goods Consensus Forecast for November 07: +3.0 percent
Range: +1.0 percent to +4.8 percent
Initial jobless claims rose 12,000 in the week ending December 15 to 346,000. The 346,000 level, along with the four-week average of 343,000, possibly signals some loosening in the labor market when compared to the roughly 320,000 trend for most of the third quarter. However, during the holiday season, these weekly numbers are even more volatile than usual due to the difficulty of seasonally adjusting weekly numbers which are affected in part by when Thanksgiving falls and when subsequent holiday hires and lay-off occur.
Jobless Claims Consensus Forecast for 12/22/07: 343,000
Range: 340,000 to 345,000
The Conference Board's consumer confidence index sank in November due to high gas and home-heating bills, according to the Conference Board's monthly report that showed a headline dip to 87.3 in November from October's already soft 95.2. The Fed will be watching upcoming confidence reports not just for whether the consumer has the confidence to keep spending the economy away from recession but also to see if inflation expectations are becoming unanchored. In the November report, 12-month inflation expectations jumped six-tenths to 5.7 percent.
Consumer confidence Consensus Forecast for December 07: 86.5
Range: 85.0 to 89.0
The NAPM-Chicago purchasing managers’ index improved slightly in November rising to 52.9 from October's nearly dead-flat reading of 49.7. New orders were mildly positive, holding steady at 53.9 for a second straight month. But inflation pressures remain a concern. Prices paid rose 1.5 points to 76.2 in November.
NAPM-Chicago Consensus Forecast for December 07: 52.3
Range: 51.0 to 55.4
New home sales rebound in October to an annualized pace 728,000, but October sales were coming off a steeply downward revised 716,000 in September that marked a nearly 12-year low. The supply of unsold new homes improved slightly but remains glutted at an 8.5 month supply compared to 9.0 months in September. Existing home prices are weak as indicated by a nearly 9 percent plunge in October for a year-on-year decline of 13 percent. Until home sales pick up, we can expect new home construction to remain depressed. It may be a little early to see much of an effect yet, but the Fed’s interest rate cuts in September and in October could start impacting sales as soon as November – but only modestly since it is still so early since the cuts.
New home sales Consensus Forecast for November 07: 0.720 million-unit rate
Range: 0.700 million to 0.730 million-unit rate
For the first week finishing in the new year, the highlight clearly will be the December jobs report at week end. Earlier in the week, the only market mover is the ISM manufacturing survey for December. But at mid-week, the Fed releases its minutes of the December 11 policy meeting. These minutes will provided insight into current thinking on the economy by the Fed and may provide clues as to whether the Fed will be easing again on January 30.
Existing home sales in October fell to a new cyclical low, slipping 1.2 percent to a 4.97 million annual rate that is the lowest since the current series began in 1999. The slow sales pace has weighed heavily on the real estate market. Supply on the market has risen to a record 10.8 months. There is no doubt that it is a buyer’s market. Poor sales and heavy supply have eroded year-on-year prices, which are down 5.1 percent to a median $207,800. The National Association of Realtors which compiles the report blamed October's weakness on the continuing impact of the credit crunch and on high rates for jumbo loans which are not backed by government guarantees. But the September and October interest cuts by the Fed could be starting to have a positive effect on sales which we might start to see in the November data.
Existing home sales Consensus Forecast for November 07: 4.97 million-unit rate
Range: 4.86 to 5.15 million-unit rate
SIFMA Recommends Early Market Close, 2:00 p.m. ET
New Year’s Day. All markets closed.
The Institute for Supply Management’s manufacturing index remained near a flat reading in November as the composite index slipped 1 tenth to 50.8. New orders also remained just above the break-even level, rising 1 tenth to 52.6. Export orders were somewhat stronger than overall new orders. Inflation is a growing concern as the prices paid index rose 4.5 points to 67.5. With government data on factory orders coming in weak over the last couple of months, markets will be looking for indications that manufacturing is staying in positive territory, and the ISM index will give the first clue for December at the national level.
ISM manufacturing index Consensus Forecast for December 07: 50.3
Range: 50.0 to 51.0
Construction spending dropped 0.8 percent in October, following a 0.2 percent rebound in September. Construction outlays have been volatile over the last few months but appear to indicate a basically flat trend despite the sharp weakness in housing. Until recently, nonresidential and public sector gains in construction outlays have been offsetting declines in the residential component. On a year-on-year basis, overall construction outlays were down 0.6 percent in October.
Construction spending Consensus Forecast for November 07: -0.3 percent
Range: -0.6 to +0.3 percent
The Minutes of the December 11 FOMC meeting are scheduled for release at 2:15 p.m. ET. At the December 11 FOMC meeting, the Fed cut the fed funds target rate by 25 basis points with the statement focusing on mitigating potential weakness in the economy from credit crunch fallout. While the FOMC overall indicated its belief that risks to the economy were balanced (slow growth versus high inflation), the Boston Fed's Eric Rosengren dissented and would have preferred a 50 basis point cut. Markets will be pouring over details on Rosengren’s reasoning to see if it applies to current conditions and suggests whether the rest of the FOMC will want another rate cut on January 30 or hold steady as implied by balanced risks.
Motor vehicle sales showed a slight month-to-month increase in November with a U.S.-made annual rate of 12.2 million, up one tenth from a 12.1 million rate in October. Cars were a standout in the month, selling at a U.S.-made rate of 5.5 million, well above trend and reflecting a consumer shift toward cars and away from low mileage trucks. Light truck sales, which include SUVs and mini-vans, came in at a 6.7 million rate, one of the lowest rates of the expansion. Continued healthy income growth and a recent decline in interest rates could boost sales even more in December.
Motor vehicle sales Consensus Forecast for December 07: 12.3 million-unit rate
Range: 11.8 to 12.6 million-unit rate
Initial jobless claims rose recently with a 12,000 in the week ending December 15. With continued softness in housing and in manufacturing, we could see a modest rise in initial claims. The impact of the services sector is a little uncertain as consumer spending started out strong right after Thanksgiving but appears to have slowed somewhat since.
Jobless Claims Consensus Forecast for 12/29/07: 340,000
Range: 340,000 to 340,000
Factory orders rose 0.5 percent in October, following a 0.3 percent gain the prior month. But strength was in nondurables and likely was price related and does not reflect true strength for manufacturing. For the latest month, nondurables jumped 1.3 percent with gains led by petroleum & coal products, chemical products, and plastics & rubber products -- all heavily affected by the price of oil which has been rising sharply. Durables orders likely give a more accurate picture of manufacturing. New durables orders fell 0.4 percent in October, following a 1.4 percent decline in September.
Factory orders Consensus Forecast for November 07: +1.1 percent
Range: 0.0 to +2.0 percent
Nonfarm payroll employment in November posted a healthy gain of 94,000, following increases of 170,000 in October and 44,000 in September. But initial job claims have been edging up and we could see a softer employment gain in December. We got an upside surprise on earnings last month with a 0.5 percent surge in November, following a 0.1 percent increase in October. The Fed and the markets will be watching to see if the November jump was an aberration or the start of ramped up wage pressures. The unemployment rate was still relatively low in November, coming in at a steady 4.7 percent. The December jobs report clearly will be setting the stage for a month-long debate on whether the Fed will be easing again at the end of its policy meeting on January 30.
Nonfarm payrolls Consensus Forecast for December 07: +65,000
Range: +50,000 to +100,000
Unemployment rate Consensus Forecast for December 07: 4.8 percent
Range: 4.7 to 4.9 percent
Average workweek Consensus Forecast for December 07: 33.8 hours
Range: 33.8 to 33.8 hours
Average hourly earnings Consensus Forecast for December 07: +0.3 percent
Range: +0.2 to +0.3 percent
The business activity index from the ISM non-manufacturing survey in November slipped 1.7 points to a moderate 54.1. The big negative in the report was a sharp fall in new orders, which declined 4.6 points to 51.1, which is barely above break even. Another big negative in the report was a jump in prices paid, up 13 points to 76.5 and reflecting the effect of high gas prices. The ISM non-manufacturing index is one more indicator pointing to a combination of sluggish growth and higher inflation.
Business activity index Consensus Forecast for December 07: 54.0
Range: 52.0 to 55.0
|

