
 Volatility subsides for now
By Anne D. Picker, Chief Economist, Econoday
Friday, September 28, 2007

The third quarter came to a relatively quiet end last week. Poor U.S. economic data were accepted philosophically, not as a signal to sell. Each piece of bad news is now considered to be another plus for future U.S. interest rate cuts. Many emerging markets climbed to new highs while indexes in the developed economies continued to recover from late July and August losses. And volatility seemed to cool as well. On the quarter, six of the indexes followed here were down while eight recovered all of their mid-quarter losses and then some. Only the Japanese indexes are below year end levels.

The story for the U.S. dollar was different. The soft data and the expectation of further U.S. interest rate cuts sent the currency down against most major currencies. The U.S. dollar had already declined to parity against its Canadian counterpart the previous week and reached a 31-year low last week. The euro soared over $1.42 on Friday, setting a new all time high — and for the dollar an all time low. The Fed's trade-weighted index comparing the dollar with major currencies, going back to 1971, dropped to a record low in the week.
Of the indexes followed here only the Mexican Bolsa lost ground.
|
Index |
2006 |
% Change (Q/Q) |
% Change |
|
|
Dec 29 |
Q1 |
Q2 |
Q3 |
3 quarters |
| Asia |
|
|
|
|
|
|
| Australia |
All Ordinaries |
5644.3 |
5.93% |
5.55% |
4.28% |
16.59% |
| Japan |
Nikkei 225 |
17225.8 |
0.36% |
4.92% |
-7.46% |
-2.56% |
|
Topix |
1681.1 |
1.94% |
3.58% |
-8.92% |
-3.83% |
| Hong Kong |
Hang Seng |
19964.7 |
-0.82% |
9.96% |
24.66% |
35.95% |
| S. Korea |
Kospi |
1434.5 |
1.26% |
20.04% |
11.64% |
35.69% |
| Singapore |
STI |
2985.8 |
8.22% |
9.81% |
4.45% |
24.13% |
|
|
|
|
|
|
|
| Europe |
|
|
|
|
|
|
| Britain |
FTSE 100 |
6220.8 |
1.40% |
4.75% |
-2.14% |
3.95% |
| France |
CAC |
5541.8 |
1.67% |
7.47% |
-5.60% |
3.14% |
| Germany |
XETRA DAX |
6596.9 |
4.85% |
15.76% |
-1.82% |
19.17% |
|
|
|
|
|
|
|
| North America |
|
|
|
|
|
|
| United States |
Dow |
12463.2 |
-0.87% |
8.53% |
3.63% |
11.49% |
|
Nasdaq |
2415.3 |
0.26% |
7.50% |
3.77% |
11.85% |
|
S&P 500 |
1418.30 |
0.18% |
5.81% |
1.56% |
7.65% |
| Canada |
S&P/TSX Comp |
12908.4 |
1.99% |
5.63% |
1.38% |
9.22% |
| Mexico |
Bolsa |
26448.3 |
8.69% |
8.36% |
-2.74% |
14.55% |
| Markets were closed in Japan on Mon Sep 24, 2007 |
|
|
|
| Markets were closed in South Korea on Mon, Tues and Wed Sep 24 through 26, 2007 |
| Markets were closed in Hong Kong on Wed Sep 26, 2007 |
|
|
|
Unlike many of their counterparts in Asia, the FTSE, DAX and CAC are recovering at a slower pace from their precipitous declines around the subprime crisis. Although all three were positive for the month of September, they have a long way to go before recovering July’s losses — and in the case of the FTSE and CAC — June and August’s losses. Since the FOMC interest rate cut, the markets here have been less volatile — swings have been less violent as equity investors seem to be digesting U.S. economic data more equitably. And crude oil prices over $83 a barrel have been viewed simply as improved profits for energy producers. On the week, the FTSE, CAC and DAX gained 0.2 percent, 0.3 percent and 0.9 percent respectively.

- The CAC was the big loser in Europe for the third quarter, sinking by 5.6 percent after soaring 7.5 percent in the second and gaining 1.7 percent in the first. On the month, the index was up 0.9 percent and on the year, 3.1 percent.
- The FTSE lost a more modest 2.1 percent in the third quarter after gaining 4.8 percent in the second and 1.4 percent in the first. The index was up 2.6 percent in September and is up 4 percent so far in 2007.
- The strongest performer has been the DAX. The index lost a modest 1.8 percent after jumping 15.8 percent in the second quarter and a more modest 4.9 percent in the first. For September, the index was up 2.9 percent and is up 19.2 percent for 2007.
All Asian/Pacific stock indexes followed here were up last week, gaining from 1.4 percent (Kospi which was closed for three of the five trading days) to 5.0 percent (the Hang Seng which crossed the 27,000 level). All six indexes were up for the month of September as well. Overall, Asian (excluding Japan) indexes have been outperforming European and UK indexes both for the month and quarter.

- The All Ordinaries, which was down in July but not August, gained a hefty 5.3 percent in September. The index was up in each quarter this year. It gained 4.3 percent in the third quarter after gaining 5.6 percent in the second and 5.9 percent in the first. The index is up a hefty 16.6 percent so far in 2007.
- The Hang Seng soared 13.2 percent in September after jumping 6.5 percent in July and 3.4 percent in August. That brings its third quarter gain to 24.7 percent! The index was up 10 percent in the second quarter but declined 0.8 percent in the first. The index is up 36 percent for the year. Stocks related to China are in demand pushing the Hang Seng to multiple new highs during last week.
- The STI more than offset August’s loss of 4.4 percent with a 9.2 percent gain in September. In July, the index was unchanged. The index was up 4.5 percent in the third quarter following gains of 9.8 percent in the second quarter and 8.2 percent in the first.
- The Kospi also more than offset August’s 3.1 percent loss with a gain of 3.9 percent in September. The index had jumped 10.9 percent in July. The Kospi’s third quarter gain was a formidable 11.6 percent which followed on the heels of an 20 percent increase in the second quarter and 1.3 percent in the first.
- Only the Japanese indexes failed to keep pace. The Nikkei and Topix were down 4.9 percent and 3.9 percent respectively in July and were down 3.9 percent and 5.7 percent in August. While ending September on a positive note — the Nikkei gained 1.3 percent and the Topix, 0.5 percent — they continue to be below their 2006 end of year levels. In the third quarter, the Nikkei dropped 7.5 percent and the Topix 8.9 percent. However, both indexes were positive in the second and first quarters. The Nikkei was up 4.9 percent in the second and 0.4 percent in the first while the Topix increased 3.6 percent in the second and 1.9 percent in the first. For 2007 the Nikkei and Topix are down 2.6 and 3.8 percent respectively.
The U.S. dollar once again sank to a new low on Friday against the euro as readings for the Fed’s favorite inflation indicator were quite benign and indicative of another possible interest rate cut when the FOMC meets next at the end of October. The dollar has steadily weakened this year — losing about 8 percent to the euro, about 4.5 percent to the pound sterling and over 17 percent to the Canadian dollar which is now at a 31-year high. Even against the yen, the dollar is down about 3.8 percent so far this year. The dollar’s decline accelerated in the third quarter as the risk averse sought other shelters instead of the U.S. dollar.

The Australian dollar has benefited as investors flocked to the country to invest in its higher yielding securities. With the Reserve Bank of Australia’s 6.5 percent interest rate in comparison to lower rates elsewhere, Australia has been a hot destination for carry trade funds. Carry trade involves borrowing in a low interest rate country and investing in a high interest rate country.

EMU — M3 money supply for the three months ending in August was up 11.4 percent when compared with the same month a year ago. August M3 was up 0.9 percent on the month and 11.6 percent when compared with the same month a year ago. Private loans were up 11.2 percent on the year, up from 11 percent in July. This is the highest level since November 2006.

September flash estimate of the harmonized index of consumer prices was up sharply to 2.1 percent on the year as expected. This is the first time since August 2006 that the HICP was above the ECB’s 2 percent inflation target. As always there are no details provided in the flash estimate but national data from some of the Eurozone states suggest that lower energy and seasonal food costs were a restraining factor.

EU — September economic sentiment declined to 107.1 from a revised 109.9 in August. Four of the five main sectors were down. The industrial sector declined to a reading of 3 from 5 where it had been for both July and August. The services sector declined to 18 from 20 in August and 21 in July. The consumer sector slipped to minus 5 from minus 4 in August and minus 2 in July, while the retail sector sank to a reading of minus 3 from plus 3 in the previous 2 months. Construction however edged up to a reading of zero from minus 1.

Germany — September Ifo business conditions survey declined to 104.2 from 105.8. The dip reflected a fall in the expectations component (98.7 from 100.4) and current conditions index (109.9 from 111.5). Among the major sectors, sentiment in manufacturing dropped from 21.5 to 18.2 and in construction from minus 17.5 to minus 20.7. Retail sank to minus 12.9 from minus 4.3 but wholesale was up to 10.7 from 8.1 in the previous month. Ifo said that the first signs of a slowdown were evident in the September data but did not see any need for the ECB to react.

September unemployment rate edged down to 8.8 percent from 8.9 percent in the previous month. Unemployment continued to decline with a drop of 50,000. Even so, payrolls were up 34,000 while vacancies were lower at 2,000. The unemployment drop was split between East and West with declines of 20,000 and 30,000 respectively. The unemployment rates in the East and West were 14.7 percent and 7.3 percent respectively.

August retail sales excluding autos and gasoline stations dropped 1.4 percent after increasing 0.6 percent in the month before. The decline was the largest since the 3.2 percent drop in May. Real retail sales excluding cars and petrol stations dropped 2.2 percent. Particularly weak were clothing & shoes, down 2.9 percent, with special store sales down 3.3 percent. When compared with the same month a year ago, real retail sales were down 2.2 percent after declining 1.0 percent in July. Retail sales including the autos and gasoline stations were down 0.1 percent and declined 3.2 percent on the year.

France — Data for both July and August consumer spending on manufactured goods are customarily released in September after the summer holidays and this year was no different. July and August consumer spending on manufactured goods was up 0.9 percent and 1.0 percent respectively. On the year, spending was up 4.4 percent in July and 3.6 percent in August. The gains reflected hefty increases in durable goods spending, up 1.2 percent in July and 3 percent in August. After sinking 1.8 percent in June, auto sales rebounded by 1.9 percent in July and an even greater 3.4 percent in August. Household goods were up 0.9 percent and 2.8 percent for July and August. Textiles were up 2.1 percent and 0.2 percent for the two months.

Second quarter gross domestic product was up an unrevised 0.3 percent and 1.4 percent when compared with the same quarter a year ago. Household consumption and public sector spending remain the key drivers in the economy with advances of 0.6 percent and 0.5 percent, respectively. Capital formation has slowed significantly, with a moderate 0.4 percent increase in the second quarter, following a 1.2 percent surge the prior quarter. Import growth outpaced export growth in the second quarter, 1.9 percent to 0.9 percent.

August producer price index was up 0.2 percent following July’s 0.4 percent gain. Excluding food and energy, producer prices were quite soft with prices flat in August, following July’s 0.2 percent increase. When compared with the same month a year ago the overall PPI was up 1.6 percent in August while core PPI excluding food and energy was up 1.9 percent. Capital goods prices edged down 0.1 percent while auto industry prices were flat. Upward pressure continued in agricultural & food products which posted a 1.1 percent jump in August, just above the 1.0 percent increase the month before. Consumer goods prices advanced 0.2 percent in both July and August.

INSEE, the French statistical agency, will no longer be releasing the International Labour Organisation unemployment rate for the foreseeable future because of serious data problems.
Italy — July retail sales edged down 0.1 percent and were up 0.1 percent when compared with last year. In June, sales were down 0.3 percent on the month and up 0.5 percent on the year. Underlying sales were even weaker with food sales dropping 0.2 percent on the month and 0.8 percent on the year. Non-food sales were flat on the month and up 0.6 percent on the year. Retail sales continue to be lackluster.

July unadjusted merchandise trade balance recorded a surplus for a second month of E1.8 billion. World exports were up 14.2 percent while imports were up 10.8 percent when compared with the same month a year ago.

August producer price index was up 0.1 percent and 1.9 percent when compared with last year. On the year, the increase is the lowest since the 1.7 percent increase for April 2004. Keeping the overall index soft was a 0.4 percent decline in energy goods, which reversed a large portion of the 0.6 percent boost in energy costs the month before. Capital goods rose a moderate 0.2 percent in the latest month while consumer goods price inflation eased to 0.3 percent in August from 0.4 percent in July. On the year the consumer goods portion of the index was up 2.2 percent in August, compared to up 2.0 percent the month before.

United Kingdom — Second quarter gross domestic product growth was confirmed at 0.8 percent on the quarter. When compared with the same quarter last year, GDP was revised to a gain of 3.1 percent from the earlier estimate of 3 percent. GDP continues to grow at an above trend pace thanks to household spending. Household spending was up 0.8 percent and 2.7 percent on the year. Government spending was up 0.3 percent and 2 percent on the year. In terms of output the goods producing sector expanded 0.7 percent on the quarter and services were up 0.9. Manufacturing grew 0.8 percent and construction 8 percent. The only decline was in gross fixed capital formation which dropped 0.9 percent following hefty gains earlier. The GDP deflator was up at a 1.1 percent quarterly pace and a 3.7 percent rate on the year.
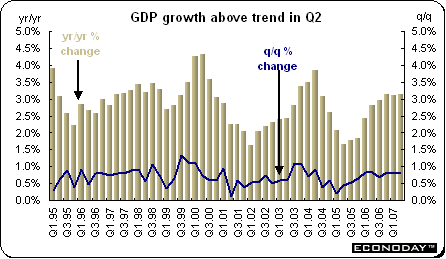
Japan — August unadjusted merchandise trade surplus was ¥743.2 billion as exports of autos and steel surged. The consensus was a surplus of ¥280 billion. On the year, exports were up 14.5 percent while imports were up 5.7 percent. Exports to the U.S. were up 4.6 percent while those to the EU were up 15.6 percent. However, imports from the U.S. declined 4.6 percent while imports from the EU jumped by 10.8 percent. The trade balance with the U.S. was up 15 percent. On a seasonally adjusted basis, the trade surplus was ¥1,145 trillion. Exports were up 2 percent while imports dropped 1.9 percent.
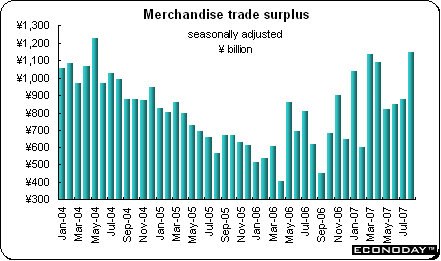
September Tokyo consumer price index was up 0.1 percent but down 0.2 percent when compared with the previous year. Core CPI excluding only fresh food was unchanged on the month and down 0.1 percent on the year. August national CPI was up 0.5 percent on the month but was negative for the seventh month, edging down 0.2 percent on the year. August core CPI excluding only fresh food was up 0.2 percent on the month and down 0.1 percent on the year. Excluding both food and energy, core CPI was up 0.3 percent but down 0.2 percent on the year. Prices were down for most of the major categories with the exception of medical care and clothes & footware, both of which were up 0.8 percent on the year. Education was up 0.7 percent.
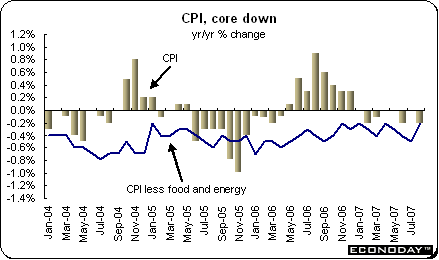
August unemployment rate unexpectedly rose to 3.8 percent from 3.6 percent in July. The number of unemployed people declined for the 20 straight month however, down 230,000 when compared with a year ago. The number of jobs created was 190,000 from a year earlier for an 11 consecutive monthly increase.
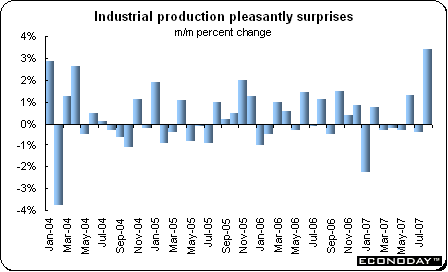
August preliminary industrial production grew at the fastest pace in almost four years. Production climbed a seasonally adjusted 3.4 percent and was up 4.3 percent when compared with last year. The jump was attributed to higher exports and the resumption of manufacturing by major automakers after a July earthquake disrupted output.
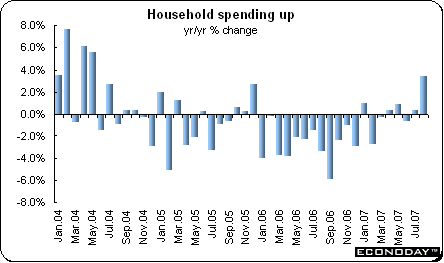
August household expenditures were up 1.6 percent in real terms when compared with the previous year. It was the first increase in two months. Spending by households headed by wage-earners climbed 3.6 percent in real terms from a year earlier. The propensity for wage earners to consume, a ratio that measures the amount of disposable income that went to household spending, was up 5.0 points on the year to 82.6 percent.
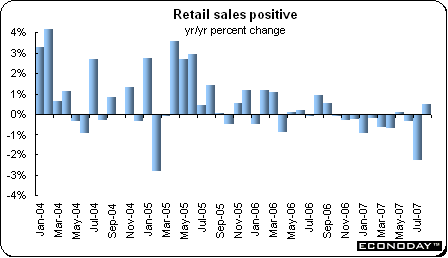
August retail sales were up 0.5 percent when compared with last year after declining in June and July. Large scale retail stores sales were unchanged after plummeting 3.8 percent on the year in July. The consumer continues to be the weak link in the economic recovery.
Canada — August industrial product price index dropped 1.0 percent and 0.7 percent when compared with last year. This is the fourth consecutive month of price declines. The drop in prices essentially reflected lower prices for primary metal products, petroleum and coal products, and chemical products. However, higher prices for motor vehicles and other transportation equipment, as well as for pulp and paper products, tempered the decline. The decline in the IPPI was slowed by an increase in prices for motor vehicles (up 0.5 percent) in conjunction with the depreciation of the Canadian dollar against its US counterpart. This was the first increase in the motor vehicles price index after six consecutive monthly declines. Prices for primary metal products fell 3.6 percent in August after three consecutive monthly declines. The index has fallen 14.2 percent from the historic level reached in April 2007. In August, nickel products fell 16.7 percent, following two strong monthly declines. Nickel prices continued to react to high inventories and decreased demand from steel producers. Other decreases in metal prices had less effect on the movement of the primary metal products index.
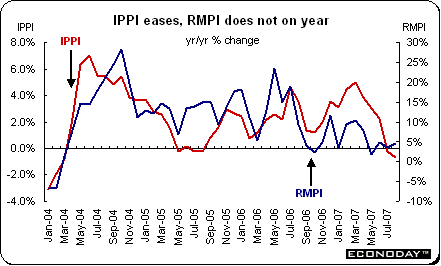
August raw materials price index plummeted 2.8 percent but was up 4.5 percent when compared with last year. The index was pulled down by lower prices for non-ferrous metals and mineral fuels, while increases in the prices for vegetable products and ferrous materials had little effect on the movement of the RMPI. On the year, the increase was mainly due to prices for non-ferrous metals and vegetable products, while it was slowed by prices for mineral fuels. Non-ferrous metals fell 7.8 percent. While the decrease was fairly general among metals, much of the decline was caused by a 16.0 percent drop in radioactive concentrates. Prices for radioactive concentrates had strongly increased in recent years, in conjunction with higher oil prices. There is now less pressure on energy prices, and consequently on radioactive concentrates, which were nevertheless 123.8 percent above the average level for 2006. Prices for other non-ferrous metals also felt the effect of reduced demand. Mineral fuels declined 2.3 percent after two months of strong increases. If mineral fuels had been excluded, the RMPI would have fallen 3.3 percent from July instead of declining 2.8 percent.
The value of the Canadian dollar against the U.S. dollar fell 0.8 percent in the month of August. Consequently, without the effect of the exchange rate, the change in the IPPI would have been a 1.2 percent decline instead of a 1.0 percent decline. The value of the Canadian dollar increased 5.4 percent on the year. If the impact of the exchange rate had been excluded, producer prices would have risen 0.8 percent instead of falling 0.7 falling.
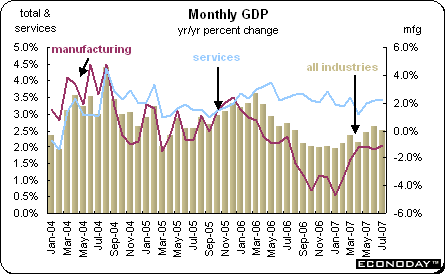
July monthly gross domestic product was up 0.2 percent and 2.5 percent when compared with the same month a year ago. This has been its average pace since the beginning of 2007. A significant increase in wholesale trade propelled the growth while a drop in oil and gas extraction dampened it. The strength of the service industries, up 0.3 percent, more than offset the 0.1 percent decrease in the production of goods. Gains were registered in manufacturing, construction, oil and gas exploration, and the financial sector. Declines were recorded in the forestry, retail trade, utilities, and accommodation and food services sectors. Wholesale trade jumped 2.3 percent in July, the largest monthly increase recorded since its 4.4 percent gain in March 2004. A surge in motor vehicle sales (including parts) combined with significant increases in sales of machinery & equipment and of personal & household products drove this sector. The energy sector fell 1.3 percent. Both natural gas and petroleum extraction experienced declines. However, oil and gas exploration soared 12.9 percent, a second consecutive monthly increase after four months of significant declines.
Last week provided a cornucopia of new economic data, especially on Thursday and Friday. The news was mixed, showing a definite slowing in Germany, a continued lackluster economy in France and a rebound in industrial production in Japan. The good news in Japan, however, was offset by a surprise jump in the unemployment rate and the continued downdraft in consumer prices.
The first week of the month brings with it several central bank announcements. The Bank of England and the European Central Bank are expected to keep interest rates at their current levels of 5.75 percent and 4 percent respectively. The Reserve Bank of Australia is also expected to maintain its 6.5 percent interest rate on Wednesday. Some analysts look for rate cuts in the UK and EMU soon because although there are signs that money markets are beginning to normalize, they have yet to return to pre-crisis conditions despite repeated injections of liquidity.
| Central Bank activities |
|
| October 3 |
Australia |
Reserve Bank of Australia Monetary Policy Announcement |
| October 3,4 |
UK |
Bank of England Monetary Policy Meeting |
| October 4 |
EMU |
European Central Bank Monetary Policy Meeting and Announcement |
|
|
|
| The following indicators will be released this week... |
| Europe |
|
|
| October 2 |
EMU |
Unemployment (August) |
|
|
Producer Price Index (August) |
| October 3 |
EMU |
Retail Sales (August) |
|
|
|
| Asia/Pacific |
|
|
| October 1 |
Japan |
Tankan Survey (Q2.07) |
| October 3 |
Australia |
Merchandise Trade Balance (August) |
|
|
Retail Sales (August) |
|
|
|
| Americas |
|
|
![[Econoday]](images/econoday_logo_slim.gif)
Important Legal Notice: Econoday has attempted to verify the information contained in this calendar. However, any aspect of such info may change
without notice. Econoday does not provide investment advice, and does not represent that any of the information or related analysis is accurate or complete at any time.
Consensus Data Sources: Econoday Consensus Survey and Market News
|
| |
| Legal Notices | ©Copyright 1998-2024 Econoday, Inc. |
powered by ![[Econoday]](images/logo.gif)
|
| |
|
Econoday Suggestion Box: We welcome your ideas on how we can serve you better.
|
| 
