
 May sets a positive tone for June
By Anne D. Picker, Chief Economist, Econoday
Friday, June 1, 2007

Global Markets
Equities continued their upward trajectory into June on renewed acquisition and merger activity and favorable economic data. The notable exceptions were Chinese equities and with a secondary effect, those in Hong Kong. However the gains in the month of May were impressive (see table below). The best performer in the month was the Kospi, up 10.3 percent while the Bolsa followed with a respectable gain of 8.3 percent. The DAX jumped 6.4 percent. The smallest monthly increase was registered by the Hang Seng — it was up a ‘mere’ 1.6 percent.
| Global Stock Market Indexes — Monthly Changes |
|
|
|
|
|
2006 |
|
2007 |
|
|
|
|
|
% Change Previous Month |
|
| Asia |
|
December |
January |
February |
March |
April |
May |
| Australia |
All Ordinaries |
5644.30 |
2.0% |
1.0% |
2.8% |
3.0% |
3.0% |
| Japan |
Nikkei 225 |
17225.83 |
0.9% |
1.3% |
-1.8% |
0.7% |
2.7% |
|
Topix |
1681.07 |
2.4% |
1.8% |
-2.2% |
-0.7% |
3.2% |
| Hong Kong |
Hang Seng |
19964.72 |
5.7% |
-6.9% |
0.8% |
2.6% |
1.6% |
| S. Korea |
Kospi |
1434.46 |
-5.2% |
4.2% |
2.5% |
6.2% |
10.3% |
| Singapore |
Singapore Straits |
2985.83 |
4.7% |
-0.4% |
3.8% |
4.0% |
4.5% |
|
|
|
|
|
|
|
|
| Europe |
|
|
|
|
|
|
|
| Britain |
FTSE 100 |
6220.80 |
-0.3% |
-0.5% |
2.2% |
2.2% |
2.7% |
| France |
CAC |
5541.76 |
1.2% |
-1.6% |
2.1% |
5.8% |
2.4% |
| Germany |
XETRA DAX |
6596.92 |
2.9% |
-1.1% |
3.0% |
7.1% |
6.4% |
|
|
|
|
|
|
|
|
| North America |
|
|
|
|
|
|
|
| United States |
Dow |
12463.2 |
1.3% |
-2.8% |
0.7% |
5.7% |
4.3% |
|
Nasdaq |
2415.3 |
2.0% |
-1.9% |
0.2% |
4.3% |
3.1% |
|
S&P 500 |
1418.30 |
1.4% |
-2.2% |
1.0% |
4.3% |
3.3% |
| Canada |
S&P/TSX Comp |
12908.4 |
1.0% |
0.1% |
0.9% |
1.9% |
4.8% |
| Mexico |
Bolsa |
26448.3 |
4.2% |
-3.3% |
7.9% |
0.9% |
8.3% |
The week got off to a slow start with several of the main markets observing a holiday on Monday. Renewed M&A activity helped push world equities higher although the gains were limited as investors awaited a plethora of key U.S. economic releases. In Japan, the jobless rate sank to a nine year low while overall household spending grew by 1.1 percent from a year earlier. On Wednesday, the Chinese CSI 300 lost the most since February 27 as more than half its 300 members sank by the daily 10 percent limit. The precipitous decline took other Asian/Pacific indexes with it and then those in Europe. However, later in the trading day, the text of the Federal Reserve’s May 9th meeting cheered investors and North American indexes closed in the black. Needless to say, international indexes also rallied on the minutes, putting behind them the CSI decline. While the CSI rallied Thursday, it retrenched again on Friday. Only the Hang Seng seemed to notice and was down on the day. Equities in Europe, the UK and the U.S. were boosted by an employment gain in the United States that was larger than anticipated despite downward revisions to the previous months’ data.
Global Stock Market Recap
| |
|
2006 |
2007 |
% Change |
|
| |
Index |
December 29 |
May 25 |
June 1 |
Week |
Year |
|
| Asia |
|
|
|
|
|
|
|
| Australia |
All Ordinaries |
5644.3 |
6273.3 |
6363.5 |
1.4% |
12.7% |
|
| Japan |
Nikkei 225 |
17225.8 |
17481.2 |
17958.9 |
2.7% |
4.3% |
|
| |
Topix |
1681.1 |
1715.5 |
1767.9 |
3.1% |
5.2% |
|
| Hong Kong |
Hang Seng |
19964.7 |
20520.7 |
20602.9 |
0.4% |
3.2% |
|
| S. Korea |
Kospi |
1434.5 |
1644.6 |
1716.2 |
4.4% |
19.6% |
|
| Singapore |
STI |
2985.8 |
3486.6 |
3548.3 |
1.8% |
18.8% |
|
| |
|
|
|
|
|
|
|
| Europe |
|
|
|
|
|
|
|
| UK |
FTSE 100 |
6220.8 |
6570.5 |
6676.7 |
1.6% |
5.8% |
|
| France |
CAC |
5541.8 |
6057.5 |
6168.2 |
1.8% |
11.3% |
|
| Germany |
XETRA DAX |
6596.9 |
7739.2 |
7987.9 |
3.2% |
21.1% |
|
| |
|
|
|
|
|
|
|
| North America |
|
|
|
|
|
|
| United States |
Dow |
12463.2 |
13507.3 |
13668.1 |
1.2% |
9.7% |
|
| |
NASDAQ |
2415.3 |
2557.2 |
2613.9 |
2.2% |
8.2% |
|
| |
S&P 500 |
1418.3 |
1515.7 |
1536.3 |
1.4% |
8.3% |
|
| Canada |
S&P/TSX Comp. |
12908.4 |
14024.1 |
14119.4 |
0.7% |
9.4% |
|
| Mexico |
Bolsa |
26448.3 |
30700.0 |
31946.4 |
4.1% |
20.8% |
|
| Markets in the UK, Germany and the United States were closed on Monday, May 28, 2007 |
| Markets in Singapore were closed on Thursday, May 31, 2007 |
Europe and the UK
May’s gains in equities here were led by the German DAX, which gained 6.4 percent, leaving the CAC and FTSE in its wake. The FTSE gained a healthy 2.7 percent while the CAC was up 2.4 percent on the month. The DAX had increased at an even faster pace in April, when it gained 7.1 percent as did the CAC, which gained 5.8 percent in the month. And May’s increases continued into the first day of June as positive U.S. data combined with merger and acquisition chatter and strong corporate earnings news to keep investors in a buying mood. And despite Wednesday’s declines (and Tuesday’s decline in the CAC) the three indexes soared on the week, with the DAX leading the pack with a 3.2 percent weekly gain, followed by the CAC with 1.8 percent and the FTSE, 1.6 percent as positive corporate earnings news elevated the markets. Positive thoughts about the U.S. economy usually seem to bolster European equities as do positive performances by U.S. stock indexes.

On Wednesday, European and UK stocks dropped the most in two months after China increased taxes on securities trades, sparking concern that global shares could be facing another sell-off. But the three indexes clawed their way back by the end of business to keep losses under 0.25 percent. They ignored Friday’s CSI drop and focused instead on the U.S. employment report which showed that employment had increased more than anticipated by analysts.
Asia/Pacific
Asian/Pacific indexes continued their march upward in May with all followed here recording healthy gains. Stocks in Hong Kong were affected by the declines in mainland China stocks. The index recorded the slowest growth in the region, up 1.6 percent on the month. The best performer was the Kospi, which gained 10.3 percent in May after a 6.2 percent increase in April. Both the Nikkei and Topix had their best month of the year in May, increasing by 2.7 percent and 3.2 percent respectively. The All Ordinaries continued their even pace of increases. The index scored a 3 percent increase in both April and May after recording a 2.8 percent gain in March. The STI has also produced three months of steady gains, with its May gain of 4.5 percent which followed increases of 4 percent and 3.8 percent respectively in April and March.

Stocks in the region seemed to shrug off the declines in the Chinese CSI 300 index which were set off by the government’s May 30th decision to triple the tax on securities trades to try to cool investors’ appetite. However, investor concerns eased at the stock decline in China as it proved to be a ‘local’ event. International investors preferred to focus on favorable U.S. news including new highs for the Dow and S&P 500 along with earnings and merger activity instead. The impact on international markets should be limited because government restrictions keep its markets mostly isolated from global financial flows. South Korea's Kospi posted a record 13th week of gains and is now up 19.6 percent for the year.
Americas
After February’s losses by all but the S&P/TSX composite, all five indexes have followed a solid course upward, with new record highs set during May. While the three U.S. indexes — Dow, S&P 500 and Nasdaq — did not beat April’s gains, those scored by the Bolsa and S&P/TSX composite did. The Dow gained 4.3 percent in May while the S&P 500 was up 3.3 percent and the Nasdaq, 3.1 percent. In April, the Dow was up 5.7 percent while the S&P and Nasdaq both gained 4.3 percent. The Bolsa soared 8.3 percent in May after increasing less than 1 percent in April. The S&P/TSX composite had its best month this year, climbing by 4.8 percent after April’s 1.9 percent gain. The Canadian index has been very much affected by commodity price fluctuations for metals and energy producing companies.

Bank of Canada decision — not now but...
For the first time in a year, the Bank intimated that it is ready to increase interest rates because inflation is accelerating faster than it expected. In the statement accompanying their decision on Tuesday, they said that the Bank might increase rates “in the near term” should inflation stay above 2 percent — the mid-point of its 1 percent to 3 percent inflation target range. The Canadian dollar climbed to its highest level in more than 30 years and government bond yields surged. The Bank, which meets about every six weeks, will make its next announcement on July 10. The central bank last increased their policy interest rates in May 2006. The target rate for overnight loans is currently 4.25 percent and 1 percentage point below the Fed’s target federal funds rate of 5.25 percent.

Currencies
The yen was down again against the U.S. dollar and euro last week. The currency initially rose Monday after the Japanese unemployment rate sank to a 9 year low and household spending accelerated. However, the yen retreated after Japanese industrial production data disappointed. Counterbalancing this were U.S. data that added to signs that the economy is regaining some strength after a weak first quarter. Better than anticipated employment data combined with the ISM manufacturing index — which showed improved conditions — contributed towards the dollar’s strength. According to analysts, the data only gave the Federal Reserve more reason to keep its key interest rate at 5.25 percent rather than reducing it as many market players originally anticipated. And with the Bank of Japan seemingly on hold for at least the next few months, the spread between eurozone and U.S. interest rates and those in Japan offers yet another reason to sell yen.

Indicator scoreboard
EMU — M3 money supply for the three months ending April was up 10.4 percent when compared with the same three months a year ago. M3 for April was also up 10.4 percent on the year. The ECB’s reference rate for money supply growth is 4.5 percent for the three month moving average. April loans to the private sector were up 10.3 percent on the year, slightly lower than March’s 10.5 percent gain.

May flash harmonized index of consumer prices was up 1.9 percent when compared with the same month a year ago. This was the ninth month that the HICP was below the ECB’s 2 percent inflation ceiling. As with all flash reports, no detail is available.

First quarter gross domestic product was up 0.6 percent and 3 percent when compared with last year. Household consumption edged down 0.1 percent after increasing 0.4 percent in the last quarter of 2006. Household consumption was weighed down by the negative impact of Germany’s increase in its value added tax (VAT). However fixed capital formation jumped by 2.5 percent on the quarter after increasing 1.5 percent in the fourth quarter.

April unemployment rate edged down to 7.1 percent — its lowest reading since 1993 — from 7.2 percent in the previous quarter. German unemployment as calculated by Eurostat dropped to 6.7 percent from 7 percent in March while French unemployment edged down to 8.6 percent from 8.7 percent.

EU — May EU economic sentiment climbed to 111.9 from 111.0 in April. Industry sentiment edged down to a reading of 6 from 7 in the previous month while consumer sentiment improved to minus 0.1 from minus 0.4 in April. Sentiment in services declined to 22 from 23 in April while retail sentiment improved from flat to plus 2.

Germany — April retail sales sank 2.1 percent but were up 2.1 percent when compared with last year. Excluding autos and gasoline stations, sales were up 2.6 percent and 0.6 percent when compared with last year. Unadjusted food, drinks and tobacco sales were up 2.7 percent and 1.8 percent while clothing, shoes & leather goods soared 8.1 percent on the month and 9.5 percent on the year. Home furnishing sales dropped 1.3 percent on the month and edged down 0.1 percent on the year.

April unemployment rate was unchanged at 9.2 percent. The unemployment rate remained at 7.6 percent and 15.2 percent for West and East Germany respectively. According to seasonally adjusted data using International Labour Organisation criteria, April's number of unemployed plummeted by 140,000 while the number of employed increased by 35,000. The ILO unemployment rate dropped to 6.4 percent from 6.8 percent in March. ILO defines unemployed persons as those without work who are actively looking for a job and can immediately begin to work.

France — April unemployment rate was down to 8.2 percent from 8.3 percent in March. The number of unemployed according to the International Labour Organisation definition dropped by 20,000. The unemployment rate is at its lowest in over 24 years. The ILO definition excludes jobseekers who did any work during the month. The number of unemployed is 282,000 below the level a year earlier.

April producer price index was up 0.5 percent and 1.9 percent when compared with last year. Excluding food and energy the PPI was up 0.3 percent and 2.7 percent on the year. Energy prices, which account for 17 percent of the index, were up 1.3 percent on the month but down 1.6 percent on the year. Food and agriculture products were up 0.4 percent and 2.7 percent on the year.

Asia/Pacific
Japan — April unemployment rate sank to a nine-year low of 3.8 percent from 4 percent in the previous month. The ratio of jobs available per applicant improved for the first time in nine months, climbing to 1.05 from 1.03. Behind the big drop in the jobless rate was a sharp increase in the hiring of young workers. The jobless rate among those aged between 15 and 24 fell steeply.

April household spending was up 1.1 percent while worker household spending climbed by 0.4 percent. The government cautioned that one-off factors are behind the big gain in April household spending, including payments for college tuition and purchases of durable goods as the Japanese school year starts in April.

April retail sales were down 0.6 percent, the seventh straight month of decline. But some analysts said the data may just reflect shoppers buying at new stores and at distribution channels not included in the data and do not reflect a sign of weak consumption.

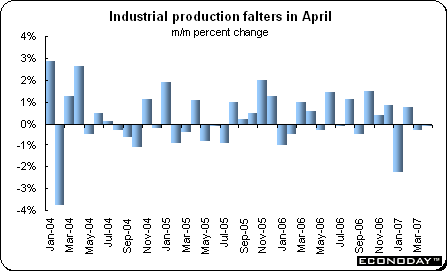
April industrial production edged down 0.1 percent and was up 2.5 percent when compared with last year. Transportation equipment led the decline in production, dropping 2.8 percent. Output of chemicals and electronic parts & devices industries were also down on the month. Shipments were up 0.9 percent, exceeding the 0.5 percent growth in inventories, which in turn resulted in a 0.2 percent reduction in the ratio of inventories to shipments.
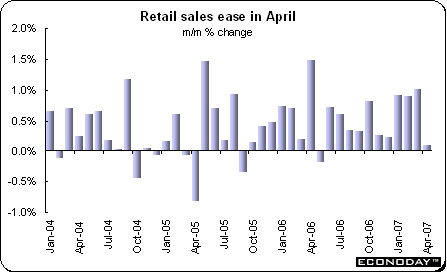
Australia — April retail sales edged up 0.1 percent and were up 6.2 percent when compared with the same month a year ago. Food sales were up 1.4 percent while clothing & soft good sales gained 0.2 percent. However, department store sales sank 3.4 percent while other retail sales were down 1.7 percent and recreational goods declined 1.3 percent. Analysts noted that high gasoline prices worried consumers more than high interest rates.
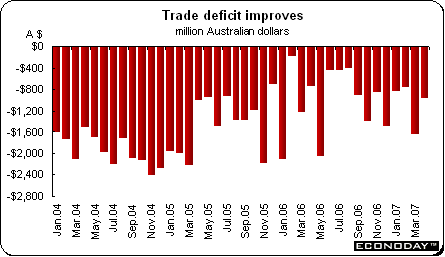
April merchandise trade deficit was A$962 million, substantially lower than March’s deficit of A$1.6 billion. Exports were up 1.5 percent while imports were down 2.1 percent. Non-rural and other goods exports were up 3 percent while rural goods sank 3 percent. Services exports were up 1 percent. Imports of capital goods declined by 7 percent while intermediate & other goods were down 2 percent and consumption goods, 1 percent.
Americas
Canada — April industrial product price index was up 0.2 percent and 3.7 percent when compared with last year. The monthly increase reflects the strength of prices for petroleum and coal products and primary metal products. On the year, the upward pressure came largely from higher prices for primary metal products but was slowed by a drop in prices for lumber and other wood products and motor vehicles. Petroleum and coal prices were up 3.6 percent on the month after surging 8.9 percent in March. Primary metal product price increases also eased and were up 1.1 percent after jumping 3.7 percent in March.
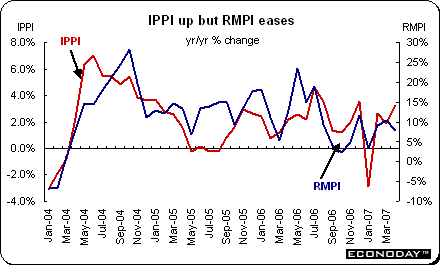
April raw materials price index was up 3.3 percent and 7.9 percent when compared with last year. The monthly advance in the index was mainly attributable to mineral fuels and non-ferrous metals. Vegetable products and ferrous materials were the only groups that declined. The increase was mainly led by non-ferrous metals and was moderated by mineral fuels. Non-ferrous metals prices jumped 7.4 on the month while prices for all non-ferrous metal groups were affected by vigorous demand and falling inventories.
In April, the value of the Canadian dollar against its U.S. counterpart was up nearly 3.0 percent. Without the effect of the exchange rate, the IPPI would have risen 1.0 percent instead of 0.2 percent. On a 12-month basis, the value of the Canadian dollar was up 0.8 percent. If the impact of the exchange rate had been excluded, producer prices would have increased by 3.9 percent rather than 3.7 percent.
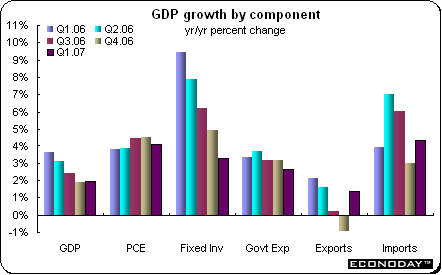
First quarter gross domestic product was up 0.9 percent and 2 percent when compared with last year. On an annualized basis, GDP was up a healthy 3.7 percent. Personal spending continued to be strong — up 1 percent on the quarter. The service sector was up 1 percent while the goods sector was up 0.9 percent. The goods sector was up mainly because of improved performance by energy, wholesale & retail trade as well as the financial sector and construction. Manufacturing was unchanged after declining for the four previous quarters.
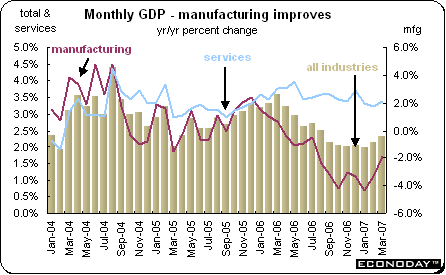
March monthly gross domestic product was up 0.3 percent and 2.3 percent when compared with last year. An increase in services industries of 0.5 percent more than offset the decline of 0.2 percent in goods production. Both wholesale (up 1.8 percent) and retail trade (1.4 percent) were up sharply thanks to new car sales. Manufacturing was up 0.8 percent with durables up 1 percent and nondurables advancing 0.4 percent. Sixteen of the 21 manufacturing groups that accounted for 80 percent of total manufacturing value added were up on the month.
Bottom line
The week past provided investors with a plethora of new data by which to judge their investments. Most were positive giving evidence that growth is alive and well. The decline in the China CSI caused only a momentary flutter internationally on Wednesday while Friday’s decline was mostly ignored.
This week brings meetings of the Reserve Bank of Australia, Bank of England and the European Central Bank. Only the ECB is expected to increase rates from their current level of 3.75 percent to 4 percent. After the ECB’s last meeting in May, Bank President Jean Claude Trichet used the code word ‘vigilance’ which market players interpret to mean a rate increase is in the cards for the following meeting. While rate increases are probably in the future for both Australia and the UK, none are expected this week.
Looking Ahead: June 4 through June 8, 2007
| Central Bank activities |
|
| Jun 6 |
Australia |
Reserve Bank of Australia Policy Announcement |
| Jun 6 |
EMU |
European Central Bank Announcement |
| June 6,7 |
UK |
Bank of England Monetary Policy Meeting |
| |
|
|
| Other events |
|
|
| June 6 to 8 |
Germany |
Group of Eight Summit Meeting |
| |
|
|
| The following indicators will be released this week... |
| Europe |
|
|
| Jun 4 |
EMU |
Producer Price Index (April) |
| Jun 5 |
EMU |
Retail Sales (April) |
| Jun 6 |
Germany |
Manufacturers' Orders (April) |
| Jun 8 |
Germany |
Industrial Production (April) |
| |
|
Merchandise Trade Balance (April) |
| |
France |
Merchandise Trade Balance (April) |
| |
Italy |
Gross Domestic Product (Q1.07 final) |
| |
UK |
Industrial Production (April) |
| |
|
|
| Asia/Pacific |
|
|
| Jun 6 |
Australia |
Gross Domestic Product (Q1.07) |
| Jun 7 |
Australia |
Employment, Unemployment (May) |
| |
|
|
| Americas |
|
|
| Jun 8 |
Canada |
Employment and Unemployment (May) |
| |
|
Merchandise Trade Balance (April) |
Anne D Picker is the author of International Economic Indicators and Central Banks.


|

