
 Data, M&A cheer investors
By Anne D. Picker, Chief Economist, Econoday
Friday, May 4, 2007

Global Markets
After a hesitant start, many equity indexes in Europe, North America and Asia (except those in Japan) soared to new highs and fresh six year plus levels thanks to mostly favorable U.S. data and an avalanche of new merger and acquisition news. Japan celebrated its Golden Week holidays and markets there were closed for three of five trading days. Many Asian and European markets were closed for May Day. The U.S. S&P 500 edged above 1,500 for the first time since September 2000 while the Dow continued to set new highs. The S&P was joined by the DAX, CAC and FTSE as they climbed to their best levels in over six years while several Asian indexes including the Hang Seng hit lifetime highs.
The U.S. dollar was up against the euro and the pound sterling after the Institute For Supply Management reported favorably on the manufacturing and services sectors and prompted hopes that economic growth might be rebounding. However, this exuberance did not last for long after Friday’s employment gains were less than expected and the unemployment rate edged up. On the week, all indexes (except the Nikkei) followed here posted gains. The Nikkei edged down by 5 points in holiday thinned trading.
Global Stock Market Recap
| |
|
2006 |
2007 |
% Change |
| |
Index |
December 29 |
April 27 |
May 4 |
Week |
Year |
| Asia |
|
|
|
|
|
|
| Australia |
All Ordinaries |
5644.3 |
6141.0 |
6296.2 |
2.5% |
11.5% |
| Japan |
Nikkei 225 |
17225.8 |
17400.4 |
17394.9 |
0.0% |
1.0% |
| |
Topix |
1681.1 |
1701.0 |
1704.2 |
0.2% |
1.4% |
| Hong Kong |
Hang Seng |
19964.7 |
20526.5 |
20841.1 |
1.5% |
4.4% |
| S. Korea |
Kospi |
1434.5 |
1542.5 |
1567.7 |
1.6% |
9.3% |
| Singapore |
STI |
2985.8 |
3398.6 |
3485.8 |
2.6% |
16.7% |
| |
|
|
|
|
|
|
| Europe |
|
|
|
|
|
|
| UK |
FTSE 100 |
6220.8 |
6418.7 |
6603.7 |
2.9% |
4.7% |
| France |
CAC |
5541.8 |
5930.8 |
6068.8 |
2.3% |
9.5% |
| Germany |
XETRA DAX |
6596.9 |
7378.1 |
7516.8 |
1.9% |
13.9% |
| |
|
|
|
|
|
|
| North America |
|
|
|
|
|
|
| United States |
Dow |
12463.2 |
13120.9 |
13264.6 |
1.1% |
6.4% |
| |
NASDAQ |
2415.3 |
2557.2 |
2572.2 |
0.6% |
6.5% |
| |
S&P 500 |
1418.3 |
1494.1 |
1505.6 |
0.8% |
6.2% |
| Canada |
S&P/TSX Comp. |
12908.4 |
13628.5 |
13769.9 |
1.0% |
6.7% |
| Mexico |
Bolsa |
26448.3 |
29355.1 |
30013.9 |
2.2% |
13.5% |
| Markets in Japan were closed on Monday, Thursday and Friday, April 30, May 3 and May 4 |
| Markets in Hong Kong, Singapore and South Korea were closed on Tuesday, May 1 |
| Markets in France, Germany and Mexico were closed on Tuesday, May 1 |
Europe and the UK
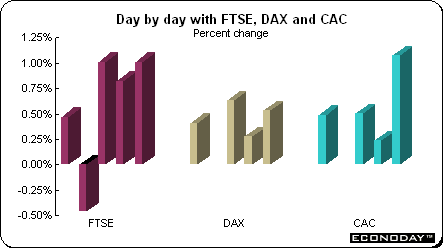
The week got off to a slow start, with most European markets closed Tuesday for May Day. But the FTSE, DAX and CAC rallied in the remainder of the week as favorable data cheered investors about the health of the U.S. economy, better than expected earnings reports and a touch of merger mania, especially in the media sector. The somewhat weaker than expected U.S. employment situation report did not deter equity investors here. The result was that the three indexes toyed with over six year highs. The FTSE climbed over the 6,600 mark Friday and above its September 8, 2000 level. The index’s all time high was recorded on September 4, 2000 when the index hit 6,798.1. The DAX is virtually the same level as it was on April 10, 2000 while the CAC was last at this level on October 17, 2000. The DAX hit its all time high of 8,064.97 on March 7, 2000 while the CAC’s all time high of 6,922.33 was reached on September 4, 2000.
Takeover targets were not confined to the media sector. According to Bloomberg News, UK merger and acquisition deals have totaled $111.7 billion this year and in Europe, they have totaled $988.3 billion. An analyst was quoted as saying that there was no safe haven from takeovers. There is hardly a sector that is not being surveyed for potential mergers.
Asia/Pacific
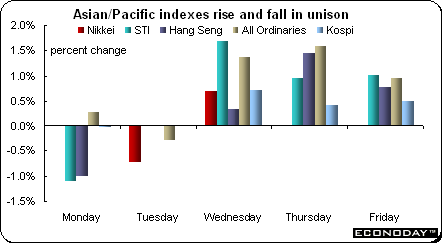
Seemingly, stocks changed direction with each new release of U.S. data. For example, they drooped when personal income did not live up to expectations and soared when data exceeded them. Excluding Japan, the indexes followed here ended the week on an exuberant note and were up anywhere between 1.5 percent to 2.6 percent. Shares gained partially on lower oil prices. Lower energy costs help boost earnings at utility companies and airlines which both count fuel as one of their largest expenses. Cheaper oil also leaves consumers with more money to spend on goods such as computers and mobile phones. Japan’s markets were open for two days of trading — Monday and Wednesday — during the Golden Week holidays. The Nikkei and Topix were virtually unchanged on the week. Most markets were closed for May Day on Tuesday. The Hang Seng hit a new lifetime high, while stock indexes in Australia, Singapore and South Korea among others also set new records.
Reserve Bank of Australia on hold
The Reserve Bank of Australia kept its key interest rate at 6.25 percent as expected. The RBA last changed its interest rate in November 2006 when it increased rates to the current level. Analysts feared that the Bank would have to increase rates again but the first quarter’s consumer price index reading surprised on the low side. Inflation was up 2.4 percent in the first quarter and within the RBA’s inflation target range of 2 percent to 3 percent for the first time in a year. Inflation eased as the rising Australian dollar has cut import costs and banana prices dropped following the end of a cyclone-induced shortage. The RBA does not issue a statement when there is no policy change.
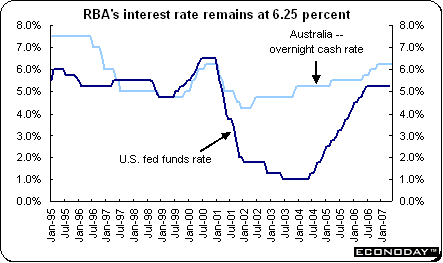
On Friday, the RBA released its new inflation forecasts as part of its quarterly monetary policy statement. It said that inflation would increase at its slowest pace in two years. Traders, as a result, sold the Australian dollar on speculation Governor Glenn Stevens and the monetary board would not have to increase interest rates this year. RBA lowered its core inflation estimate for 2007 to 2.5 percent from its previous estimate of 2.75 percent. The Bank said that the 2008 rate would range from 2.5 percent to 3 percent, unchanged from its previous forecast.
Currencies
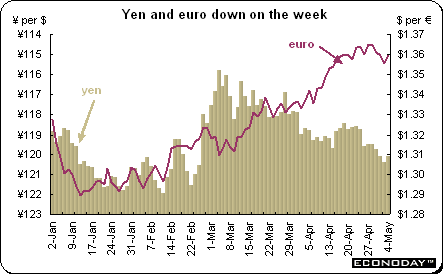
The euro retreated on the week after flirting with its all time high against the U.S. dollar. The dollar recovered somewhat mid-week thanks to good U.S. economic data but then retreated once again on the weaker than expected employment report. The yen edged downward as well in the holiday week.
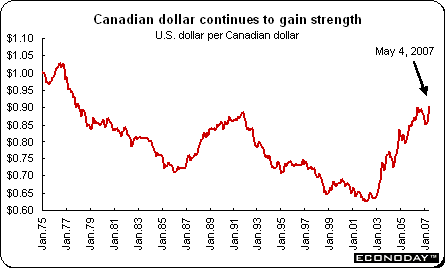
The Canadian dollar touched an eight-month high on Friday of above 90 U.S. cents after the U.S. employment report was released. Investors now think the Canadian economy is more vibrant than its southern neighbor. The currency strengthened after comments by Bank of Canada Governor David Dodge. He reiterated comments that were made earlier in the week. He said that the Bank would not use interest rates as a weapon to slow the Canadian dollar’s appreciation against its U.S. counterpart. There are other reasons for the currency’s strength. The dollar has gained on possible merger and acquisition possibilities. Analysts are speculating that international investors will purchase Canadian companies and boost demand for the currency. High demand for Canadian commodities also has contributed to the currency’s strength.
Indicator scoreboard
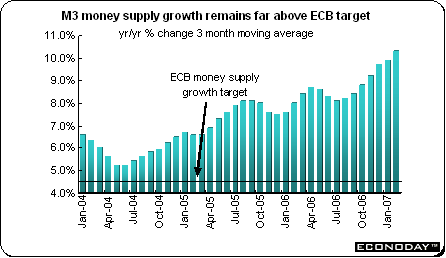
EMU — M3 money supply growth for the three months ending in March was 10.3 percent when compared with the same three months a year ago. For the month of March, M3 was up 10.9 percent on the year for the highest growth rate since February 1983 when M3 was up 11 percent. Private loans soared by 10.5 percent on the year. Total credit extended to the private sector including both households and companies was up 10.8 percent, the same as in February. M3 growth is now over double the ECB’s reference growth rate of 4.5 percent.
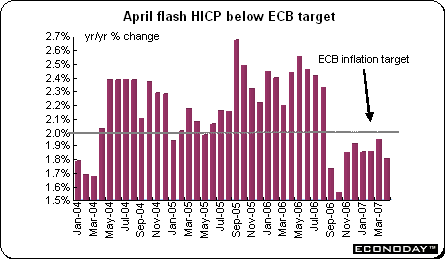
April flash harmonized index of consumer prices edged down to 1.8 percent when compared with last year from 1.9 percent in the previous month. This is below the ECB’s 2 percent ceiling for price increases. As with all flash releases, no detail is available.
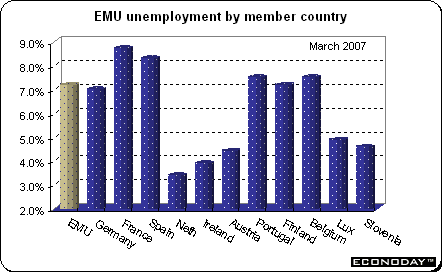
March unemployment rate edged down to 7.2 percent from 7.3 percent in the previous month. A year ago in March 2006, the unemployment rate was 8.2 percent. The rates between countries vary wildly. For example, France’s unemployment rate was 8.8 percent while Spain’s was 8.3 percent. On the low end, the Netherlands and Ireland were 3.4 percent and 3.9 percent respectively. National data differ from those published by Eurostat because of differing adjustment methodology.
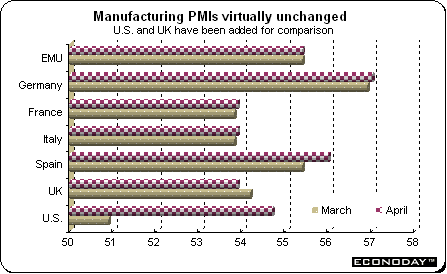
April manufacturing purchasing managers’ index was unchanged at 55.4. Indexes for Germany, France and Italy edged up 0.1 percent while Spain improved to 56 from 55.4 in March. Output prices eased while input prices were up in France and Italy and down in Germany and Spain. New orders slowed as did output growth.
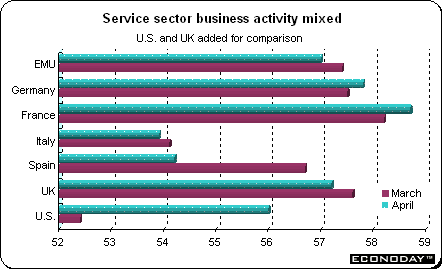
April services purchasing managers’ index weakened slightly to 57 from 57.4 in March. Germany’s index picked up slightly while those in France, Italy and Spain were down for the month. Input prices eased except in France where they were up slightly. However, prices charged were up for the EMU as a whole along with Germany and France. Spanish prices charged were up while in Italy they were unchanged.
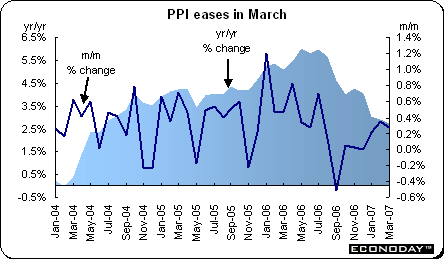
March producer price index was up 0.3 percent and 2.7 percent when compared with the same month a year ago. Energy prices were up 0.6 percent and 0.8 percent on the year. Excluding energy, the PPI was up 0.2 percent and 3.4 percent on the year.
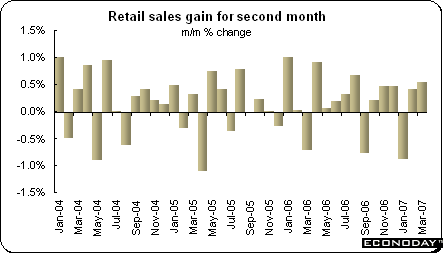
March retail sales were up 0.5 percent and 2.6 percent when compared with last year. Food sales were up 0.7 percent while non-food sales inched up 0.2 percent. French and Spanish sales were up on the month but German sales were down.
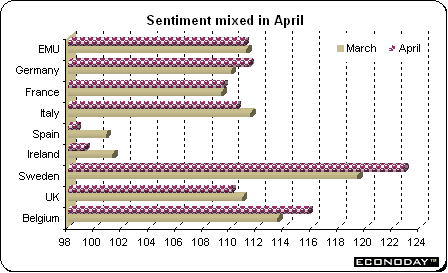
EU — April economic sentiment index crept down to 111 from 111.1 in March. The stabilization in the sentiment indicator is reflected in all sectoral confidence indicators except for the industry sector, where the confidence indicator increased by one point. At the individual country level, the picture was mixed, with a roughly equal number of countries reporting increases or decreases in sentiment. Industrial confidence improved by 1 point in the euro area. Consumer confidence was unchanged. Consumers were more optimistic regarding unemployment expectations, while their views on saving opportunities over the next 12 months deteriorated. Retail, service and construction sectors sentiment were stable in April.
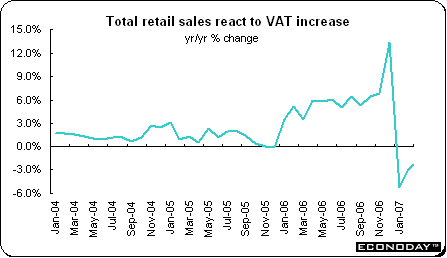
Germany — March real total retail sales were up 0.4 percent but were down 1.8 percent when compared with the previous year. Excluding autos and gasoline, retail sales were down 0.7 percent and down 0.8 percent on the year. Food, drinks & tobacco sales were down 0.8 percent and slipped 0.3 percent on the year while clothing, shoes & leather goods were down 1.5 percent but up 2.6 percent on the year.
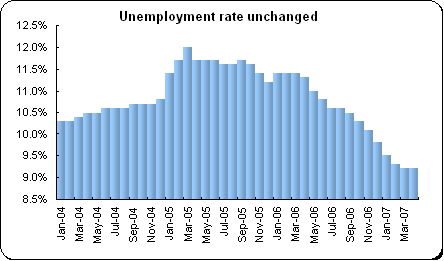
April Bundesbank unemployment rate was unchanged at 9.2 percent. March unemployment as measured by International Labour Organisation methodology and released by the Federal Statistical Agency dropped by 20,000, and an unemployment rate of 6.8 percent was down from 6.9 percent in the previous month. Employment using ILO methodology was up by 76,000. Yet another measure of April unemployment is produced by the Federal Labor Agency. This measure shows that April unemployment was down 9,000 and the unemployment rate unchanged at 9.2 percent. The overall decline was due entirely to a labor market pick-up in western Germany, where joblessness fell by 11,000. This offset a 2,000 increase in the eastern part of the country.
Asia
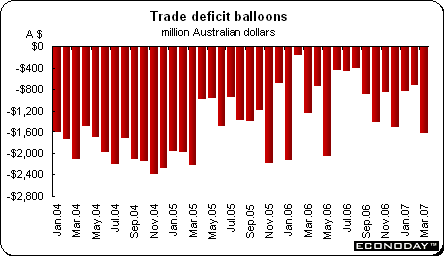
Australia — March merchandise trade deficit ballooned to a 10 month high of A$1.6 billion from A$728 million in February. Exports dropped 4.3 percent while imports were up 0.5 percent. Cyclones in mining regions and drought in the wheat area contributed to the burgeoning deficit. Shipments of non-rural goods, which include minerals, decreased 6 percent while metal ore exports plummeted 20 percent because of cyclones. Farm exports, such as meat and wool, gained 0.4 percent but grains sank 7 percent. Imports of capital goods including business machinery and vehicles were up 0.4 percent but consumer goods imports declined 4 percent.
Americas
Canada — February monthly gross domestic product was up 0.4 percent and 2.1 percent when compared with February of last year. Excluding oil and gas extraction and utilities, monthly GDP was up 0.2 percent. Both goods and services production rose. Wholesale trade, manufacturing and financial services posted gains. However, they were partly offset by declines in construction, retail trade, rail transportation and the accommodation and food services sector. The output of the mining sector, excluding oil and natural gas, was up 1.5 percent on the strength of the non-metallic mineral mines (which include diamond mines). Manufacturing sector output was up 0.3 percent but down 3 percent on the year. Manufacturing activities excluding motor vehicle and parts production decreased 0.2 percent. Of the 21 major manufacturing groups, 10 increased, accounting for 45 percent of total manufacturing value added.
March industrial product price index was up 1.3 percent and 4.8 percent when compared with last year. Petroleum and primary metal products prices caused prices for manufactured goods to surge. On the year, the upward pressure came largely from higher prices for primary metal products and petroleum & coal products tempered by a drop in lumber and other wood product prices. Petroleum and coal product prices jumped 8.9 percent, pushed up by geopolitical tensions and a slowdown in the activity of some refineries. If petroleum and coal prices were excluded, the IPPI would have been up 0.4 percent.
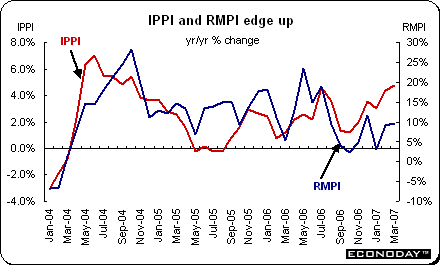
March raw material price index was up 1.3 percent and 9.7 percent when compared with last year thanks mainly to price increases for non-ferrous metals. Mineral fuels were up 0.3% after jumping 5.5 percent in February. Natural gas was up 1.5 percent as a result of colder than expected weather and a decline in inventories. The price for crude oil remained unchanged. Without mineral fuels, the RMPI would have increased 2.3 percent on the month. On the year, raw material prices rose 9.7 percent. Without mineral fuels, the RMPI would have risen 22.3 percent.
The value of the Canadian dollar against its U.S. counterpart was up 0.2 percent in March. Without the effect of the exchange rate, the change in the IPPI would also have been up by 1.3 percent. On the year, the Canadian currency was down 0.9 percent. If the impact of the exchange rate had been excluded, producer prices would have risen 4.5 percent rather than actually advancing 4.8 percent.
Bottom line
Last week saw an important array of new information about the state of the economies in Europe and the U.S. — and for the most part it was good news. While most of the news was good from the U.S., employment gains did not meet expectations but factory orders and the ISMs exceeded them. In Europe, the economy continued to solidify and grow as noted in the EU economic confidence survey and the purchasing managers’ surveys.
If last week was indicator week, this is central bank meetings week. The Federal Reserve, Bank of England and European Central Bank hold policy meetings. The Fed is not expected to change its target federal funds interest rate from 5.25 percent. Analysts will be honing their parsing skills to plumb the depths of the FOMC’s statement for hidden meaning. The ECB is expected to hold its fire until June and maintain its current interest rate of 3.75 percent. The Bank of England, however, is expected to increase its interest rate from the current 5.25 percent to 5.5 percent. The last inflation reading was 3.1 percent, more than a full percentage point over its 2 percent inflation target.
Looking Ahead: May 7 through May 11, 2007
| Central Bank activities |
|
| May 9 |
U.S. |
FOMC Meeting and Announcement |
| May 9,10 |
UK |
Bank of England Monetary Policy Meeting |
| may 10 |
EMU |
European Central Bank Monetary Policy Meeting |
| |
|
|
| The following indicators will be released this week... |
| Europe |
|
|
| May 7 |
Germany |
Manufacturers Orders (April) |
| May 8 |
Germany |
Industrial Production (March) |
| May 9 |
Germany |
Merchandise Trade Balance (March) |
| May 10 |
France |
Merchandise Trade Balance (March) |
| |
|
Industrial Production (March) |
| |
Italy |
Industrial Production (March) |
| |
UK |
Merchandise Trade Balance (March) |
| |
|
Industrial Production (April) |
| |
|
|
| Asia |
|
|
| May 8 |
Australia |
Retail Sales (March) |
| May 10 |
Australia |
Employment, Unemployment (April) |
| |
|
|
| Americas |
|
|
| May 10 |
Canada |
Merchandise Trade Balance (March) |
| May 11 |
Canada |
Employment, Unemployment (April) |
Anne D Picker is the author of International Economic Indicators and Central Banks.

|